
Published July 2, 2026 — ACT Market Analysis Desk
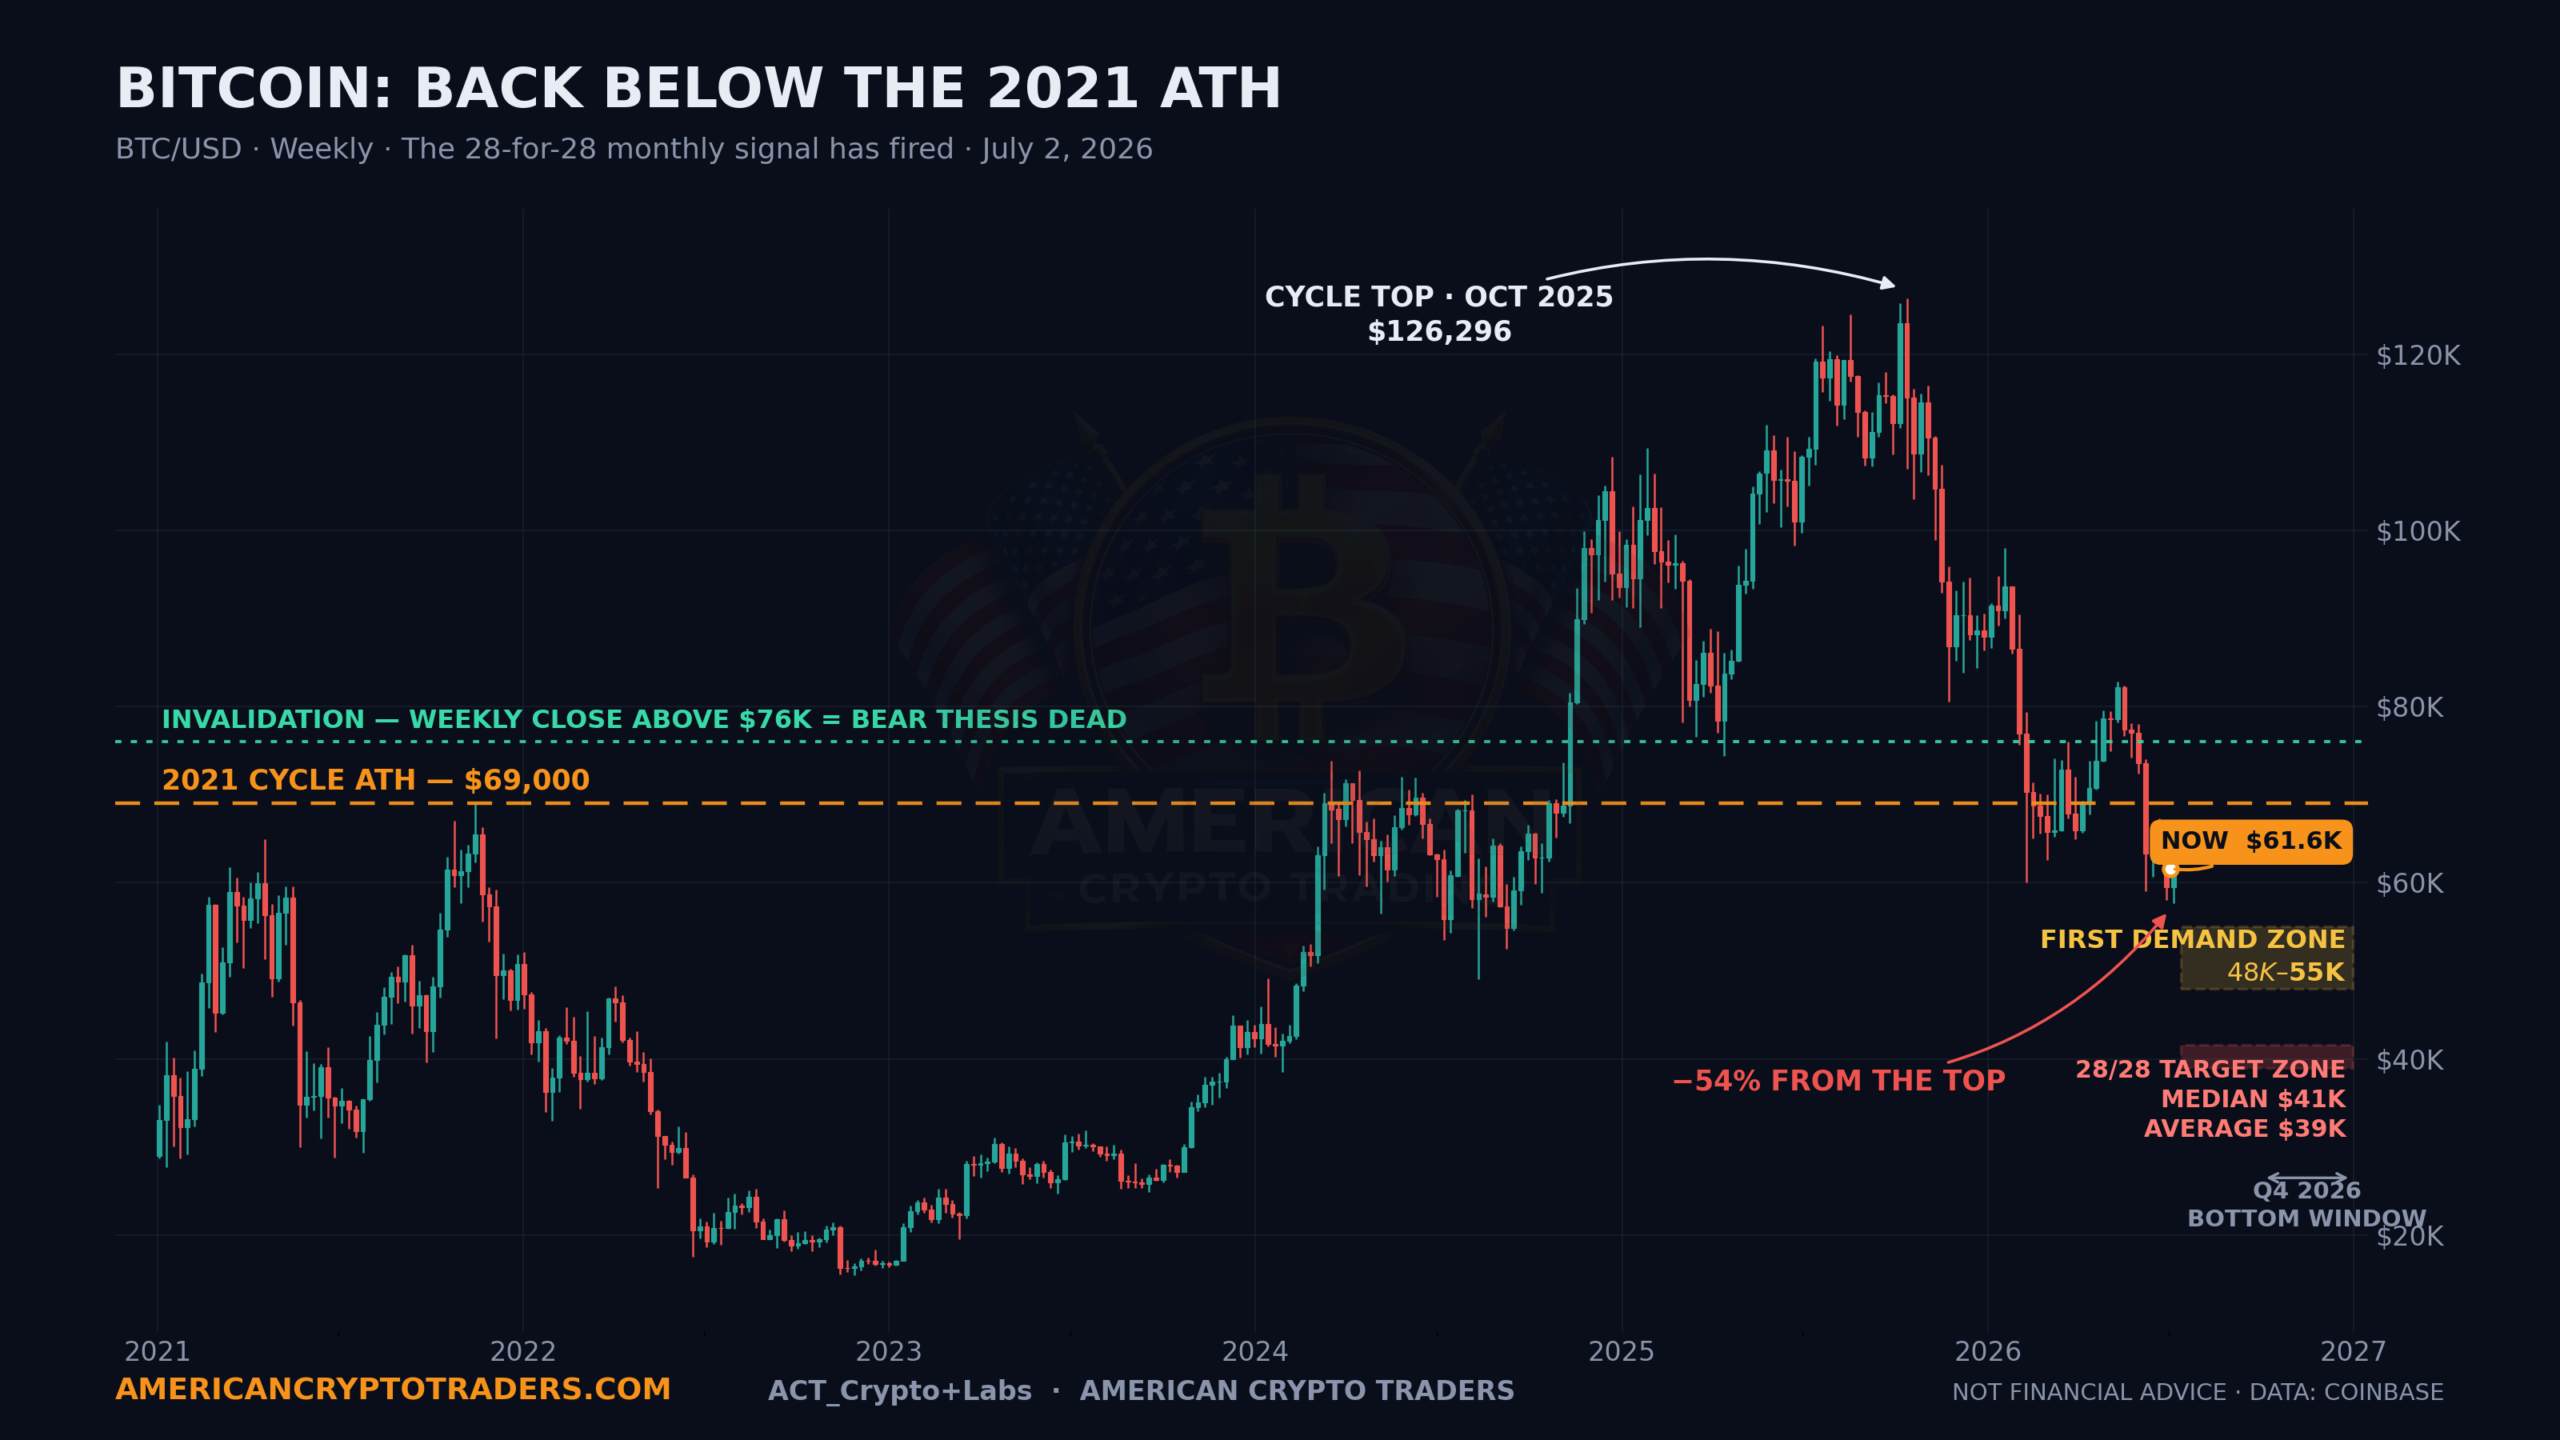
Bitcoin closed the month of June at $58,625, and in doing so it completed one of the most statistically significant monthly candles in its trading history. This wasn’t just a red month. It was a specific type of red month — one that, according to Binance monthly data going back to 2017, has been followed by materially lower prices within six months in 28 out of 28 occurrences.
In this post we break down the candle itself, the historical pattern it triggered, how it lines up with our existing cycle analysis, and the roadmap we’re working from between now and year-end.
The June Candle, By the Numbers
- Open: $73,674
- High: $74,092
- Low: $58,115
- Close: $58,625
That works out to a -20.4% monthly decline with a 21.6% high-to-low range — and, critically, a close in the bottom 3.2% of the entire candle. Buyers made essentially no attempt to reclaim ground into the monthly close. In candle-structure terms, that’s the market telling you distribution finished the month in full control.
The 28-for-28 Signal
Here’s the pattern definition: a red monthly candle with a high-to-low range of 20% or greater. Since Binance began publishing BTC data in 2017, this setup has appeared 28 times — and in all 28 cases, Bitcoin traded significantly lower at some point within the following six months.
The magnitude of the follow-through is what matters for planning:
- Median additional drawdown: -29.7% — from June’s close, that projects to roughly $41,200
- Average additional drawdown: -33.0% — projecting to roughly $39,300
Is a 28-sample dataset gospel? No — and we’d caution anyone against treating any single pattern as destiny. But for context, the back-of-the-napkin coin-flip odds of a 28-for-28 streak occurring by pure chance work out to roughly 1 in 134 million. Patterns with that kind of consistency have earned a seat at the table, even if they don’t get the only vote.
Why This Lines Up With the Cycle Clock
What makes this signal compelling isn’t the stat in isolation — it’s that a completely independent framework points to the same destination.
Bitcoin topped at $126,173 in October 2025, roughly 18 months after the April 2024 halving — right on schedule versus the 2017 and 2021 cycles. Since then, the market has printed a textbook sequence of lower highs: $126K → $117K → $84K → and now sub-$58K lows. Price has fallen back below the 2021 cycle high (~$69K) and back inside the 2024 accumulation range ($53K–$73K).
The historical bear-market rhythm adds the timing element. The 2021–2022 bear ran roughly 12.5 months from top to bottom, with the final low printing about 21% below the prior cycle’s all-time high. Applied to this cycle, that math produces:
- Bottom window: October–December 2026 (12–13 months from the October 2025 top)
- Prior-ATH undercut target: ~$54,300 (21% below $69K)
- -60% drawdown level: ~$50,500
- 2024 range low: $52,000–$53,000
Our cycle work identifies $48K–$55K as the first major demand zone. The 28-for-28 monthly candle data suggests the downside can extend beyond it — into the $39K–$41K band — before this bear is finished. Two independent models, one Q4 destination.
The Roadmap
| Horizon | Bias | Base Case |
|---|---|---|
| Next 7 days | Mildly bullish | Oversold bounce extends toward $63K–$65K |
| Next 30 days | Relief rally, then fade | Bear-market rally tags $66K–$70K and stalls |
| Next 60 days | Bearish | The June lows fail; price probes $52K–$55K |
| Next 120 days | Bearish into a bottom | Capitulation through $48K–$55K, with the 28-for-28 data flagging $39K–$41K as the full downside scenario |
A word on the near term: bear-market bounces are violent, and the current one off the sub-$58K lows is real. Expect it to look convincing. Historically, the rally that follows a signal like June’s is precisely what draws sidelined capital back in before the final leg lower. Respect the bounce — don’t marry it.
Key Levels to Watch
- Resistance: $62.6K–$63.2K → $64.5K–$65K → $67.3K → $72K → $76K–$80K
- Support: $59.5K → $57.7K–$58.1K → $54.3K → $50K–$52K → $48K → $41K → $39K
What Would Invalidate This
Every thesis needs a kill switch, and ours is simple: a weekly close above $76K breaks the lower-high structure that has defined this market since October and forces us to abandon the bearish roadmap entirely. Until that happens, our operating assumption is that rallies are distribution.
How We’re Approaching It
Short-term traders have a legitimate long setup while $59.5K holds, targeting the $63K–$65K resistance cluster. Swing traders should be watching the $66K–$72K zone over the coming weeks as the higher-probability short entry, with invalidation above $76K. And for accumulators, the takeaway is patience: if history is any guide, the best entries of this entire cycle are still ahead of us — staged across the $48K–$55K demand zone, with dry powder reserved for a $39K–$42K scenario. Size every position so that the average-case outcome is survivable, not just the one you’re hoping for.
We’ll update this roadmap as the structure develops. Sub-$58K monthly closes don’t happen often — and when they do, they’ve never been the end of the story.
Disclaimer: This article is for educational and informational purposes only and does not constitute financial, investment, or trading advice. Historical patterns do not guarantee future results, and the referenced dataset represents a limited sample. Cryptocurrency trading involves substantial risk of loss. Always do your own research and consult a licensed financial advisor before making investment decisions. American Crypto Traders and its contributors may hold positions in the assets discussed.
Originally published on American Crypto Traders
This article was syndicated from the American Crypto Traders daily brief. For original analysis and trading signals, visit americancryptotraders.com