

Bitcoin experienced a price dip, touching $117,914 earlier today, leading to market liquidations totaling $47.5 million. Despite this, the overall positive trend for Bitcoin remains largely unchanged.
Summary
- The value of Bitcoin briefly fell to $117,914, triggering liquidations amounting to $47.5 million.
- The leading cryptocurrency has encountered difficulty surpassing the $119,000 mark in several attempts.
- Over the past month, Bitcoin’s dominance in the cryptocurrency market has decreased by 4.98%.
What Caused the Recent BTC Price Decrease?
The price of Bitcoin saw a decline today as it entered a zone of increased liquidity between $118,000 and $119,000. This area contained many leveraged long positions, representing substantial bets from traders anticipating a continued price surge.
Many of these positions were initiated quickly, without solid confirmation, likely fueled by a fear of missing out (FOMO) following Bitcoin’s rapid climb from $115,000 to almost $120,000 last week.
When the price failed to continue its upward trajectory and instead dropped into this high-liquidity zone, these leveraged long positions were automatically liquidated. This triggered a cascade of forced selling, further driving the price down.
According to liquidation data from CoinGlass covering the last 24 hours, further downside pressure could push Bitcoin lower into the $118,000 range, where another concentration of vulnerable long positions remains.
At the time of this report, Bitcoin bulls are attempting to regain the $119,000 level after numerous failed attempts to break through this resistance area in recent weeks.
The liquidation heatmap reveals a significant cluster of short positions concentrated between $120,000 and $120,600. This creates a substantial resistance zone that has repeatedly limited Bitcoin’s upward movement lately.
Each attempt to reclaim $119,000 during the day has faced strong selling pressure, likely resulting from automated liquidations and the re-entry of short positions.
Part of the recent selling activity stems from profit-taking by early investors and day traders, particularly as Bitcoin continues to trade near its all-time high of $122,838, representing a gain of over 61% since its lows in April.
Concurrently, market momentum seems to be shifting away from Bitcoin and toward Ethereum and the broader alternative cryptocurrency (altcoin) market. Bitcoin’s market share has decreased by 4.98% over the past month, while Ethereum’s market share has increased by 2.98% during the same period.
Ethereum has shown stronger relative gains in recent trading sessions, supported by a significant increase in demand for spot ETH ETFs, which experienced inflows exceeding $1.8 billion this week, compared to just $72 million for Bitcoin.
This shift in capital has also extended to higher-risk altcoins such as Solana, Avalanche, and Chainlink, as traders seek opportunities for increased volatility amid Bitcoin’s stalled attempts to break out.
Is Bitcoin’s Bull Run Concluding?
Analysts at CryptoQuant suggest that Bitcoin may still have further potential for growth before reaching a cycle peak.
In an analysis published on July 28, CryptoQuant contributor Yonsei Dent noted that Bitcoin’s MVRV ratio, which compares its current market price to the average cost basis of all coins, is approaching levels that have previously indicated major market tops.
The 365-day moving average of this ratio is forming a double-top pattern, similar to the pattern observed during the 2021 bull cycle, where the second peak closely coincided with the market’s highest point.
While the second MVRV peak may occur in September if the pattern persists, Dent cautioned that the market could experience a reversal as early as late August.
“In summary, we are entering a phase where both optimism and caution are necessary,” Dent stated.
For Bitcoin’s rally to continue, analysts emphasize the importance of a decisive break above the $119,500 resistance level.
According to BitBull, Bitcoin is currently testing a long-term trendline. A confirmed weekly close above $119,500 could initiate a subsequent rally toward $135,000 in the coming weeks.
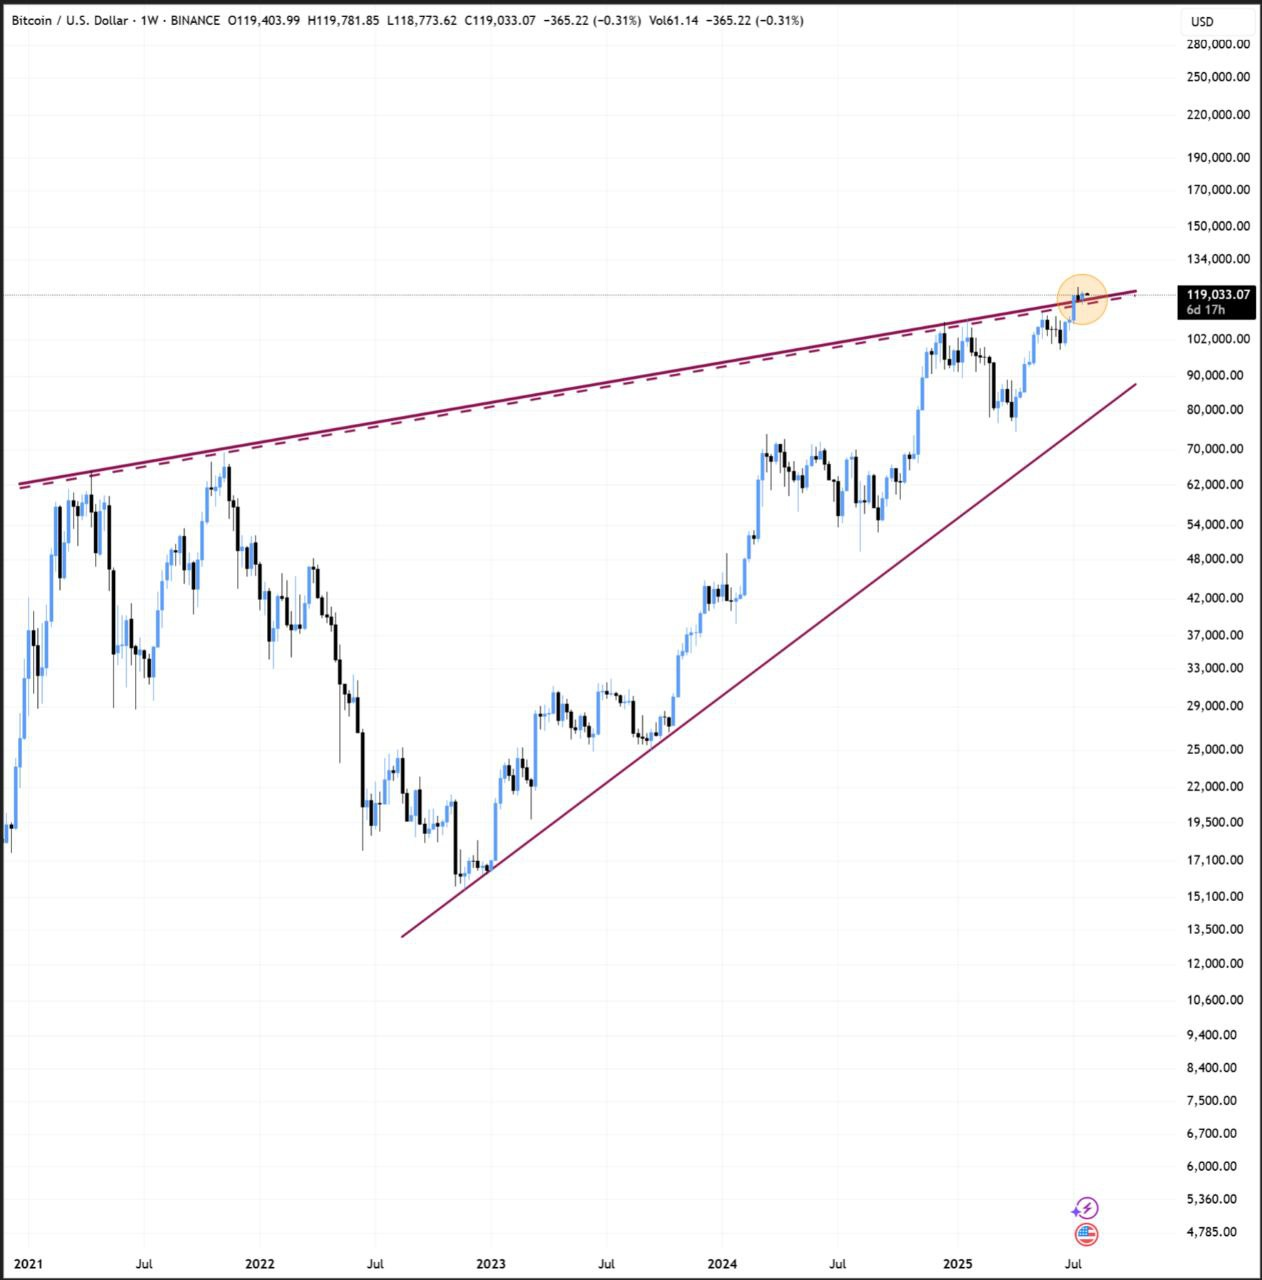
This upward momentum could be supported by improved macroeconomic sentiment as the U.S. progresses in trade negotiations with key partners.
Furthermore, any dovish signals from the Federal Reserve, scheduled to meet this Wednesday, or indications of potential rate cuts later in the year, could boost risk appetite and provide short-term gains for Bitcoin.
Disclaimer: This article should not be considered as investment advice. The information provided on this page is for informational and educational purposes only.