

Key Observation:
-
Bitcoin is showing resilience around the $107,245 mark, suggesting strong investor confidence as dips are quickly bought up.
Bitcoin (BTC) is attempting to recover from recent fluctuations, hinting at buyers stepping in during price drops. While just shy of its peak value of $111,980, Bitcoin is considered to be within a fair valuation zone. According to Axel Adler Jr., a contributor to CryptoQuant, the Mayer Multiple is currently at 1.1x, placing it “within the neutral range (0.8–1.5х)” on X.
Is Bitcoin poised to overcome its prior peak and continue its upward trajectory? Let’s examine the charts for potential clues.
Bitcoin Price Outlook
Bitcoin’s price is currently fluctuating between the 20-day exponential moving average (EMA) at $107,314 and resistance at $110,530.
The upward trend of the 20-day EMA and the relative strength index (RSI) being in positive territory suggest a possible breakout to the upside. Should Bitcoin surpass the $110,530 resistance, the BTC/USDT pair might test the all-time high of $111,980 and then the neckline of an inverse head-and-shoulders pattern.
Sellers are anticipated to provide stiff opposition at the neckline, as a successful break above this point would validate the bullish pattern, potentially paving the way for a rally toward the $150,000 target.
This positive outlook could be challenged if the price reverses and falls below the 50-day simple moving average (SMA) at $106,642. This could encourage short-term investors to secure profits, potentially driving the pair down to $104,500 and then $100,000.
See Also: Historical data shows Bitcoin price surged 72% to 84% following specific holder behavior patterns
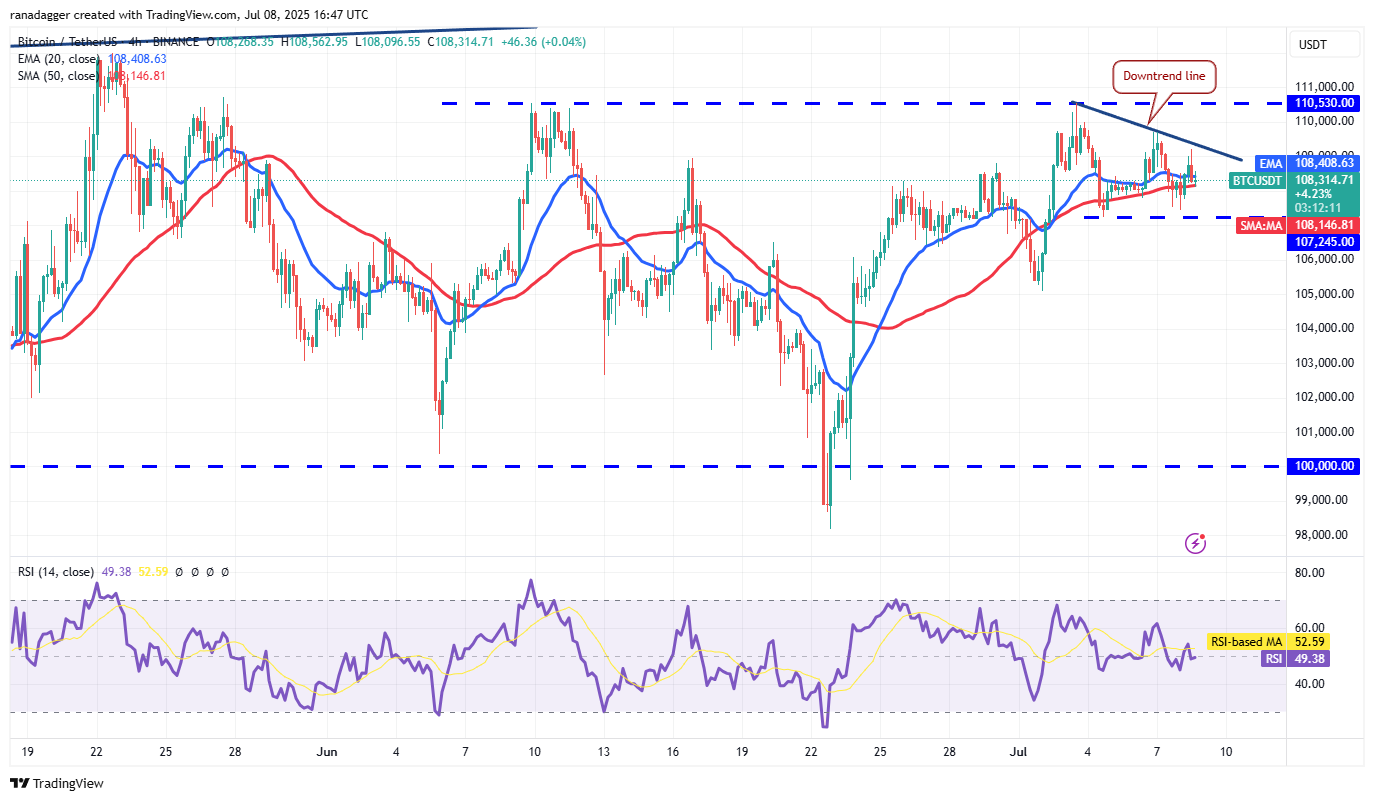
The current support at $107,245 signals that buyers are actively purchasing any minor pullbacks. A successful push above the descending trendline would invalidate the forming descending channel pattern. This breakdown of a bearish signal would raise the chances of overcoming the $110,530 barrier. If that happens, the pair could rise towards $111,980 and subsequently to $113,500.
Conversely, if the price retreats and dips below $107,245, a bearish pattern confirmation could occur, potentially leading to a fall towards the pattern target of $103,960.
This analysis should not be interpreted as financial advice. Investing and trading always carries inherent risks, and readers are encouraged to do their own research before making any decisions.