

Key Points
- Valuing Ethereum is aided by tools like the Mayer Multiple and MVRV Pricing Bands.
- The MVRV Pricing Bands indicator can signal a period of price stability before a significant price surge.
- The Mayer Multiple suggests Ethereum is currently undervalued based on historical trends.
The current market cycle for Ethereum has unfolded uniquely compared to previous cycles. A notable difference is that ETH has not yet achieved a new record high, while Bitcoin (BTC) has come close to doubling its previous peak value.
Despite this, optimistic indicators remain. The MVRV Pricing Bands and Mayer Multiple models propose that Ethereum’s price is below its potential and that the most substantial bullish phase of its cycle is still ahead.
Let’s explore what these indicators imply for Ethereum’s potential performance in 2025.
Understanding MVRV Pricing Bands
The Market Value to Realized Value (MVRV) ratio helps gauge whether an asset is trading above or below its intrinsic value. It accomplishes this by comparing the asset’s current market capitalization to its realized capitalization, which is often viewed as its fair value.
The pricing model employs bands to identify periods of extreme unrealized gains or losses. An extreme loss phase (represented in blue) is marked when the MVRV dips below 0.8 for 5% of trading days. Conversely, an extreme profit phase (in red) occurs when the MVRV surpasses 2.4 for 6% of the trading days.
During the 2017-2018 cycle, Ethereum exceeded the upper band twice (indicated by black arrows) before that market cycle concluded.
In 2021, this only happened once (red arrows). This current cycle appears to be the least volatile, given Ethereum hasn’t yet broken above this level.
However, the current period of consolidation mirrors similar patterns observed in 2017 and 2021 (highlighted with black circles) immediately prior to Ethereum’s price experiencing rapid growth.
Even though this consolidation phase has lasted longer than in previous cycles, it doesn’t deviate enough to entirely negate the bullish parallels with Ethereum’s historical performance.
To maintain the validity of this comparison, the price must avoid falling below the 0.8 band again.
Decoding the Mayer Multiple Model
The Mayer Multiple uses moving averages to assess whether Ethereum is exhibiting overbought or oversold conditions. Specifically, it analyzes the price’s relationship to its 200-day moving average (200-day MA, represented in blue), establishing multiples of 2.4 (red) and 0.8 (green) relative to the 200-day MA.
Historically, Ethereum’s market cycle peaks have coincided with the price surpassing the 2.4 multiple, while cycle bottoms have occurred when the price falls below the 0.8 multiple. The ETH price has exceeded the 2.4 multiple in every cycle except the present one.
Although the price has crossed its 200-day MA multiple times, it has not managed to gather sufficient momentum to cross the 2.4 threshold.
An intriguing resemblance exists between the price movement observed in 2019-2020 (denoted by the black line) and the current trend (brown line). The pattern unfolds in the following sequence:
- The ETH price drops below its 0.8 multiple.
- It subsequently rises above both the 0.8 multiple and the 200-day MA.
- The price then declines below the 0.8 multiple but establishes a higher low.
- The subsequent surge above these levels marks the commencement of a bullish trend.
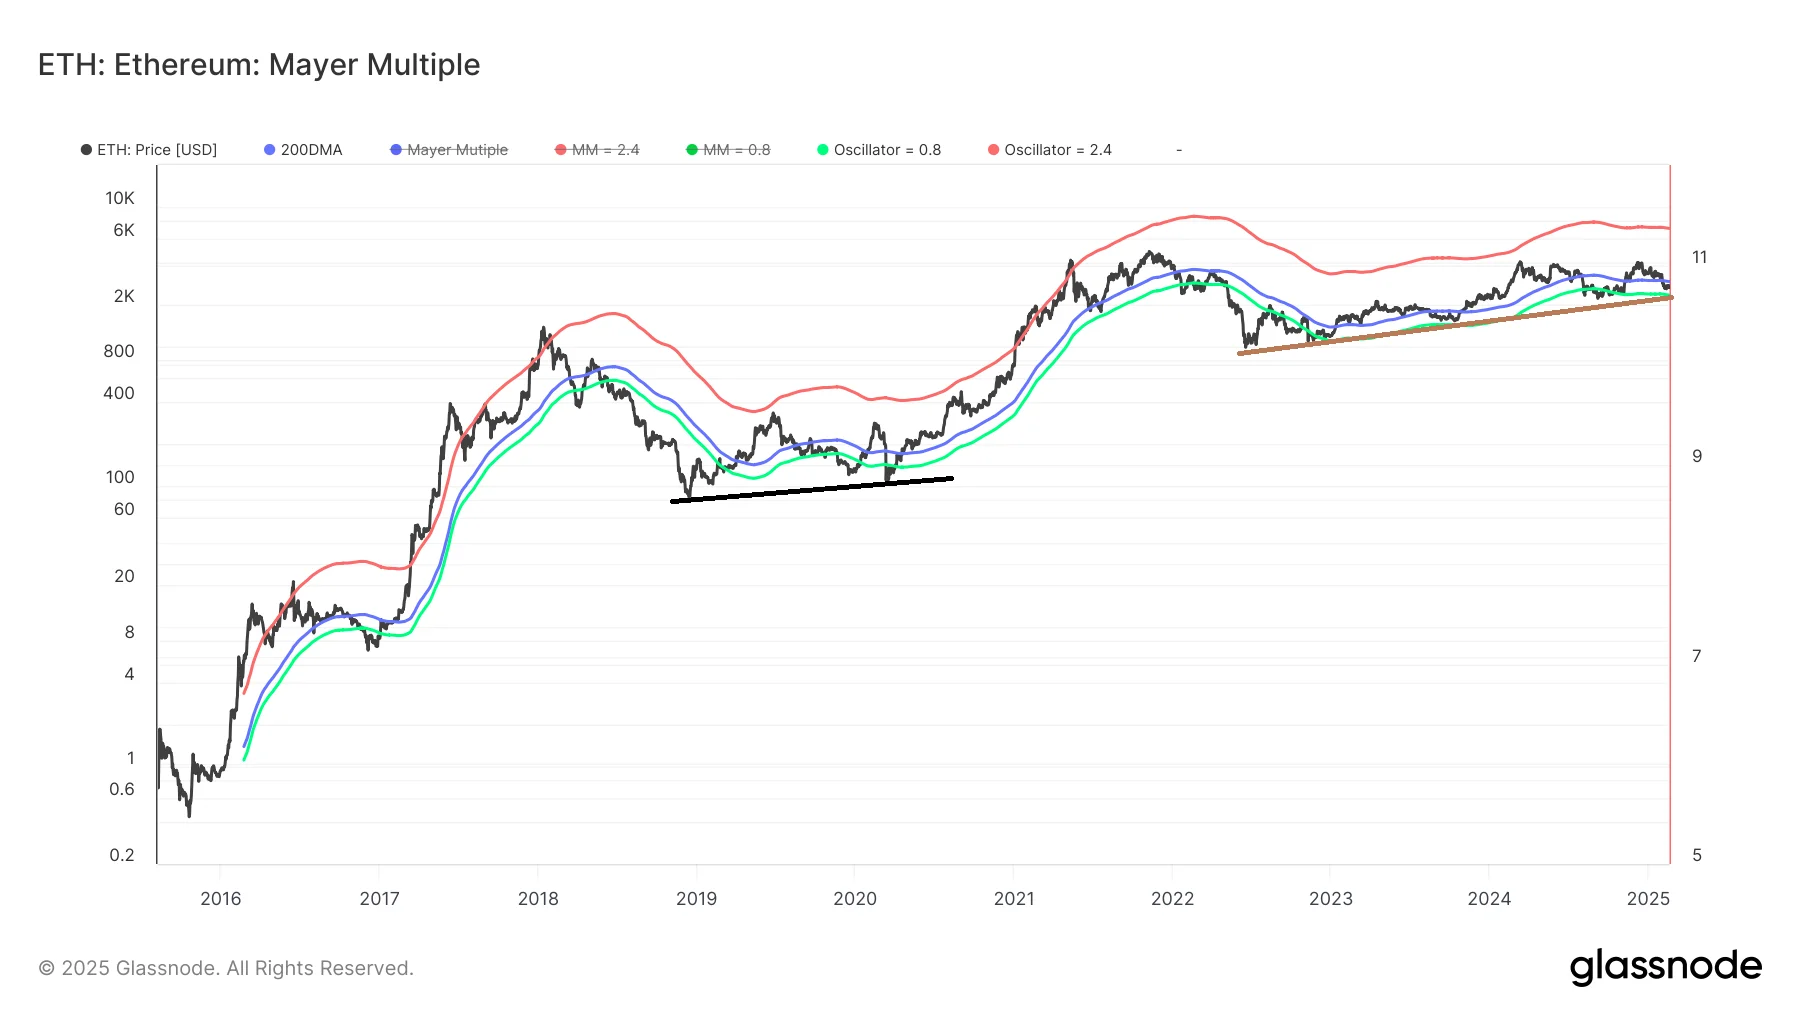
ETH is currently at the fourth stage of this pattern. To validate this outlook, the price needs to show upward momentum quickly, as another drop under the 0.8 multiple would invalidate this pattern.
Analyzing Ethereum’s Valuation
The Ethereum Mayer Multiple Model indicates that Ethereum is significantly undervalued. The current indicators are reminiscent of those seen in 2020, just before the price initiated a major bull run.
The MVRV pricing band showcases a similar fractal pattern of consolidation that previously led to a rapid price increase.
It’s important to note that these two indicators contrast with others, such as the NUPL and Realized Price to Liveliness ratio, which imply Ethereum’s market cycle may have already reached its peak.
Therefore, on-chain data presents a mixed picture regarding Ethereum’s current position in its market cycle.
Disclaimer:
This article is intended for informational purposes only and should not be taken as financial advice. We do not guarantee the accuracy or reliability of the information presented. Investing in cryptocurrencies involves risk, and past performance is not indicative of future results. Consult a qualified financial advisor before making any investment decisions.
Did you find this helpful?