

Bitcoin has experienced a price decline, moving below the $115,724 to $122,077 range it had maintained for the past couple of weeks. The cryptocurrency has recently touched a low near $114,000. This downward movement indicates a weakening of bullish momentum in the short term. The price point of $117,000, which previously acted as a support level, is now the immediate resistance that must be overcome to suggest a potential price recovery.
Related Reading
This downturn occurs at a crucial juncture as overall market sentiment is showing signs of change. Newly released data from CryptoQuant reveals that futures market sentiment has turned somewhat pessimistic. Although it has rebounded to around 48%, it initially dipped sharply. Any reading below 50% is generally interpreted as an indication of bearish sentiment. This development adds further strain to the fragile technical setup, leading many traders to anticipate possible further declines.
Unless buyers swiftly push the price back above $117,000 and sustain it, Bitcoin could face a more significant correction. Although longer-term support levels are still holding, suggesting the overall bullish trend remains, this price drop represents the most substantial loss of upward momentum in recent weeks. Upcoming trading sessions will be crucial in determining if this is simply a temporary setback or the beginning of a larger trend reversal.
Bitcoin Sentiment Index Suggests Increasing Pessimism
Leading analyst Axel Adler recently shared new insights regarding the Bitcoin Advanced Sentiment Index. This index is a key tool for assessing futures market positions and general investor confidence. Adler noted that the index recently fell to 40%, reflecting increasing caution and bearish sentiment. Despite a subsequent recovery to 48%, the index remains below the critical 50% mark, which separates bullish and bearish territories.
This recovery indicates a temporary respite in the negative outlook, but the overall trend suggests a move from cautious optimism to increased apprehension. Adler points out that the market lacks the necessary confidence to sustain an upward trajectory as long as the index remains below 50%. Traders are becoming more cautious, reducing their long positions and bracing themselves for potential further price declines.
Should this negative momentum persist, Bitcoin could test the $112,000 level – the previous all-time high established in May. This area might serve as a psychological and technical support level, but failing to maintain it could lead to a deeper price correction.
With the Advanced Sentiment Index indicating bearish territory and price action weakening, the market appears to be entering a riskier phase. Although this does not yet signal a complete reversal of the overall trend, it does reflect growing uncertainty. Until both sentiment and price recover to higher levels, a cautious approach is advised. The next move will likely hinge on whether buyers can defend the $112,000 level or whether sellers take complete control of the trend.
Related Reading
Bitcoin Drops Below Key Support Following Breakdown
Bitcoin has officially fallen below its two-week consolidation range, losing the crucial $115,724 support level. The price briefly touched a new local low of $114,116 before rebounding slightly to around $115,100, where it is currently trying to find stable ground. This marks a significant shift in momentum, as buyers failed to defend the lower boundary of the range, which had held firm throughout July.
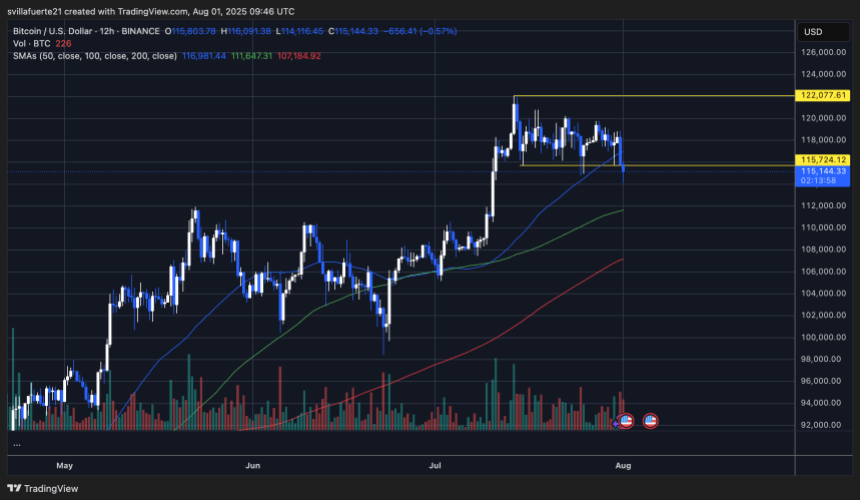
The 12-hour chart reveals increased trading volume accompanying this breakdown, reinforcing the significance of the bearish movement. Bitcoin is now trading below the 50-day SMA ($116,981), confirming weakness in the short-term market structure. The next significant support level lies around $112,000 – the previous all-time high recorded in May – which could act as both a psychological and technical floor.
Related Reading
The 100-day and 200-day SMAs remain considerably below the current price action, suggesting that the overall macro trend remains intact. However, short-term momentum has clearly shifted downwards, and buyers must quickly reclaim the $117,000 area to negate this breakdown.
Featured image from Dall-E, chart from TradingView