

- Since July 28th, Chainlink has experienced a 17.2% decrease in value; however, analysis of on-chain metrics, such as a decrease in MVRV and sudden spikes in inactive coin circulation, suggests that the most significant part of the selling pressure may have concluded.
- The $15.5 price range represents a crucial point to monitor, supported by both the 50-day moving average and prior periods of strong purchasing activity. Any potential upward trend reversal is expected to begin around this price level.
- While the overall market conditions presently indicate a downward trend, a period of price stability for Bitcoin could potentially initiate a recovery in LINK’s value, contingent on an improvement in general market sentiment.
Recently, Chainlink has seen a downturn, with its value decreasing by 17.2% since July 28th. Notably, Bitcoin also experienced a decrease of 4.9%, going from $119.8K to approximately $113.6K. This indicates that LINK’s decline is not an isolated incident. The key question now is whether this downward trend has reached its conclusion or if this is merely a temporary pause.
Potential Exhaustion of Profit-Taking Activity
Rather than focusing on standard chart indicators, let’s examine underlying data. Data from Santiment revealed a significant increase in Dormant Circulation on August 1st. Such increases typically indicate a “selling spree,” as older, previously inactive tokens are moved, likely to be sold on exchanges. This aligns with LINK’s over 5% decline on the same day.
Additionally, the 90-day Mean Coin Age has been trending downward. This suggests increased coin movement rather than long-term holding, implying a recent phase of distribution where holders are selling their assets. This trend is not necessarily a positive indicator for continued upward price movement.
The MVRV ratio, an indicator of overall profitability, has decreased alongside the price. As this ratio approaches zero, it signals a diminishing number of profitable holders, suggesting that the majority of selling pressure may be nearing its end, although this remains uncertain.
$15.5 – A Pivotal Price Level?
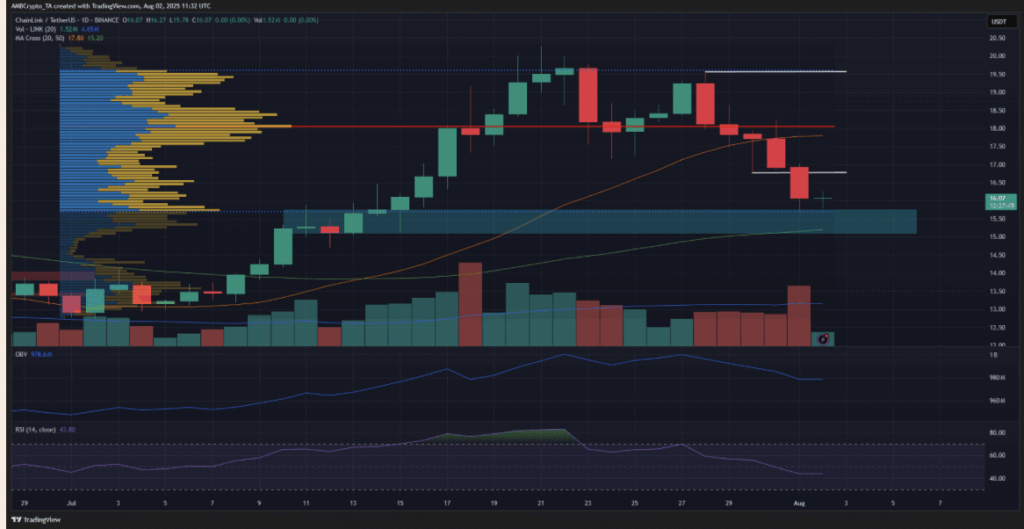
From a technical analysis perspective, the situation is not yet entirely favorable. The Relative Strength Index (RSI) is below the neutral threshold of 50, and the On Balance Volume (OBV) is declining, indicating continued selling pressure. Overall market structure continues to suggest a downward trend. However, the $15.5 price level presents a potential area of support.
This price range has historical significance. LINK previously consolidated around this level in mid-July before experiencing a significant price increase. This level is further strengthened by its alignment with the 50-day moving average and the Value Area Low (approximately $15.7) as indicated by the Fixed Range Volume Profile. This convergence of factors suggests substantial activity at this price point.
If buyers intend to initiate a recovery, this price zone is the most likely location for such a move.
The Influence of Bitcoin on Chainlink
It is essential to recognize that Chainlink’s price movements are closely correlated with Bitcoin’s performance. A decline in Bitcoin’s price can negatively impact Chainlink. If Bitcoin achieves a period of stability, it could provide Chainlink with an opportunity to recover.
Therefore, there is a possibility that Chainlink has reached a short-term bottom. However, this is not a certainty. It is advisable to closely monitor the $15.5 price level and hope for Bitcoin to stabilize its price.
The post Is the Pain Over for Chainlink? On-Chain Data Says… Maybe first appeared on BlockNews.