

- XRP Price Surges, Sustaining Gains Despite Decreasing Spot Market Activity and Growing Futures Market Interest.
- Potential Profit-Taking Looms as XRP Holdings on Exchanges Rise Significantly, Reaching 3.5 Billion XRP.
- XRP in Profit Volume Skyrockets, Approaching May Highs Near 62 Billion, Suggesting a Possible Short-Term Reversal.
Ripple (XRP) is experiencing a resurgence, mirroring the upward trend of other major cryptocurrencies, and is currently trading above $2.80. Current technical indicators point toward a positive outlook for XRP, with the possibility of breaking through the key psychological barrier of $3.00.
However, blockchain data presents hints of a possible slowdown in this upward momentum. Investors may be securing profits or transferring XRP to exchanges to potentially sell. Analyzing metrics such as Exchange Balance and Total Supply in Profit could provide a comprehensive understanding of XRP’s future direction, especially as general market risk appetite increases.
What Factors are Shaping XRP’s Future as Exchange Balances and Supply in Profit Increase?
XRP has maintained a positive trend since its dip to $1.90 in June, gaining approximately 50% in value.
This consistent price appreciation can be partly attributed to a growing willingness to take risks within the market and a strengthening derivatives sector, as indicated by the Open Interest (OI) in futures contracts climbing to $5.9 billion, a notable increase from $3.5 billion on June 23.
XRP futures Open Interest | Source: CoinGlass
CryptoQuant’s Spot Volume Bubble Map reveals a decrease or cooling in trading volume within the spot market. Often, reduced spot market activity signifies waning interest in XRP, potentially hindering further price increases.
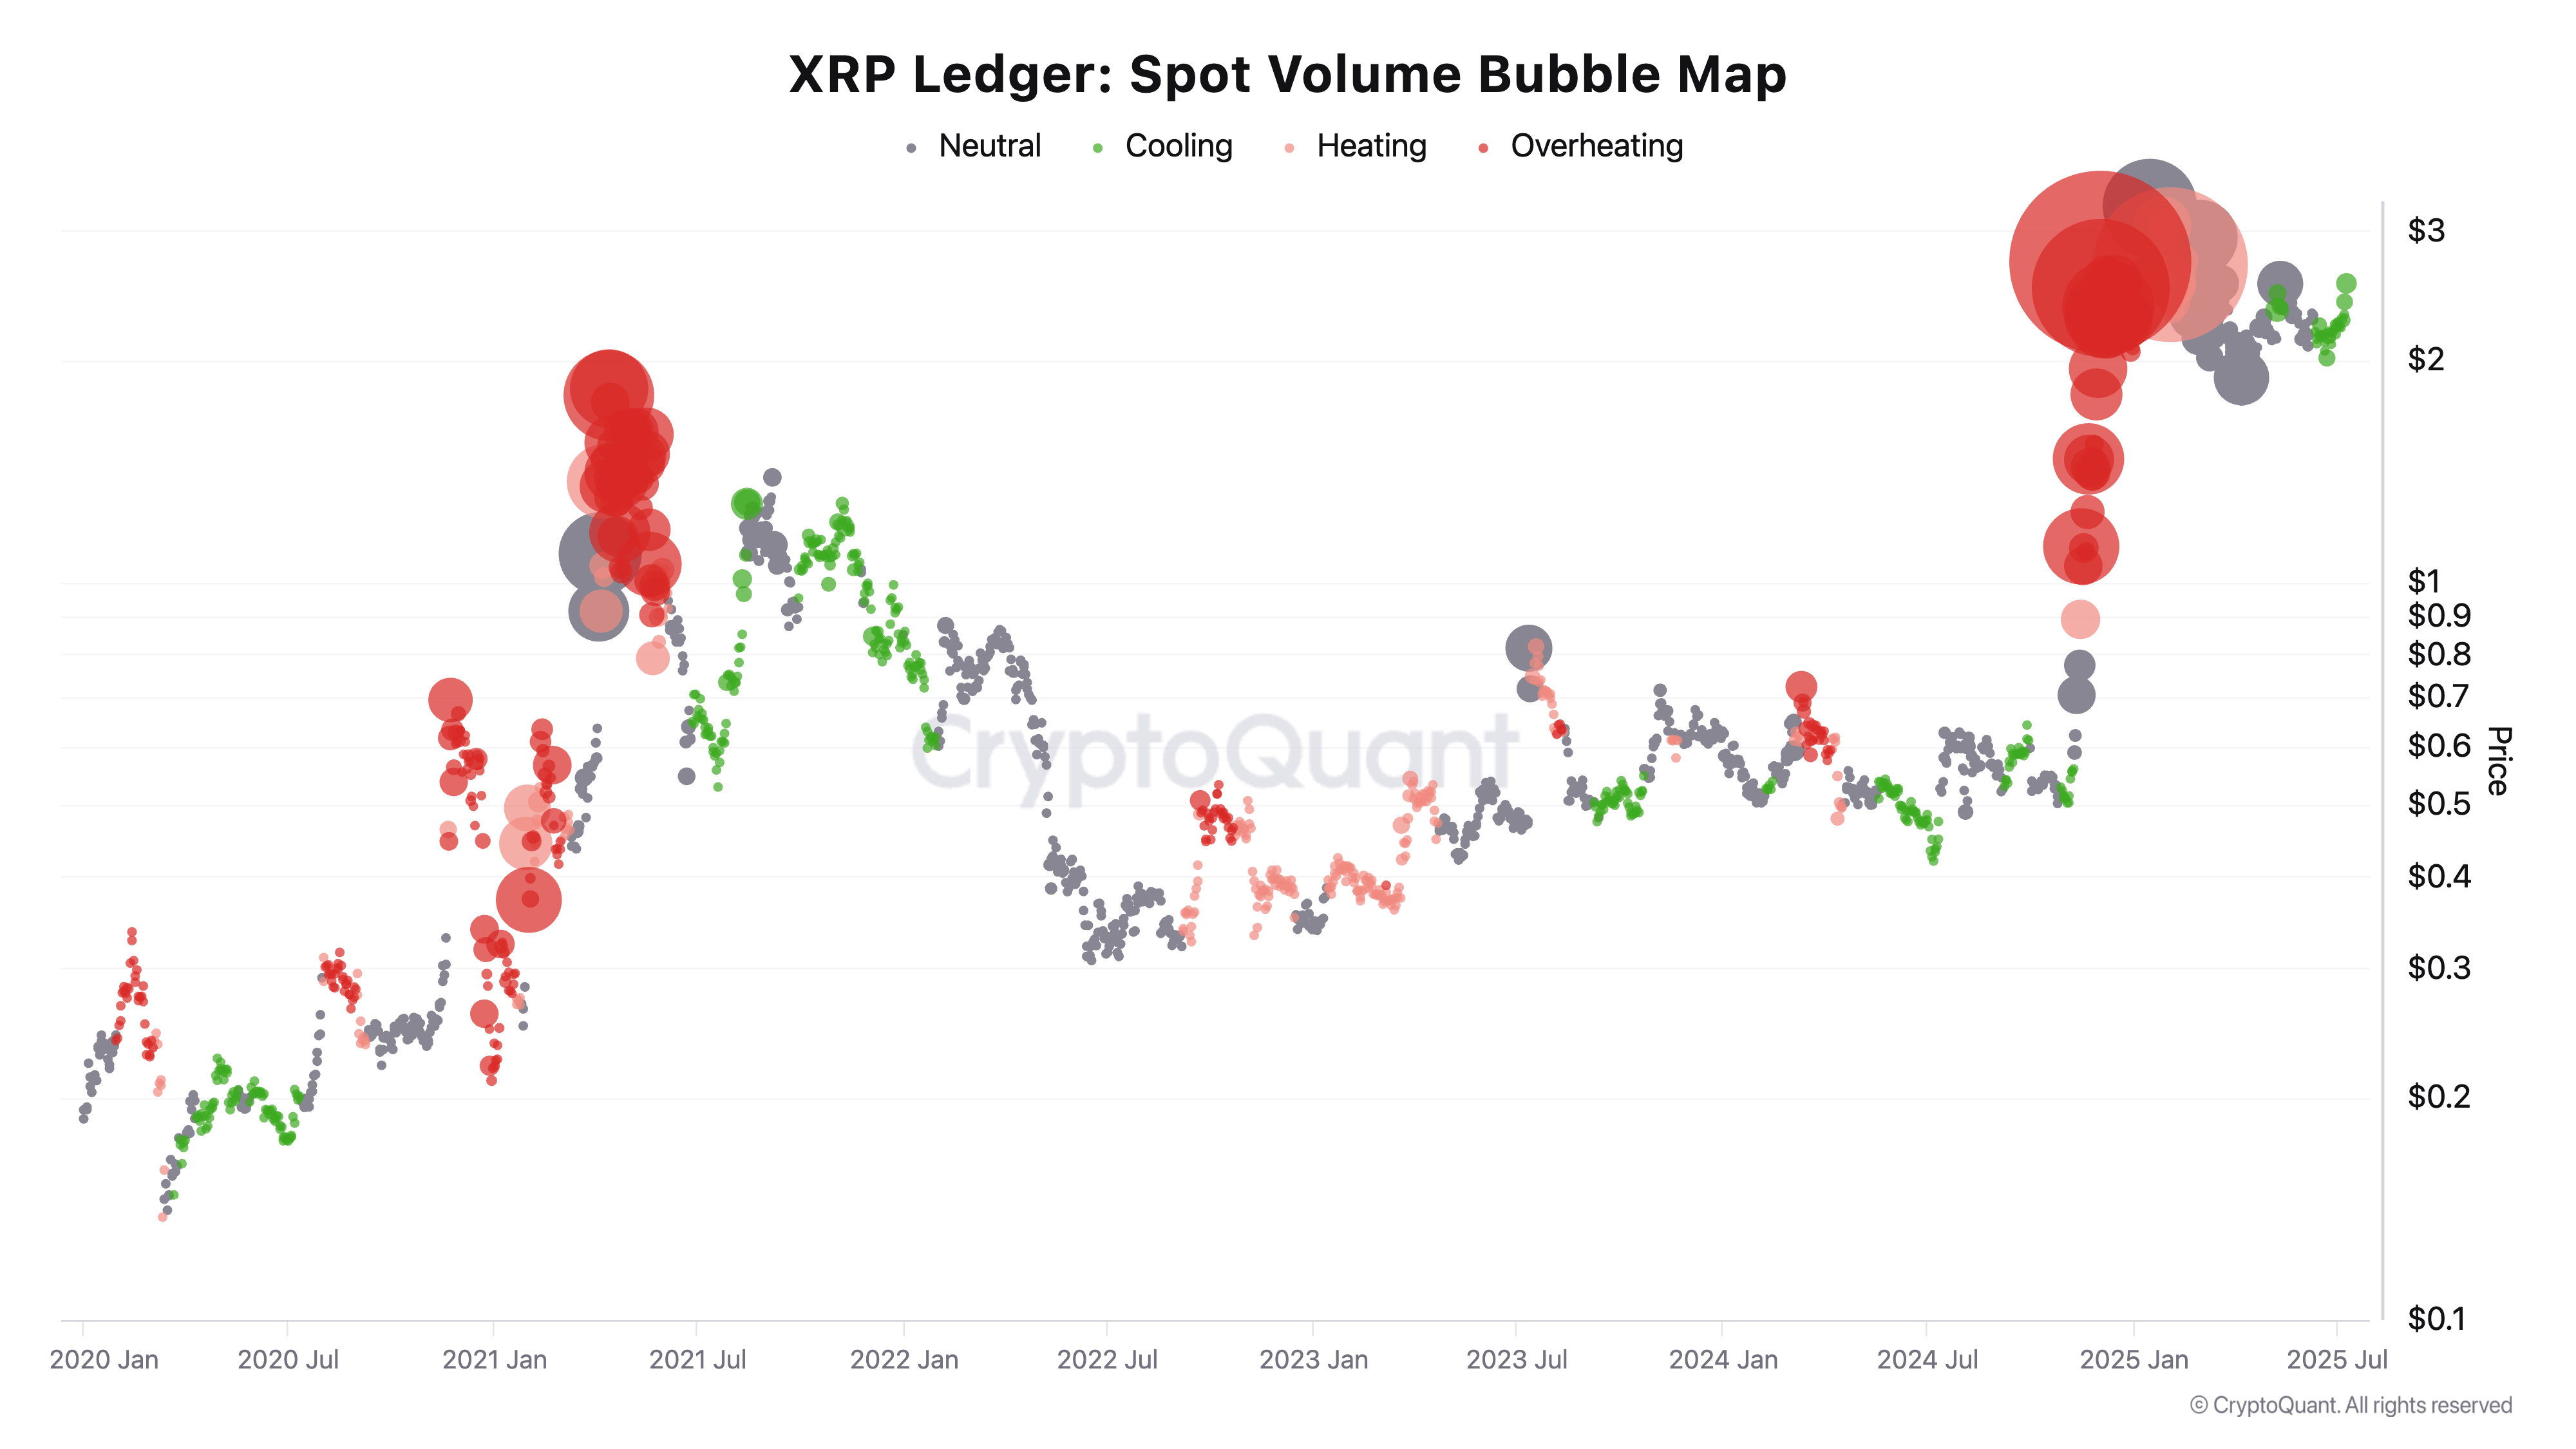
XRP Spot Volume Bubble Map | Source: CryptoQuant’
Concurrently, investors are increasing their transactions involving exchanges, with Glassnode’s Total Exchange Balance metric showing a 2.9% rise to 3.5 billion XRP since June 23.
An increase in exchange balances typically suggests potential selling pressure as holders prepare to sell or trade their XRP. If supply outstrips demand, this could lead to a price decrease or a period of price consolidation.
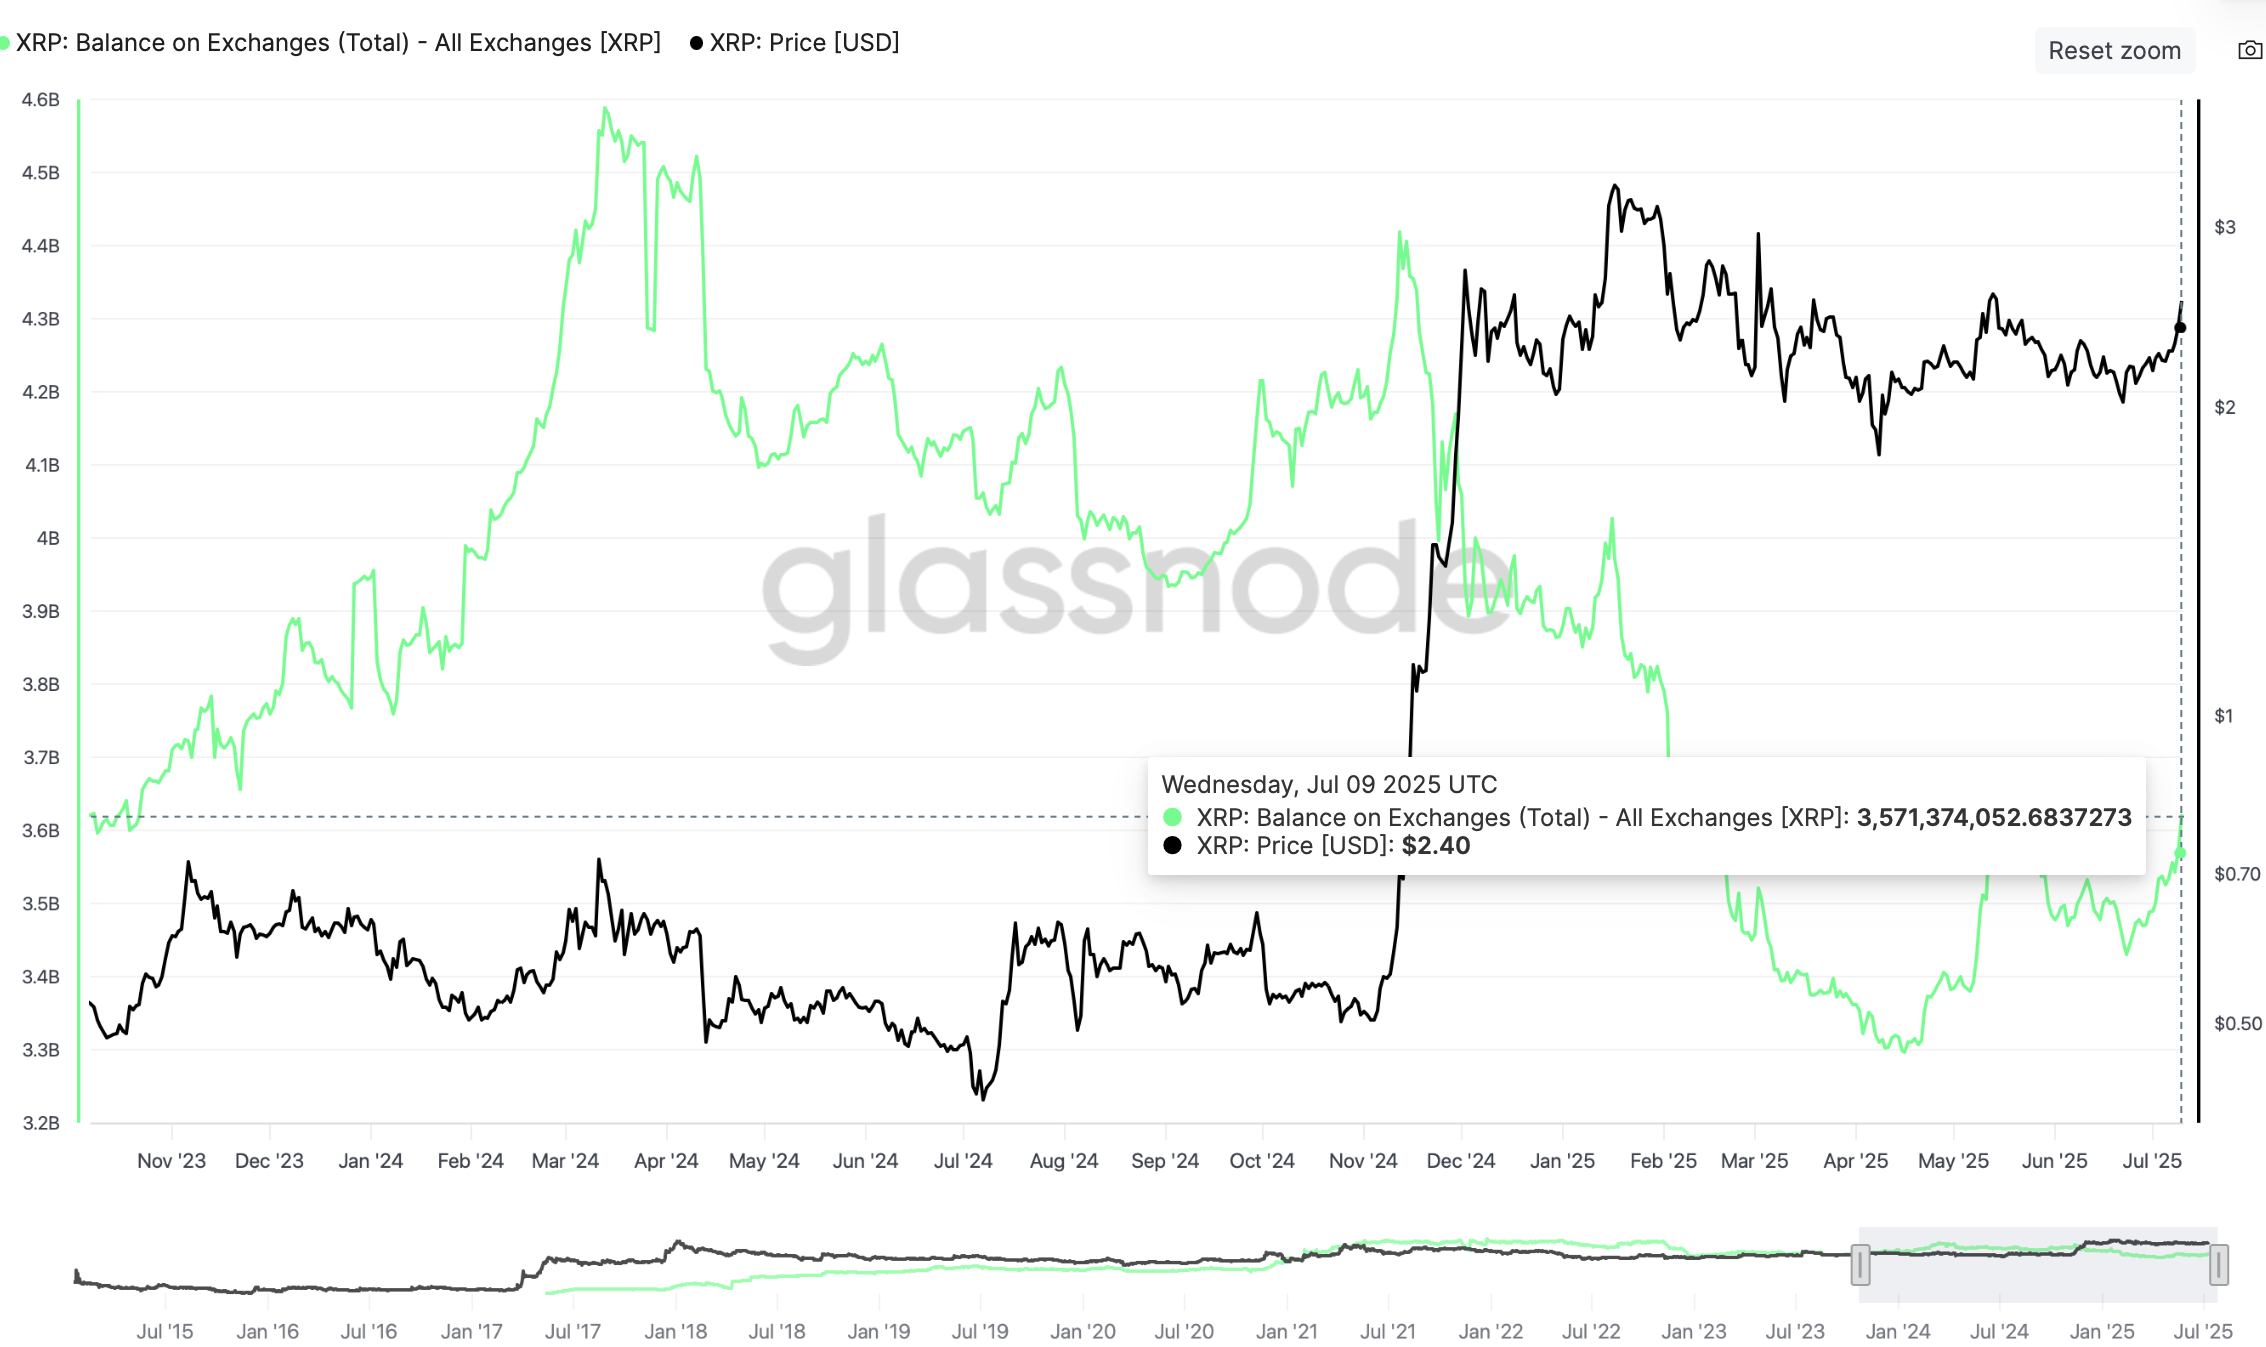
XRP Total Exchange Balance metric | Source: Glassnode
Furthermore, an expanding total supply that generates a profit exposes XRP to downward pressure, as holders are more inclined to sell and realize those profits. The green line on the provided chart illustrates the supply currently in profit, standing at approximately 57.6 billion XRP.
A similar uptrend in May saw the supply in profit nearing 62 billion XRP, but it was followed by a sell-off, which limited price movement to $2.65 and precipitated a decline to $1.90 in June.
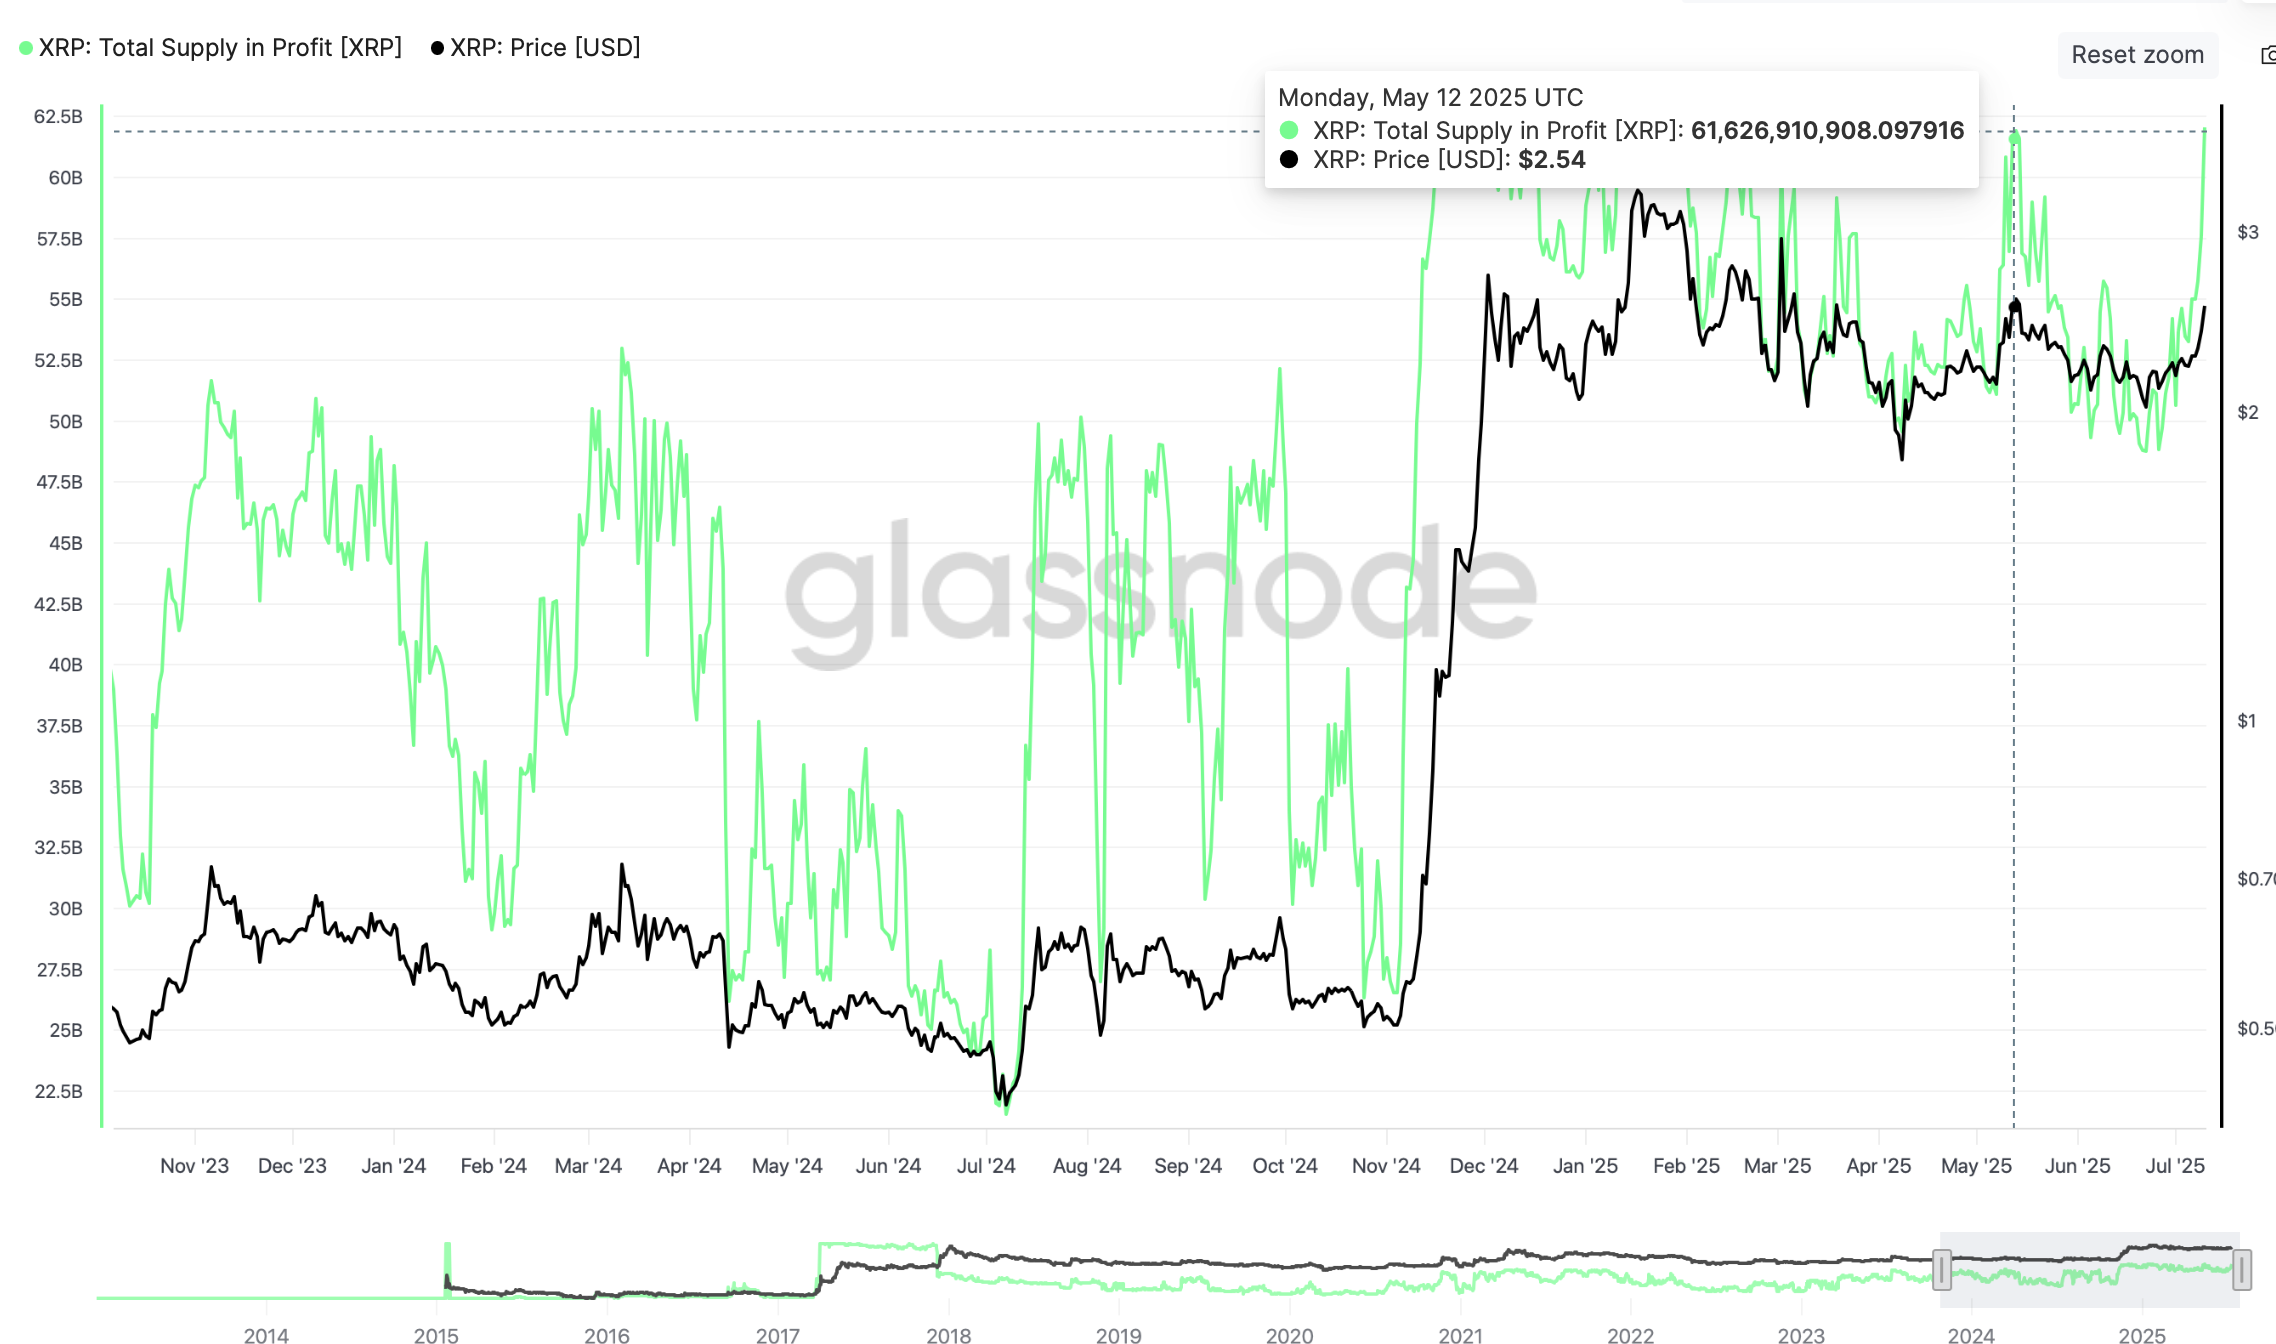
XRP Total Supply in Profit metric | Glassnode
Technical Analysis: XRP Completes Breakout of Pattern
XRP’s recent price surge has surpassed $2.76, achieving a target anticipated from an inverse Head-and-Shoulders (H&S) pattern, which was confirmed on Wednesday when buyers broke above the neckline resistance at $2.33.
The cryptocurrency, utilized for international money transfers, is presently trading at $2.80, supported by an increasing trading volume of $165 million. Likewise, the Money Flow Index (MFI), which gauges the amount of capital flowing into or out of XRP, reinforces this positive assessment, remaining at 89.
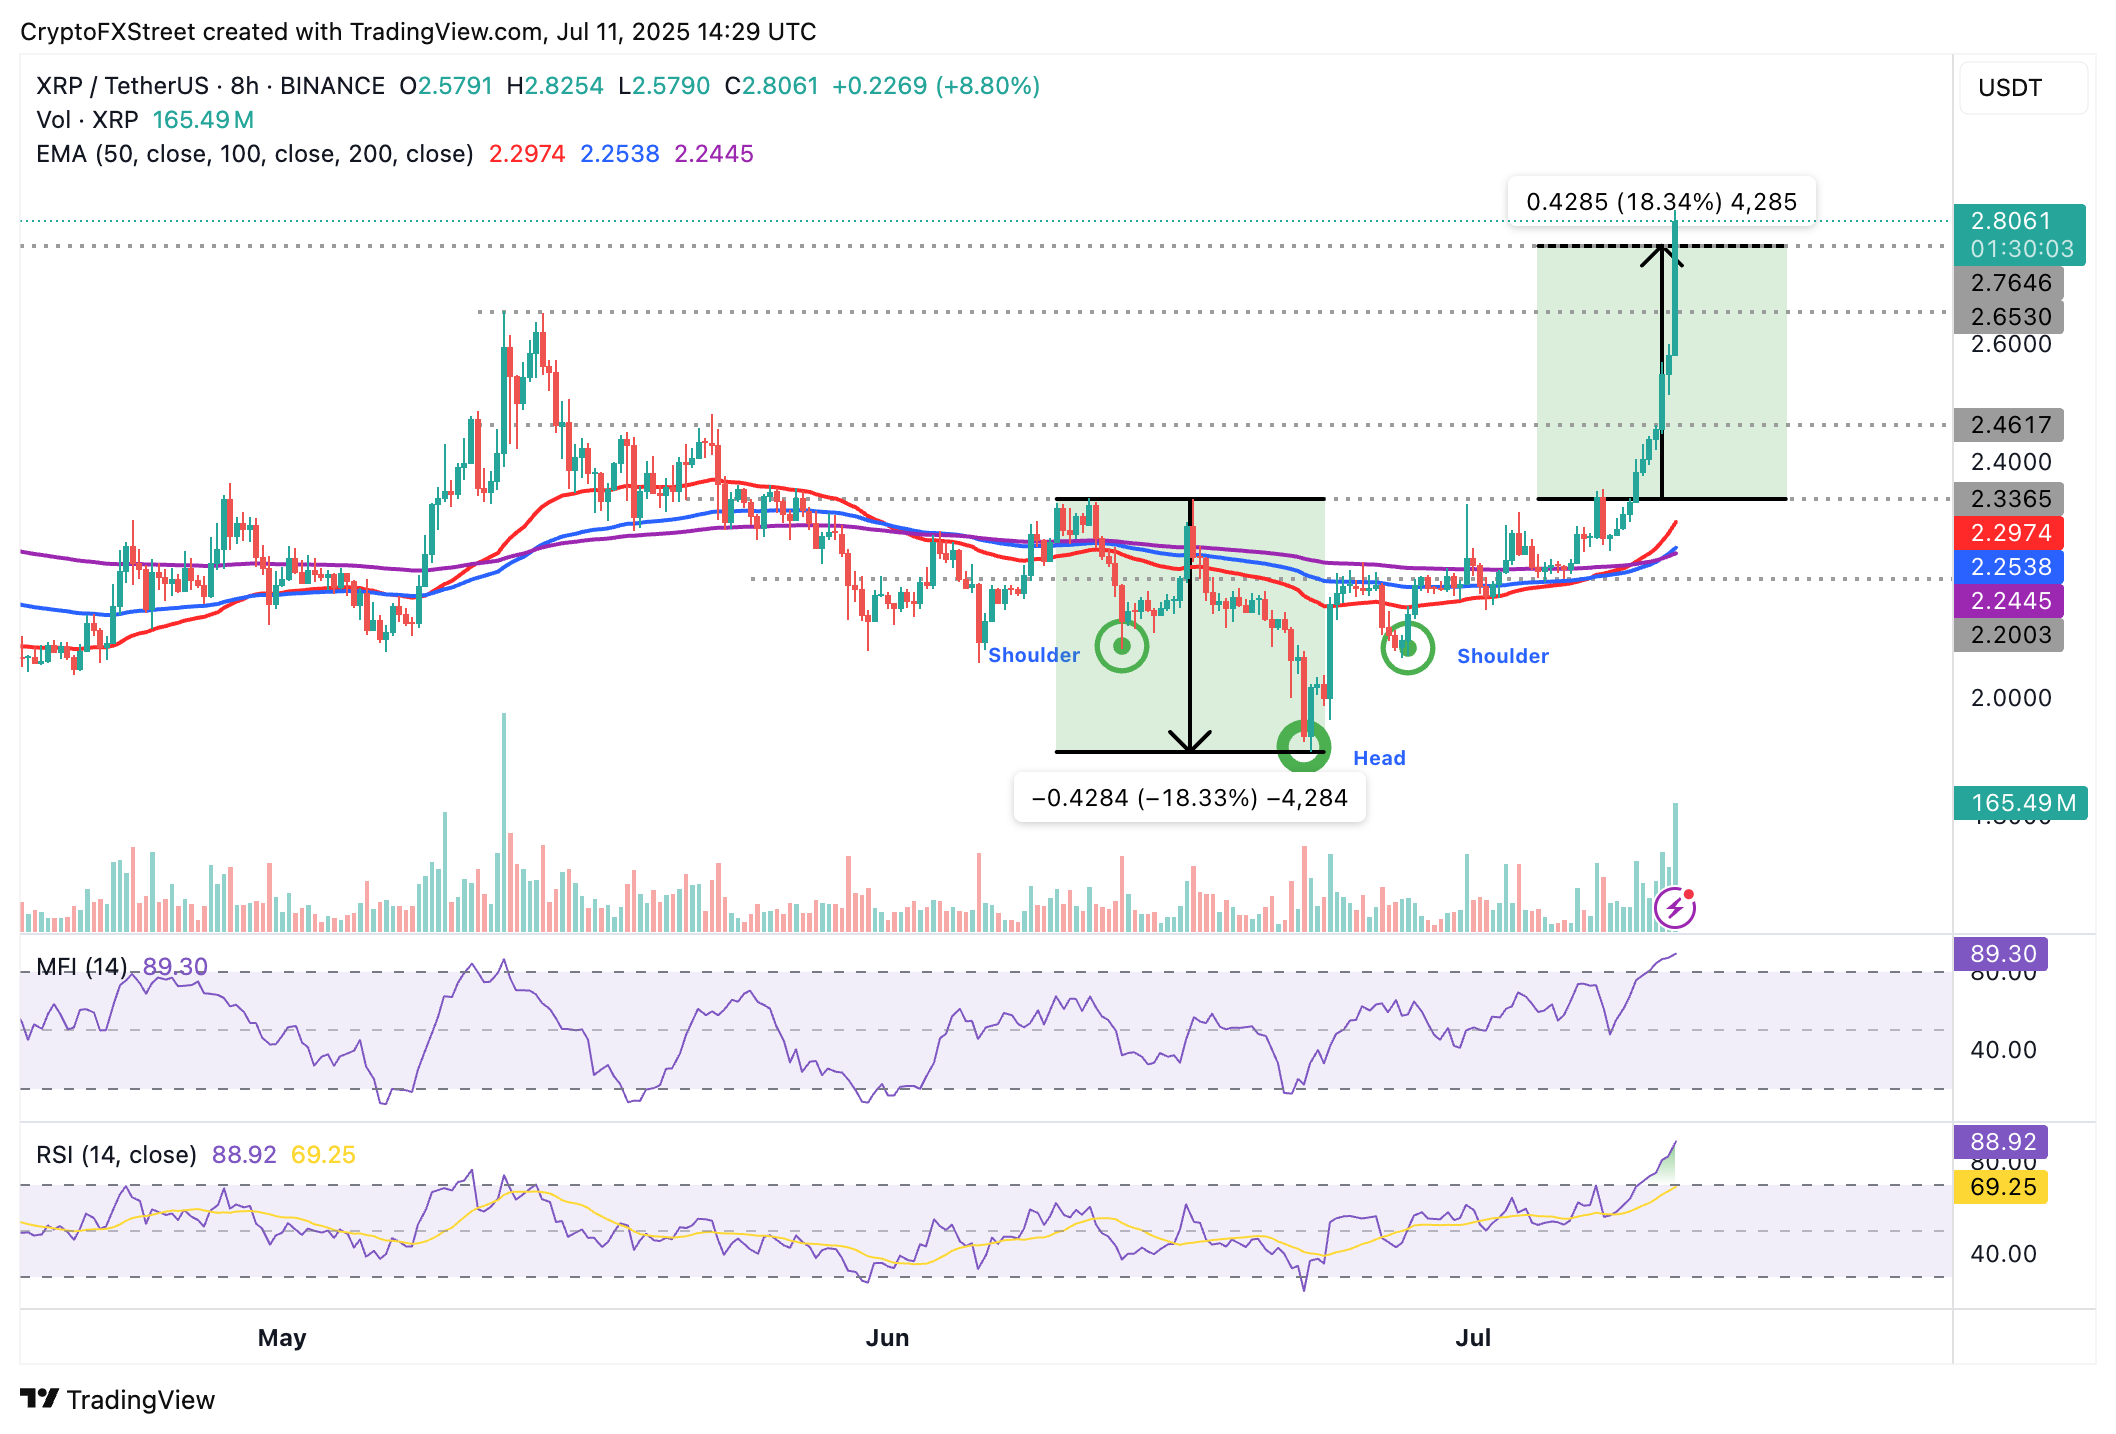
XRP/USDT daily chart
However, the Relative Strength Index (RSI) indicates an overbought condition at 88, suggesting a potential cooling-off period before the rally continues towards $3.00. Consequently, caution is advised, and preparations for a possible change in trend should be made. Profit-taking activities and risks highlighted by blockchain data will likely be the primary drivers of any pullback.