

Bitcoin’s price is exhibiting renewed fluctuations after its successful climb back into the $115,000+ territory. This recovery demonstrates the resilience of buyers who are displaying strength following a period of market sell-offs and heightened concerns about a more significant price drop. While a degree of caution remains, market confidence is slowly rebuilding as Bitcoin purchasers regain lost ground.
You Might Also Like
Data from CryptoQuant indicates that the “Bitcoin price change since the last difficulty bottom” is currently at +7.4%, positioning it within a positive range. This indicator is a useful gauge for assessing the well-being of Bitcoin miners and the stability of the cryptocurrency market. Historically, times of genuine miner capitulation – when struggling miners are forced to sell off their holdings – tend to occur when this metric dips into negative territory, between -10% and -30%, generally following several reductions in mining difficulty. These forced sales often worsen market downturns.
Currently, Bitcoin’s position above the zero mark on this indicator suggests that the market has moved past a period of significant pressure on miners. This reduces the likelihood of forced selling by mining entities, creating a more stable environment for Bitcoin’s price. The current reading reflects a moderately positive, but not overly enthusiastic market environment, and suggests BTC could establish a firmer base for its next move upwards.
Bitcoin Mining Sector’s Health Provides a Stable Market Foundation
Leading analyst Axel Adler recently shared insights indicating that the Bitcoin mining sector remains in a steady state. According to Adler’s analysis, Bitcoin’s current price is above the most recent difficulty adjustment level, implying there is no widespread selling of Bitcoin from miners happening. This absence of miner capitulation removes selling pressure that can intensify market declines.
The current +7.4% value on the “% BTC price change since last difficulty bottom” indicator indicates that a modest uptrend is present. Adler emphasizes that while the indicator shows positive signs, the market is nowhere near the extremely bullish conditions that occur at market peaks where readings have been seen as high as +50% to +80%.
Going forward, Adler suggests that investors monitor the following key areas:
The next difficulty adjustment during price drops: Watch for a decline here as this could suggest that weaker miners are struggling.
Hashprice/revenue per TH/s: Following miner profitability will confirm whether the sector faces stress.
Miner reserves: Keep an eye on miner holdings; a rise in selling during low-price periods would indicate growing pressure.
Adler concludes that the miner factor is neither pulling the market down nor acting as a strong bullish catalyst. Instead, it’s currently providing a steady, supportive foundation – if Bitcoin’s price does not sharply break the previous difficulty bottom with double-digit gains or falls below it. The price of Bitcoin will depend more on the strength of buyers and larger economic factors instead of miners.
You Might Also Like
Bitcoin Price Technical Analysis: Testing Key Resistance
Bitcoin’s 4-hour price chart reveals an attempt to maintain gains after moving back above the $115,724 support level. After a notable rebound from its recent lows, Bitcoin has moved above its 50-day (blue), 100-day (green), and 200-day (red) moving averages, which is an early signal of a momentum shift in the near-term.
BTC is currently around $116,585, with the nearest resistance around $116,600-$116,700 where the 100-day SMA resides. Breaking through this barrier could lead to a climb towards the $118,000-$118,500 zone, with the next major resistance at $122,077, the previous top of the range.
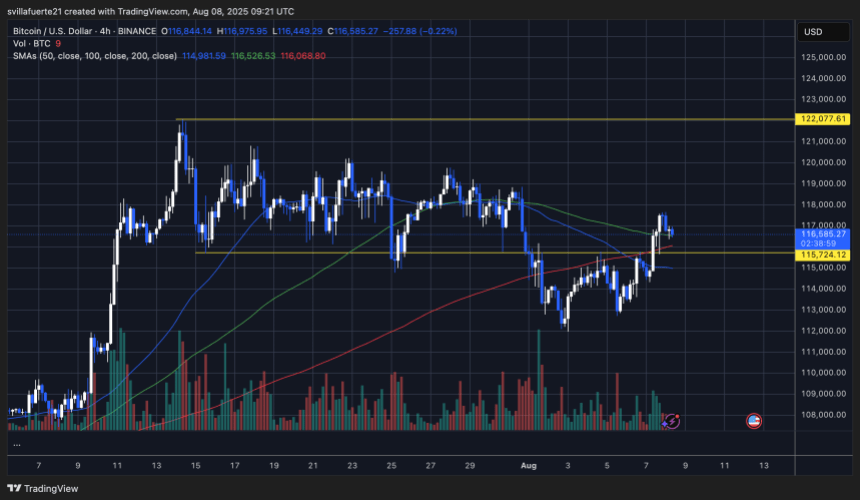
The $115,724 mark is still a key support point. If Bitcoin cannot stay above this, a pullback toward $114,000 could occur, with additional support around $112,500. The trading volume during the recovery has been on the lower side, so stronger buying may be needed to keep the momentum going.
You Might Also Like
While the recent movement above multiple SMAs offers a hopeful near-term perspective, Bitcoin continues to trade within the broader boundaries established in July. Until Bitcoin decisively surpasses $118K, the market will be in a consolidation phase and remains at risk of turning downward if buying activity weakens. Staying above the $115.7K support level will be essential for buyers hoping to push to higher resistance levels soon.
Image generated by Dall-E, chart courtesy of TradingView