

- Heightened Tariff Concerns Send Bitcoin Tumbling Below $106,000 Support Threshold.
- Bitcoin Spot ETF Investment Trend Reverses, Experiencing Outflows After a Ten-Day Streak of Positive Activity.
- Current Bitcoin Bull Run Demonstrates Remarkably Lower Volatility Compared to Previous Cycles, Averaging Approximately 50%.
- Ethereum Maintains Position Above $2,600 Short-Term Support Level, While XRP Signals Potential Sell-Offs.
The cryptocurrency market is navigating increasingly choppy waters this Friday, primarily due to widespread uncertainty surrounding potential tariff adjustments in the United States. Bitcoin (BTC) is experiencing further declines, slipping below the $106,000 mark, as major alternative cryptocurrencies, including Ethereum (ETH) and Ripple (XRP), are currently testing crucial support boundaries.
Market Overview: Macroeconomic Pressures Intensify as US Tariff Policies Shift
The cryptocurrency trading landscape saw significant downward pressure Friday after a federal appeals court temporarily suspended a prior ruling that had invalidated President Trump’s tariffs on Wednesday, following a request from the Justice Department.
The prior decision from the Court of International Trade asserted that the U.S. Constitution exclusively grants Congress the authority to regulate international trade and that the President’s power to implement emergency measures for economic protection cannot supersede this congressional mandate.
However, citing The Washington Post, the Trump administration has denounced the ruling as an instance of “judicial overreach.” As a result, global markets have largely retraced the gains achieved Thursday amid growing anxiety related to the direction of U.S. tariff regulations.
Cryptocurrency market volatility could extend into the weekend, contingent on how investors interpret the upcoming Personal Consumption Expenditures (PCE) Price Index inflation data, scheduled for release later today.
The PCE price index is recognized for its broad coverage of consumer spending and its ability to capture changes in consumer spending patterns. Market observers use the PCE price index data to gauge the likely course of action by the Federal Reserve (Fed), particularly as the potential timeframe for interest rate reductions narrows.
Data Insights: Bitcoin Spot ETFs Experience Net Outflows for the First Time in Ten Days
The surge to a new all-time peak of $111,980 was substantially fueled by positive institutional sentiment, as Bitcoin Exchange Traded Funds (ETFs) saw continuous inflows over a ten-day period, from May 14 to May 28. Accumulation of Bitcoin reserves by institutional entities such as Strategy and Metaplanet also boosted the rally.
However, data from SoSOValue indicates outflows totaling $359 million on Thursday, bringing an end to the ten-day streak of inflows. This shift highlights evolving dynamics within the broader market, especially given the uncertainties surrounding U.S. tariffs and geopolitical tensions in Europe and the Middle East.
Bitcoin spot ETF outflow volume | Source: SoSoValue
Concurrently, the current Bitcoin bull market exhibits markedly lower volatility levels compared to prior cycles. As reported by CoinDesk, using Glassnode data, realized volatility has averaged below 50% on a three-month rolling basis. This represents a considerable decrease from the 80% to 100% range observed during previous upward market trends.
Bitcoin’s relative stability largely results from its expanded market capitalization and the increased institutional interest, supported by the availability of ETFs and derivative products.
“The introduction of US Spot ETF Products, combined with improved regulatory clarity, has reshaped the underlying investor base, allowing sophisticated, institutional investors and substantial capital to access Bitcoin for the first time,” Glassnode noted in a recent analysis.
Daily Chart Analysis: Bitcoin Falls Below Critical Support Levels
As of the writing of this report, Bitcoin’s price is showing substantial declines below $106,000, reflecting growing selling pressure. Key technical metrics, such as the Moving Average Convergence Divergence (MACD), confirm the newly established bearish outlook.
With the MACD indicator trending downward toward the center line (0.00) after signaling a sell indication on May 25, when the blue MACD line moved beneath the red signal line, a greater number of traders are motivated to sell BTC. This has contributed to the most significant sell-off since Bitcoin reached its latest all-time highs on May 22.
The downtrending Relative Strength Index (RSI) from recent overbought conditions, as it approaches the 50 midpoint, reinforces the increasing bearish sentiment in the market. In the near term, key areas of interest include the short-term support at $105,000 and the region around $102,500, which previously acted as support in mid-May and as resistance in early January.
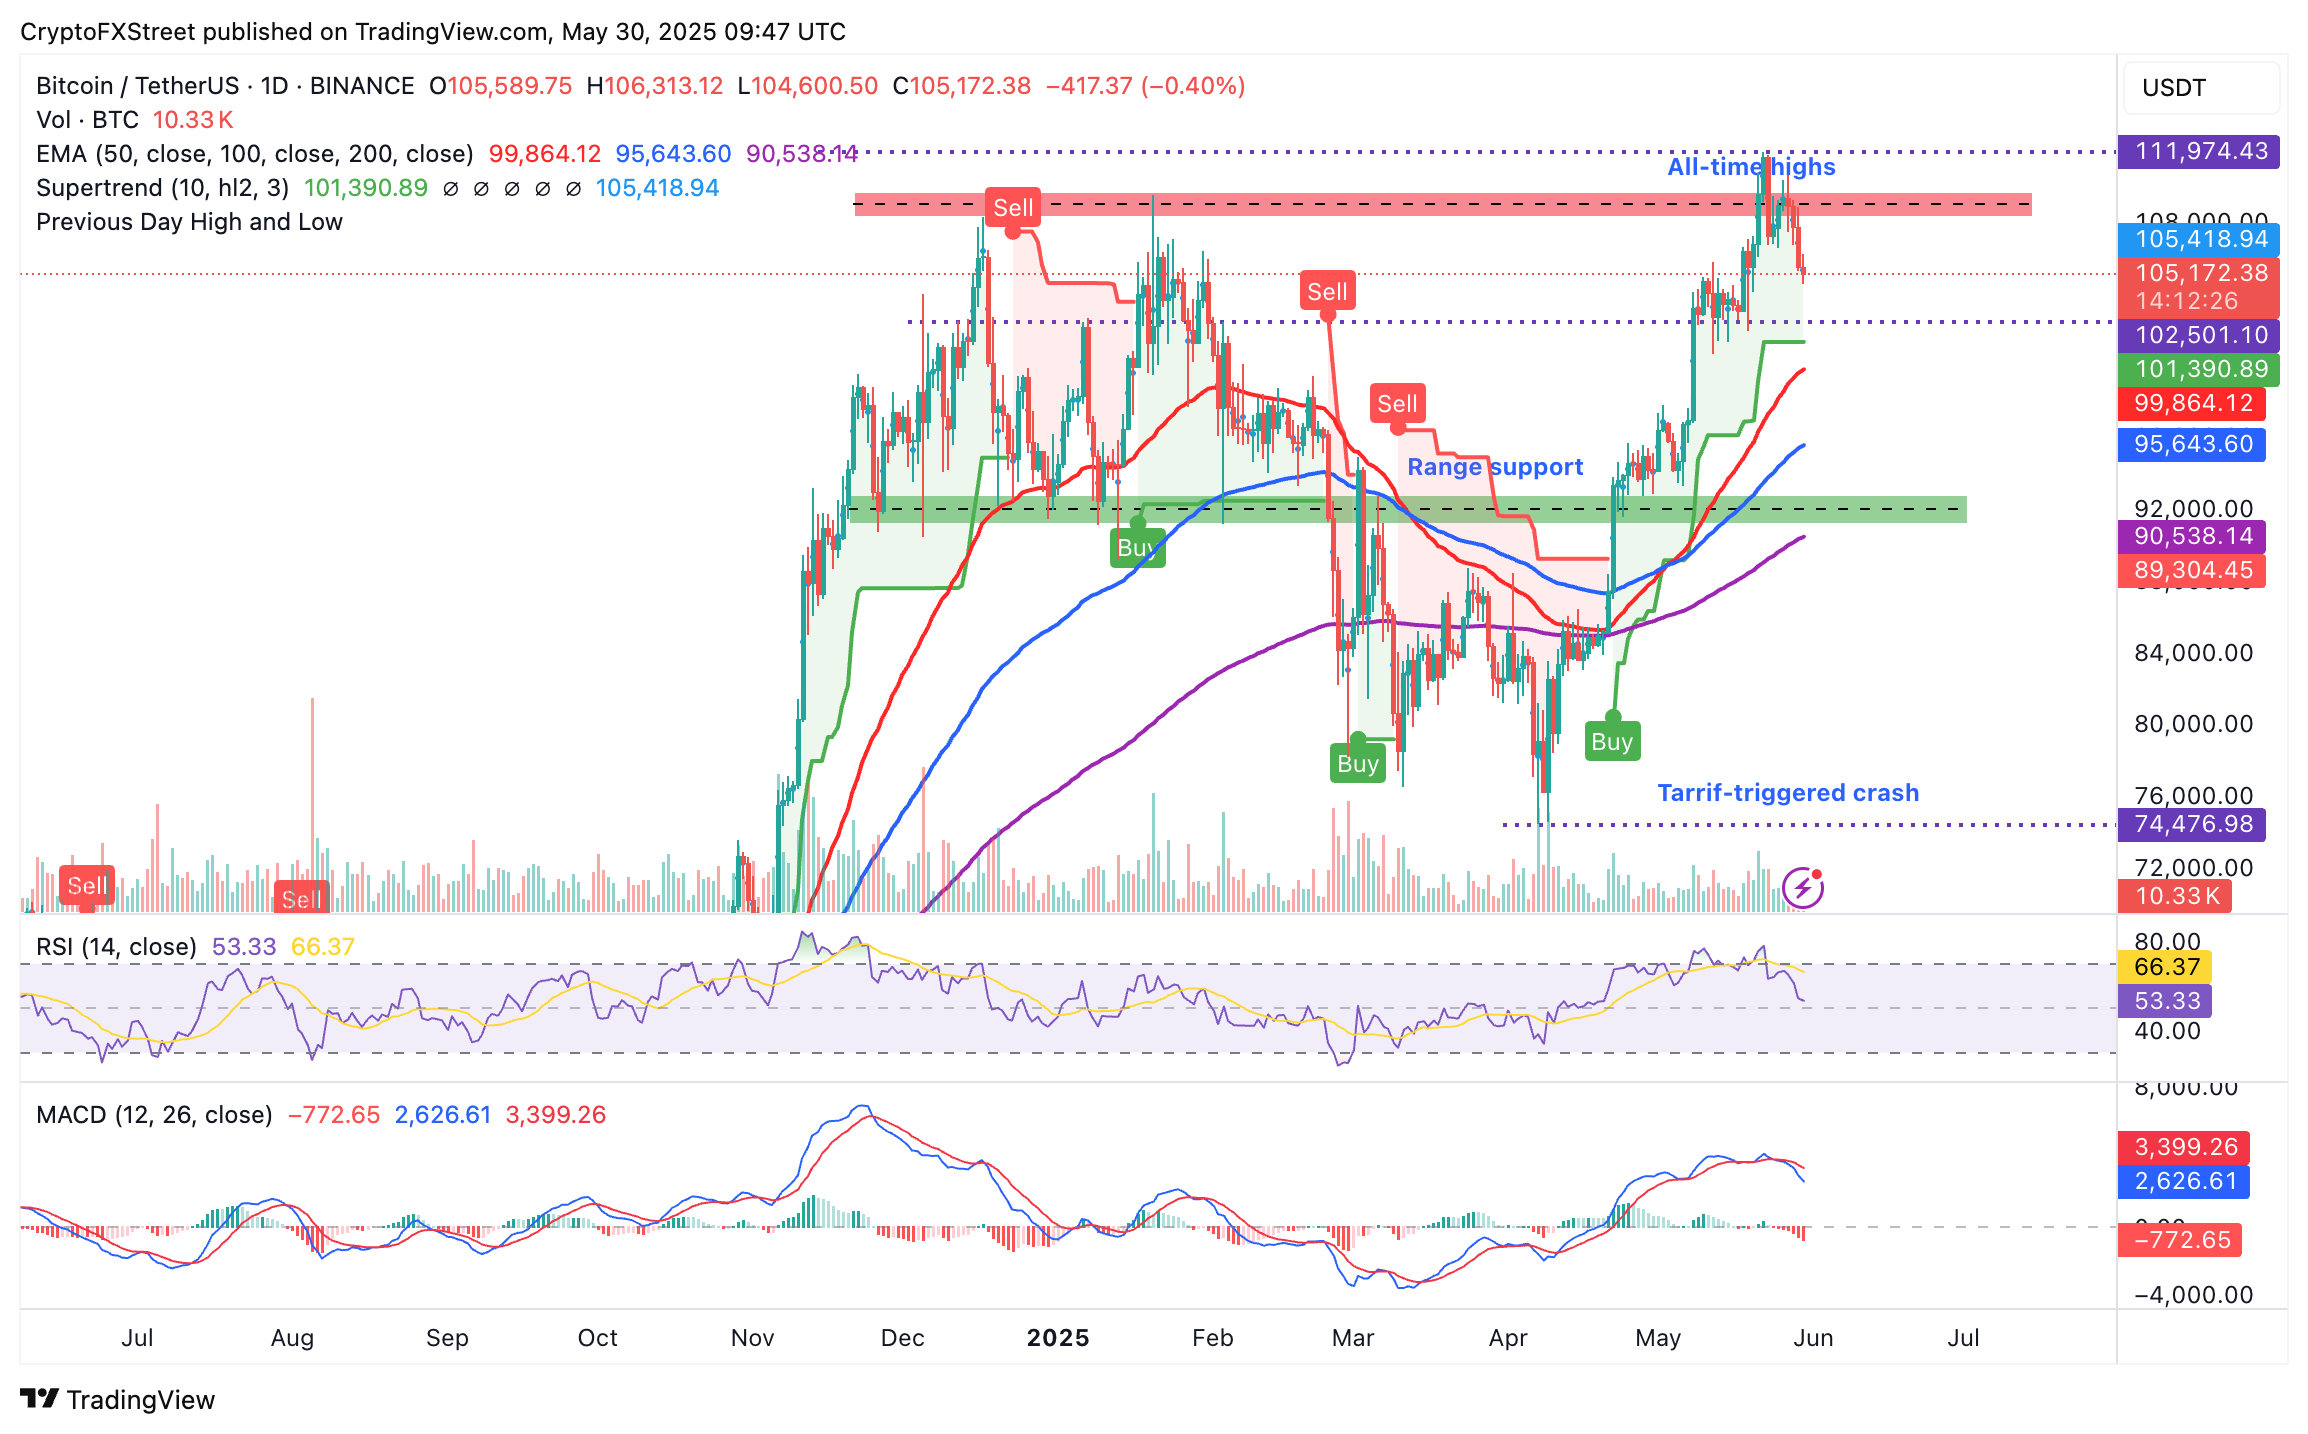
BTC/USDT daily chart
Meanwhile, alternative cryptocurrencies have been impacted by rising selling pressures, potentially undermining the gains achieved throughout May and, by extension, those recovered after the tariff-induced downturn in April. Ethereum is now testing support around $2,600, trading near $2,605 at the time of this writing.
The MACD and RSI indicators are trending downward, as illustrated in the daily chart below. Provided this technical perspective remains unchanged and the MACD indicator nears the zero line (0.00) while sustaining the sell signal initiated on May 22, the predominant price direction is likely to remain downward leading into the weekend. An RSI reading of 62, after falling from overbought territory, indicates diminished bullish momentum. Important levels to monitor include the 200-day Exponential Moving Average (EMA) at $2,445 and the 50-day EMA at $2,277.
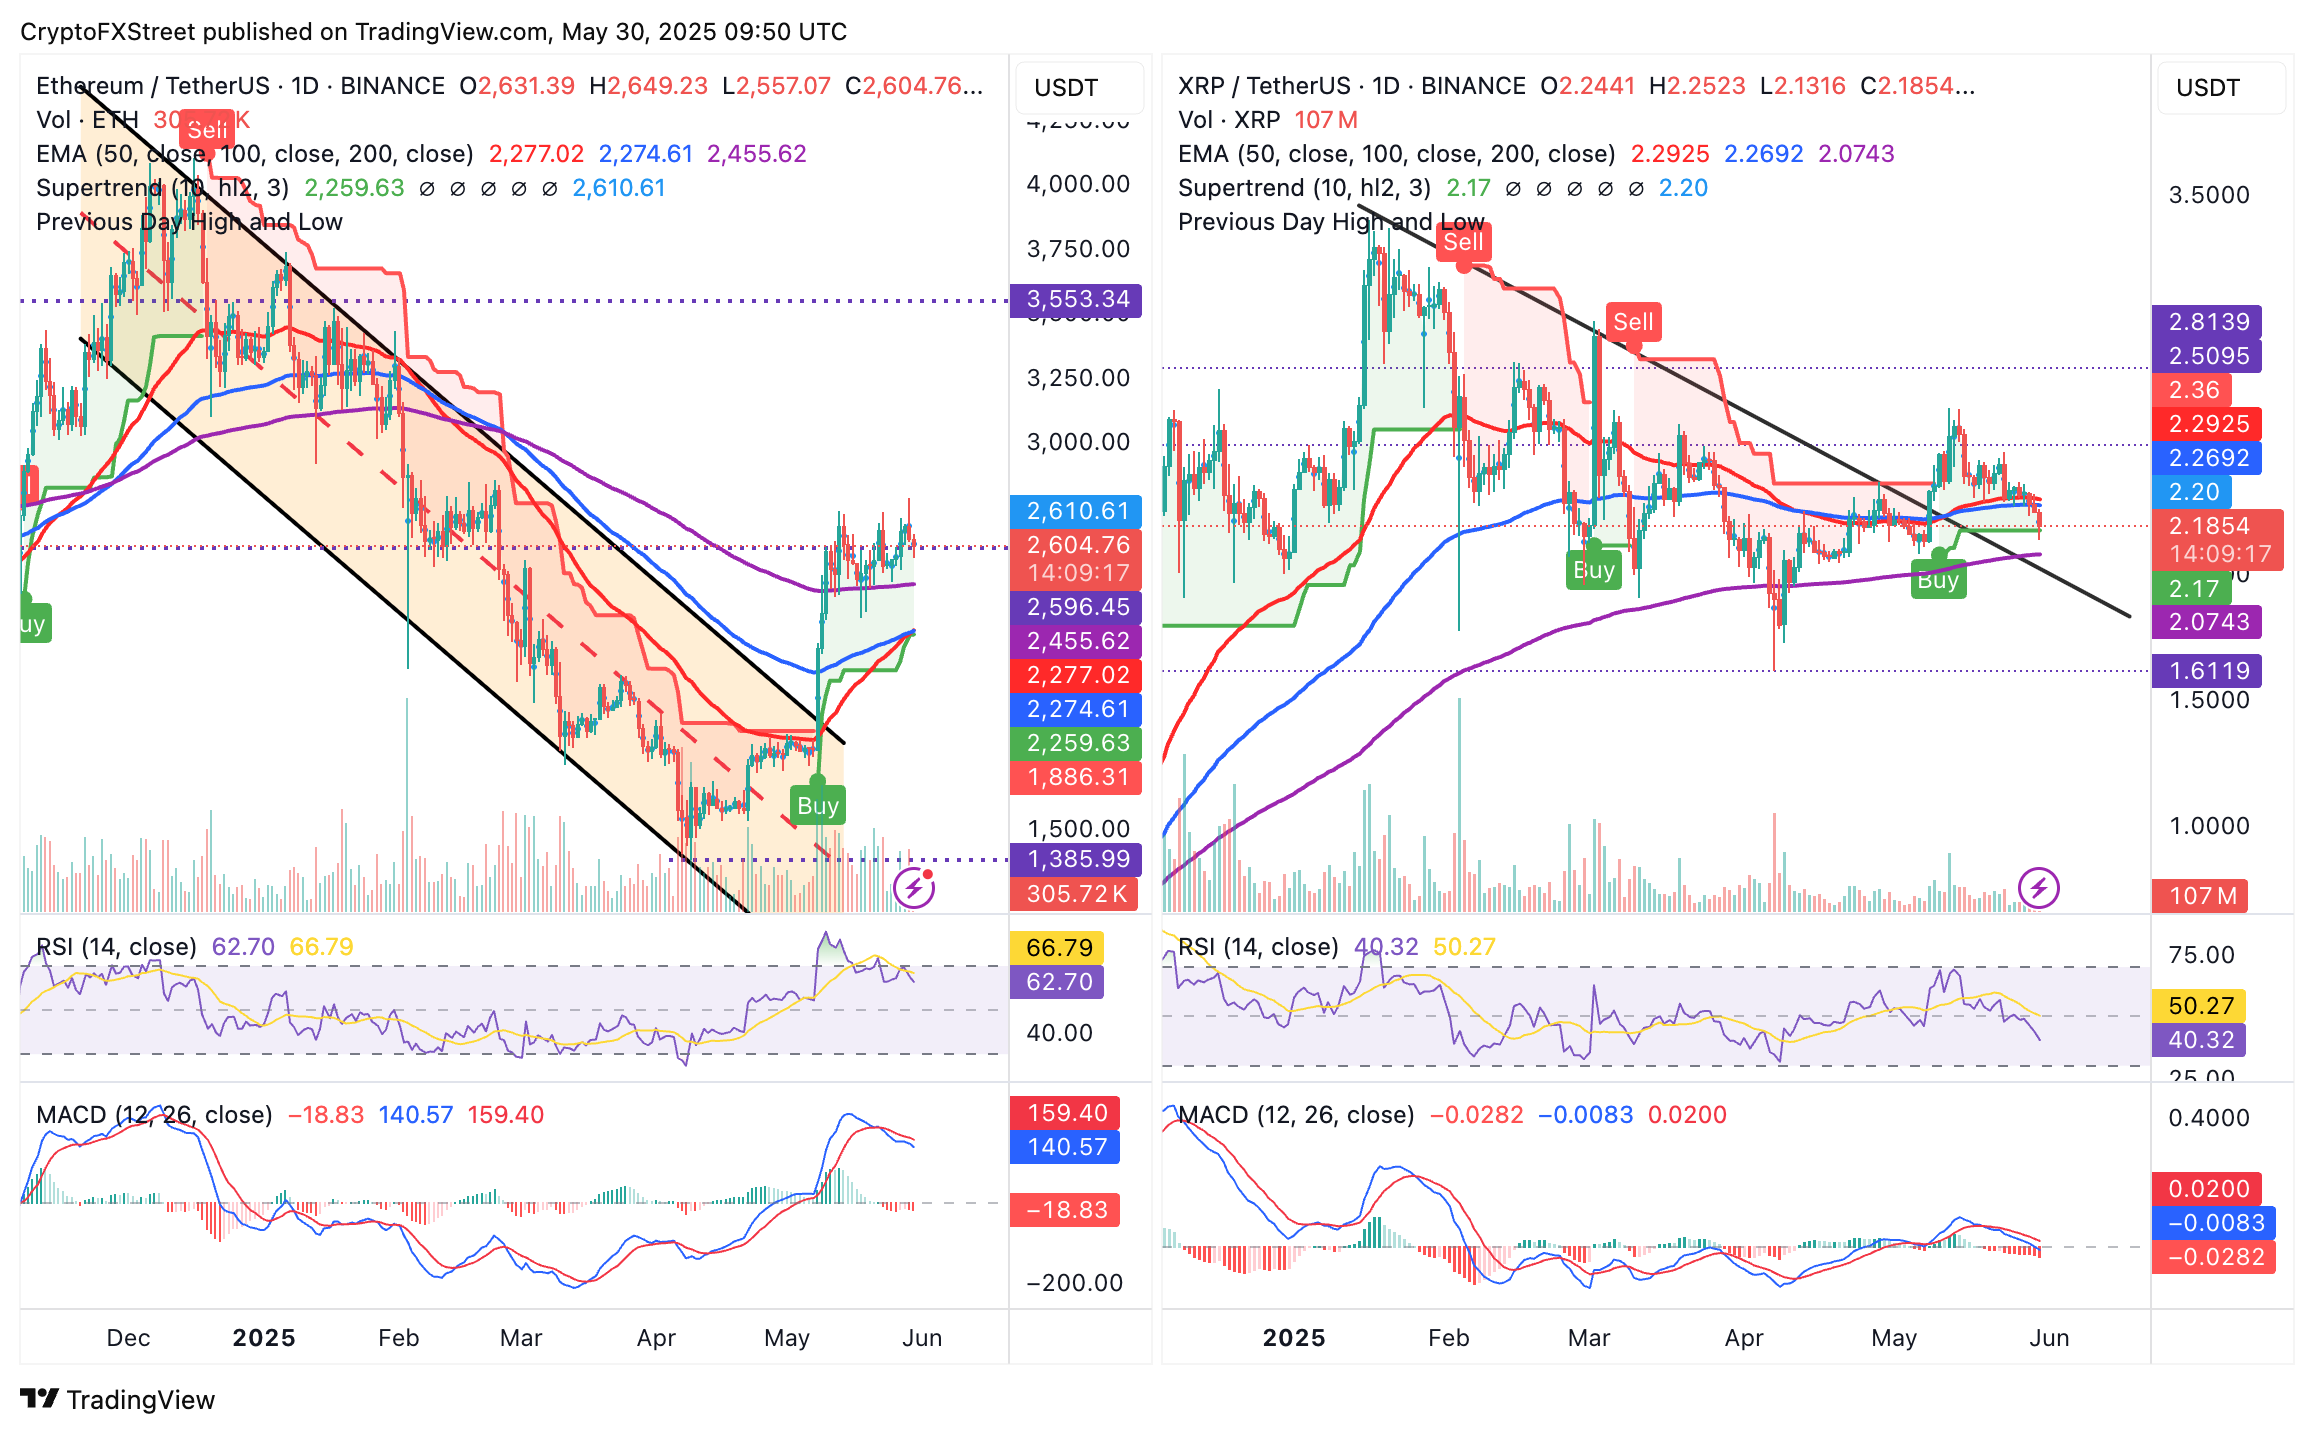
ETH/USDT & XRP/USDT daily charts
XRP has also experienced losses, declining by over 2% today. The cryptocurrency used for cross-border payments is currently trading at $2.19 after breaching two critical support levels: the 50-day EMA, positioned at $2.29, and the 100-day EMA, holding at $2.26.
The next level of interest, particularly for traders targeting buying opportunities on price dips, is the 200-day EMA at $2.07. Should the price fall below this point, declines could accelerate, potentially focusing on the April 7 low at $1.61 and the liquidity-rich zone around $1.00.