

Bitcoin’s price has surged upwards in the past week, making a run towards its former peak value. As of now, the leading cryptocurrency is valued at over $120,000, edging closer to its record high of just above $123,000.
During the last week, Bitcoin’s value has increased by roughly 5.1%, making it one of the top-performing assets in the digital currency landscape.
Insights into current market dynamics are being revealed by on-chain data tracking USDT transfers on the TRON network. CryptoQuant analyst Amr Taha examined the flow of TRC-20 USDT transactions to identify patterns that might foreshadow changes in Bitcoin’s price.
The analysis groups transactions into six different size categories, from smaller retail trades of $100 to massive “super whale” transfers exceeding $10 million, in an attempt to differentiate between typical market activity and trades made by large institutions.
Large USDT Transfers as a Market Signal
Taha’s study indicates that when USDT transactions on the TRON network surpass $5 billion in a single day, particularly those exceeding $10 million, it frequently lines up with substantial profit-taking in Bitcoin.
This behavior usually entails converting BTC into USDT, followed by moving the stablecoins to private digital wallets, which lowers the demand for Bitcoin on the spot market.
For instance, on July 16, USDT transfers of $10M+ hit $5.2 billion, preceding a 4.5% drop in Bitcoin’s value. Similarly, on July 23, $5.8 billion in comparable transfers occurred before a 3.8% decrease within a 48-hour period.
However, current information shows a lack of these large transactions, which indicates that major investors are not currently converting their holdings into stablecoins. This absence of substantial outflows from major holders may suggest that large investors are maintaining their positions instead of exiting the market.
Bitcoin Shifting Market Participation and Potential Breakout Scenarios
A separate analysis by ShayanMarkets at CryptoQuant analyzed the average size of executed orders in Bitcoin futures markets to provide an alternate view of trading trends.
This measure, determined by dividing total trading volume by the number of executed orders, is used to determine whether market activity is being driven by individual investors or larger institutions.
Information from late 2024 and early 2025 shows periods of large investor dominance, which occurred at the same time as strong upward trends. In contrast, recent weeks have been characterized by an increase in smaller orders by individual investors, while trading driven by large investors has decreased.
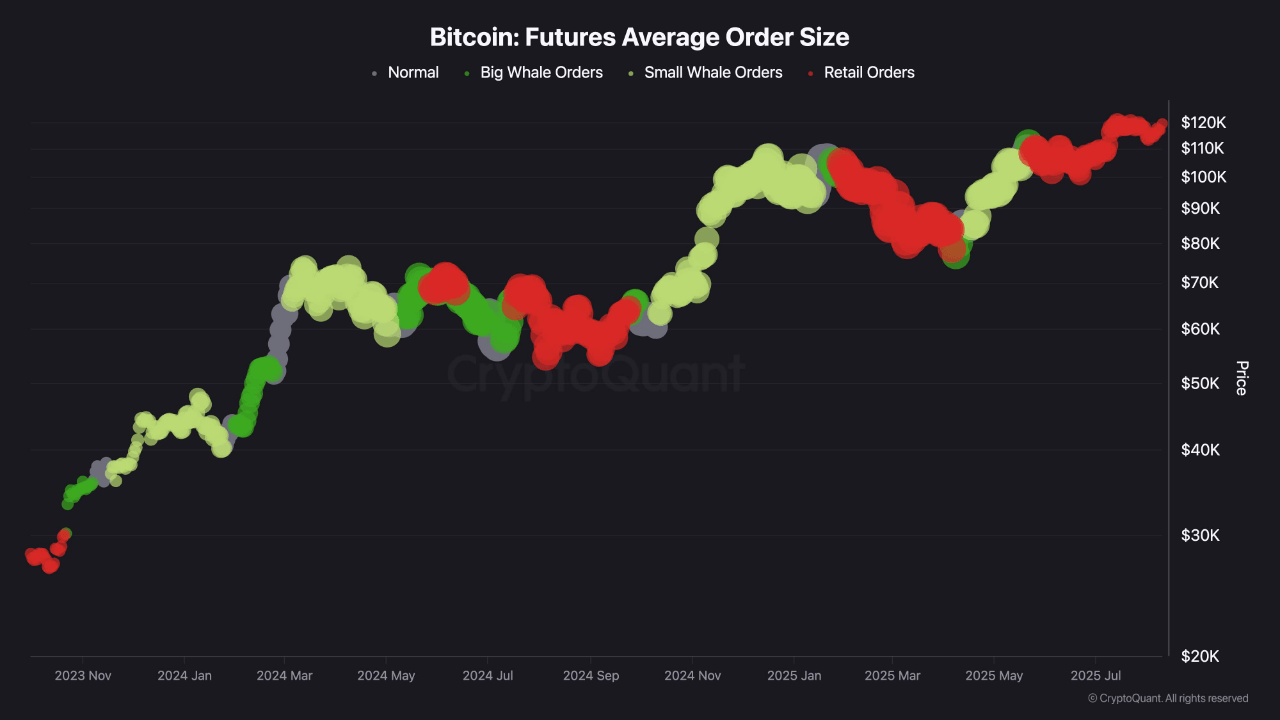
This change suggests that large-scale buyers may be keeping positions they acquired at lower prices, or that they are waiting for changes in market conditions before becoming significantly active again.
Historically, prolonged dominance by large investors near peak prices has been linked to periods of distribution, where major holders realize profits.
The current lack of such activity suggests that a bullish breakout above Bitcoin’s previous all-time high is possible, assuming that renewed selling pressure from large investors does not appear in the near future.
Featured image created with DALL-E, Chart from TradingView
Disclaimer: This content is for informational purposes only. Past performance does not guarantee future results.