

Key Market Indicators
Bitcoin’s market is currently facing increased risk due to exceptionally high leverage. While actions from major holders and miners might offer some stability, the potential for wild price swings and significant liquidations remains a primary concern.
Bitcoin’s (BTC) Estimated Leverage Ratio (ELR), when viewed over a 30-day period, has surged to levels not seen in over half a decade. This metric has surpassed a threshold of +0.4, a level historically associated with increased market instability.
This rapid increase reflects a greater use of leveraged positions in futures trading as Bitcoin traded around $119,669 at the time of this report.
Historically, comparable increases have regularly paved the way for intense market fluctuations and swift liquidations.
Present conditions suggest a market susceptible to abrupt changes, with traders taking on more risk despite Bitcoin’s price remaining near record highs.
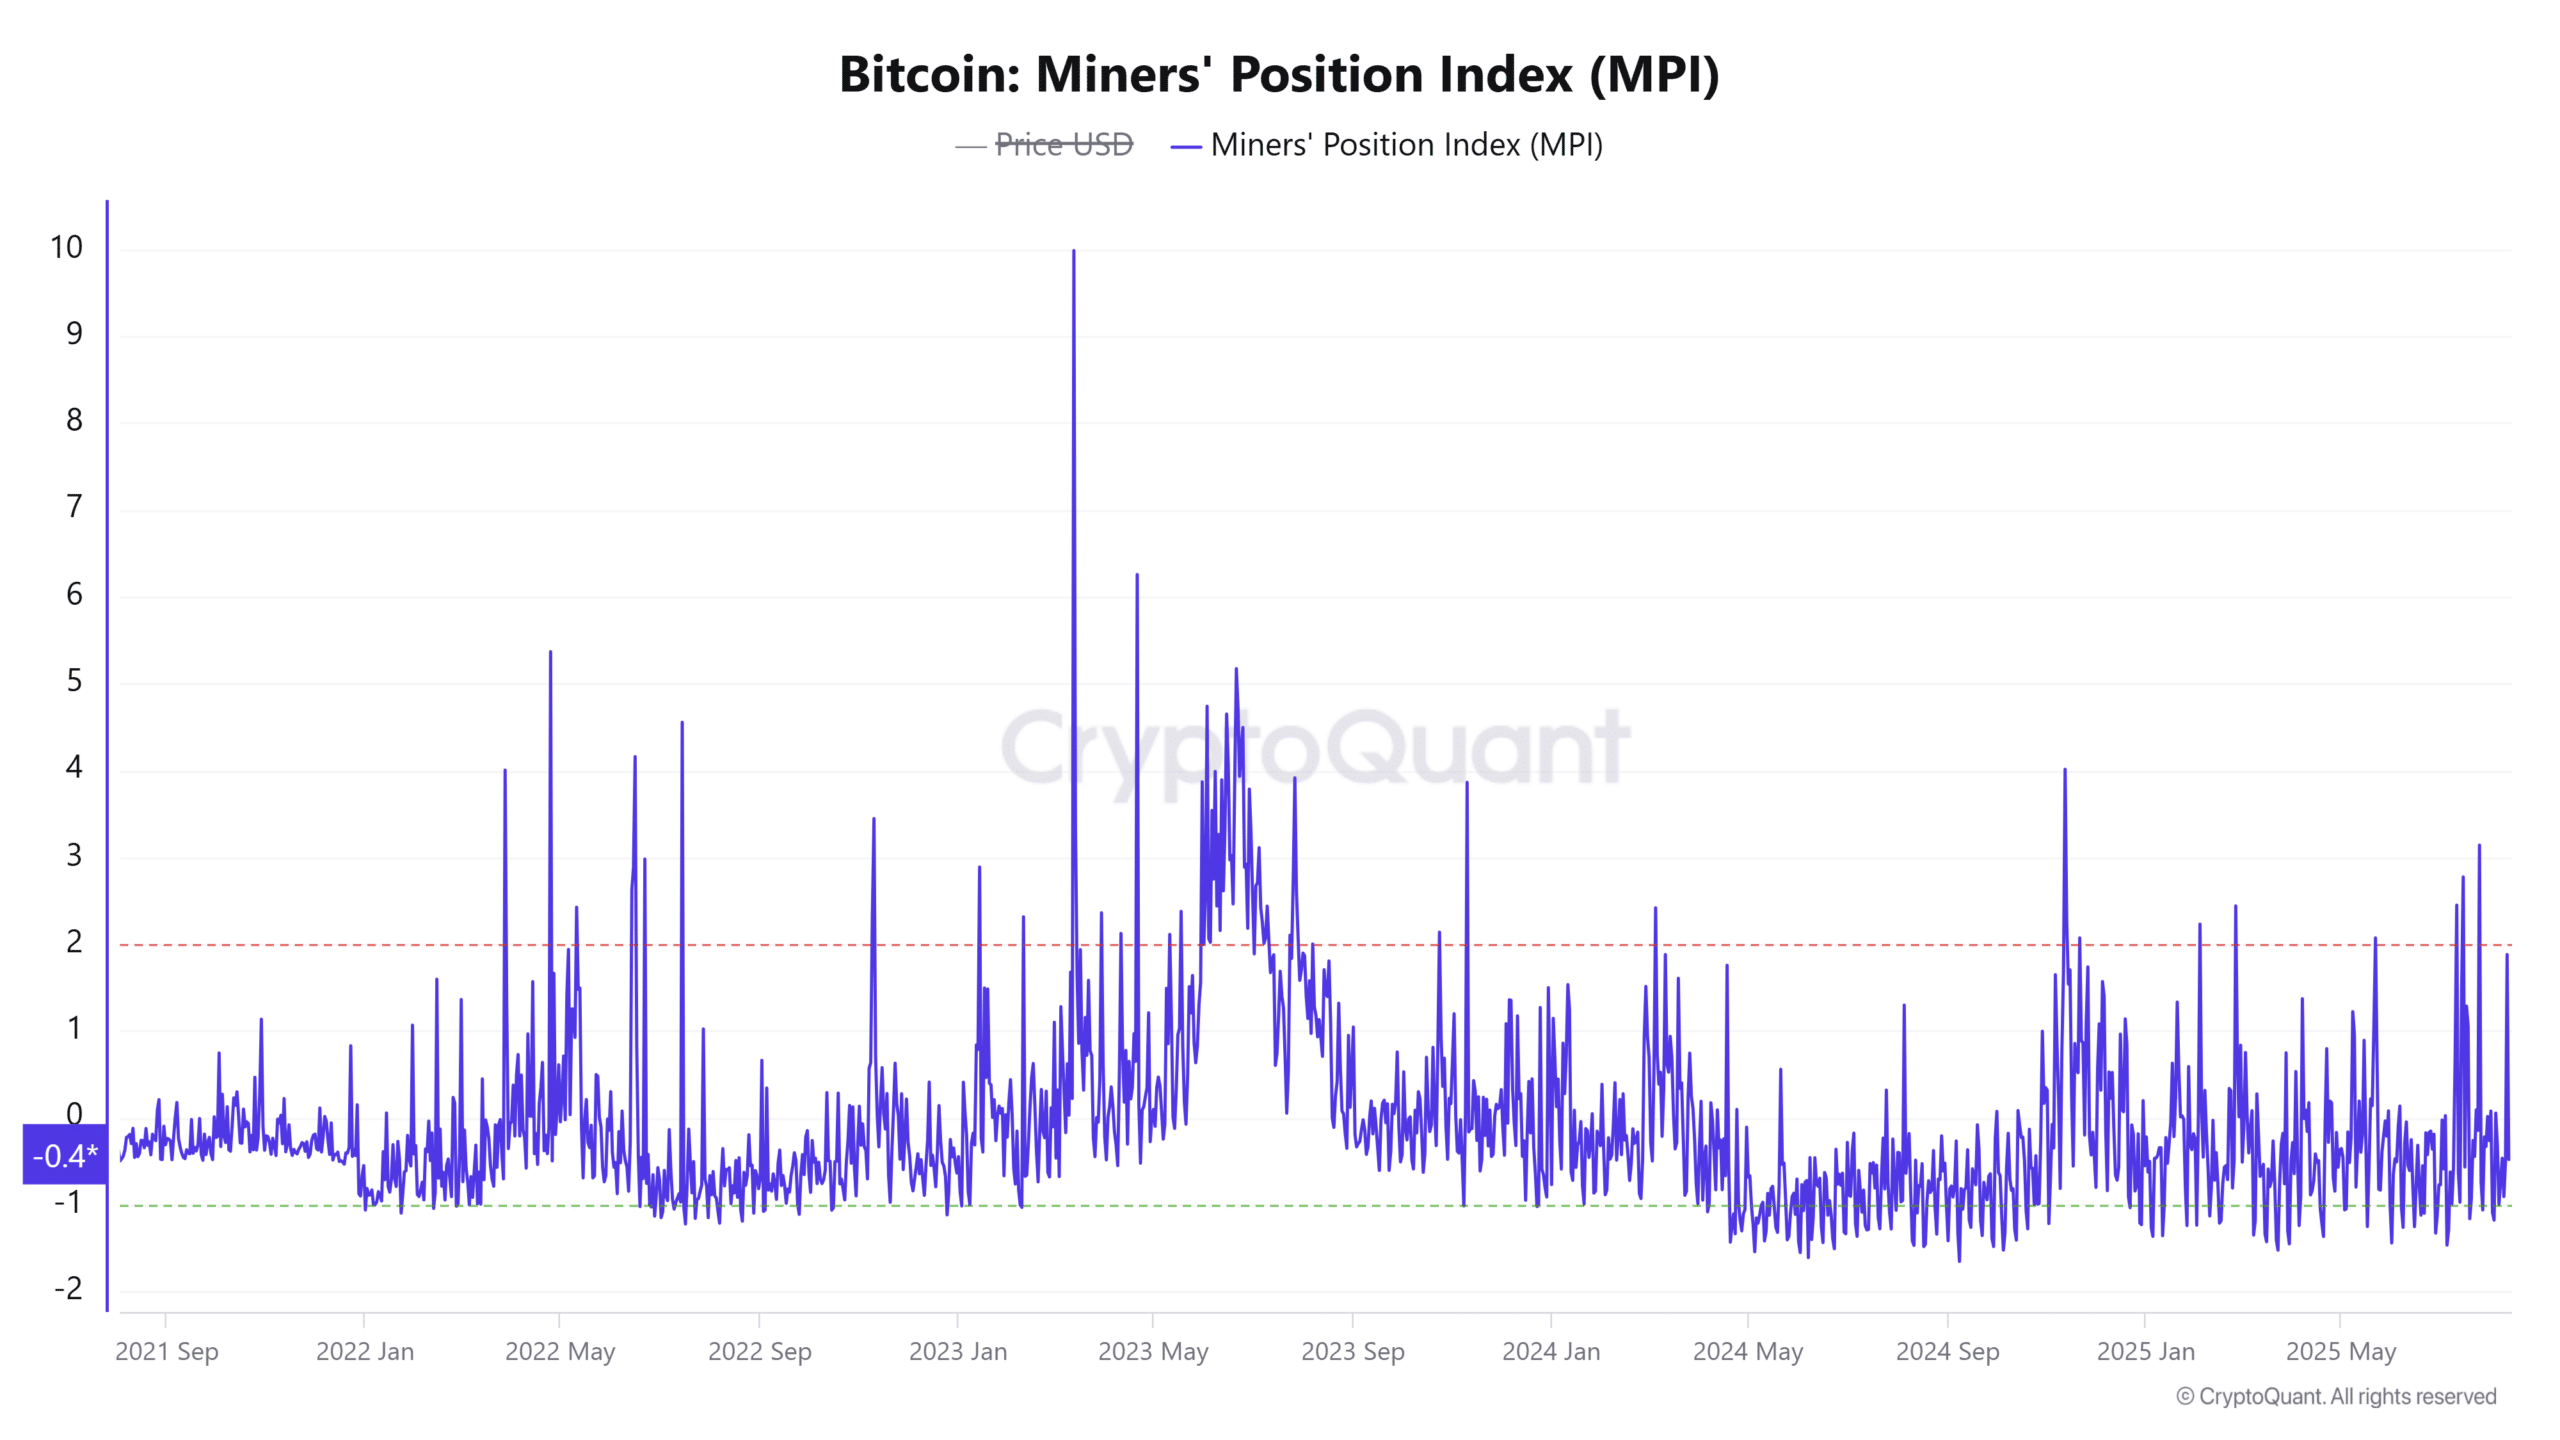
Are Bitcoin Miners Reducing Sales?
The Miners’ Position Index (MPI) has declined to -0.48, indicating a considerable 118% decrease in selling activity within a 24-hour period. This suggests that miners are reducing their sales, which may alleviate pressure on Bitcoin’s value.
Historically, decreased miner outflows have, at times, contributed to more stable prices during uncertain market climates.
However, the market’s current high-leverage environment necessitates that this potentially stabilizing factor be considered with caution.
Whale Activity: Is It Driving Bitcoin’s Rise?
Data reveals a significant surge in Large Holders’ Netflow, up by 234.40% over the past week, indicating substantial accumulation by large holders or “whales.” Such influxes frequently signal growing confidence among key market participants, potentially leading to short-term price increases.
Nevertheless, this trend should be viewed with caution. Current inflows follow a phase of inconsistent buying and selling by these large holders.
The possibility of profit-taking could quickly reverse these gains, particularly given the existing elevated levels of leverage within the market.
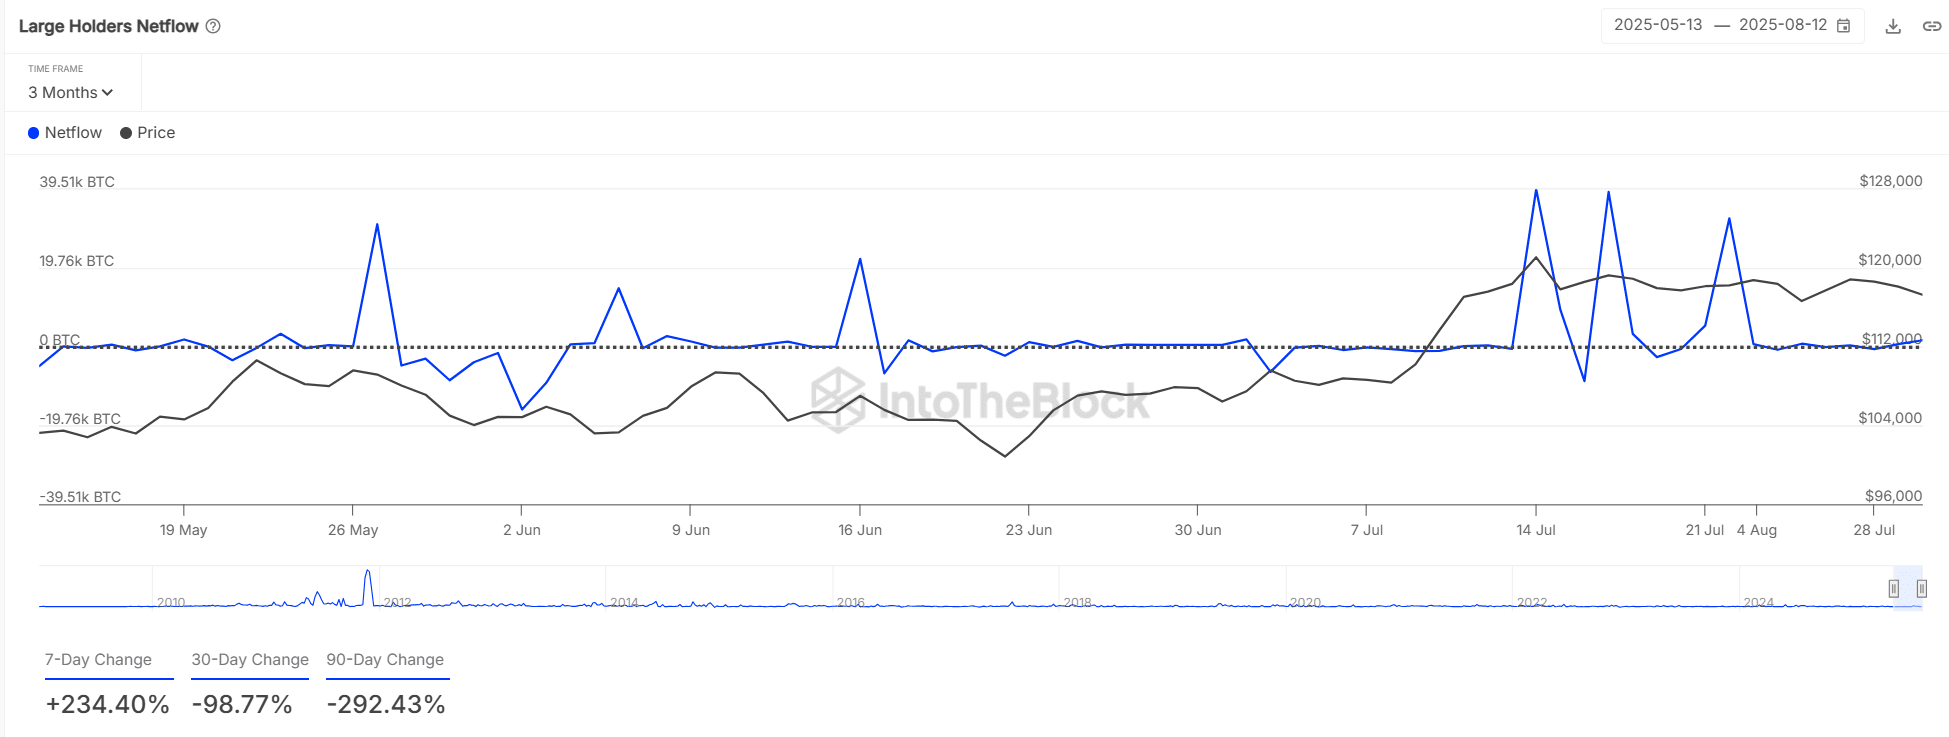
Source: IntoTheBlock
Trader Sentiment: A Bearish Lean?
Currently, the Long/Short Ratio indicates that short positions account for 51.82% of the market, while long positions represent 48.18%, offering a slight advantage to those betting against Bitcoin.
This almost equal division reflects the current market uncertainty. However, the slightly higher number of short positions suggests that traders anticipate a potential downward correction, particularly given the increasing liquidation risks.
A notable price movement in either direction could disrupt this delicate balance, potentially initiating widespread liquidations.
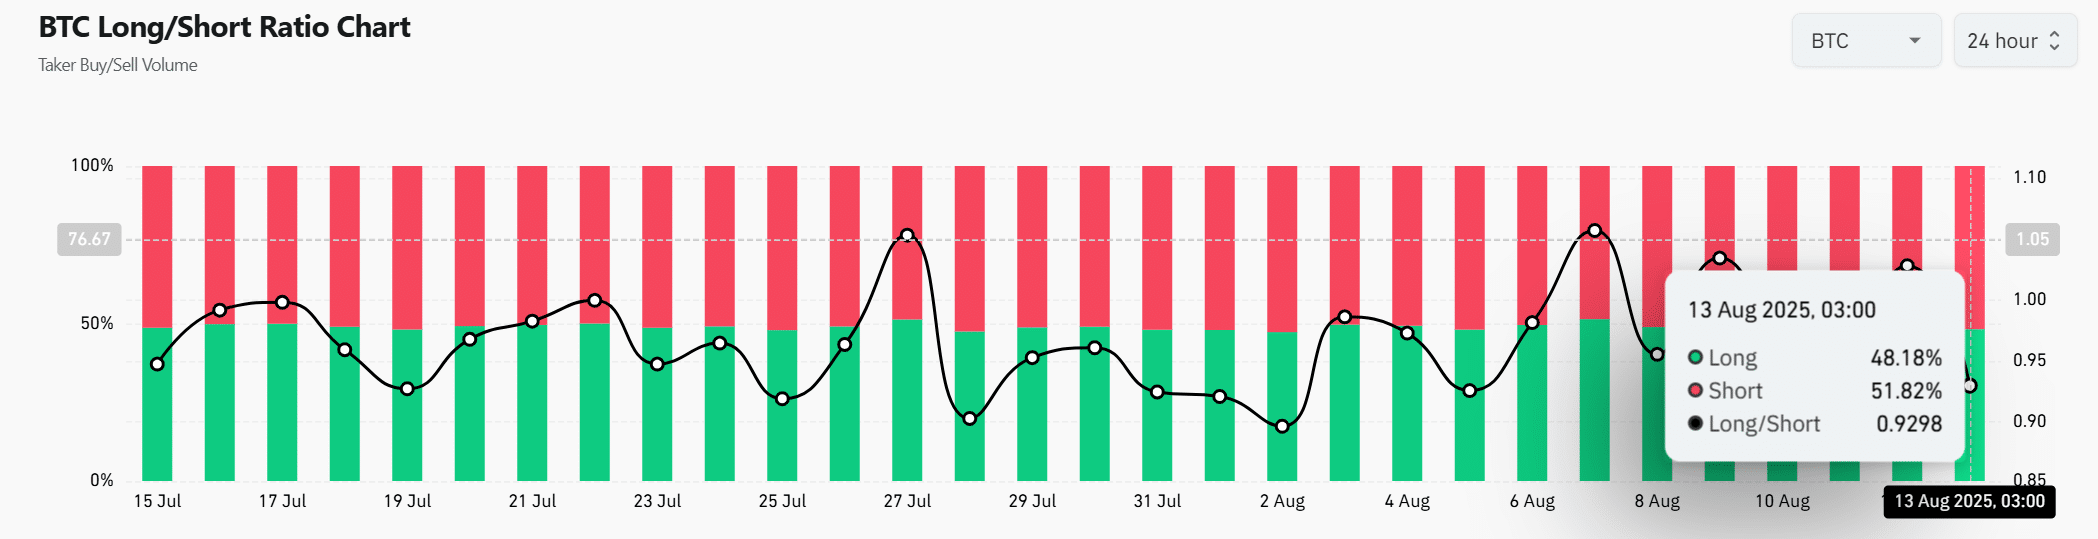
Source: CoinGlass
Liquidation Levels: A Magnet for Price Action?
Analysis of the Liquidation Map reveals substantial clusters of long positions vulnerable to liquidation just above the $119,669 price level, specifically within the $118,800 to $120,500 range.
Historically, prices tend to be drawn towards such areas of high liquidity, leading to significant price changes as positions are forcibly closed.
Moreover, the existing high levels of leverage could amplify the impact of any price action that occurs when these levels are approached.
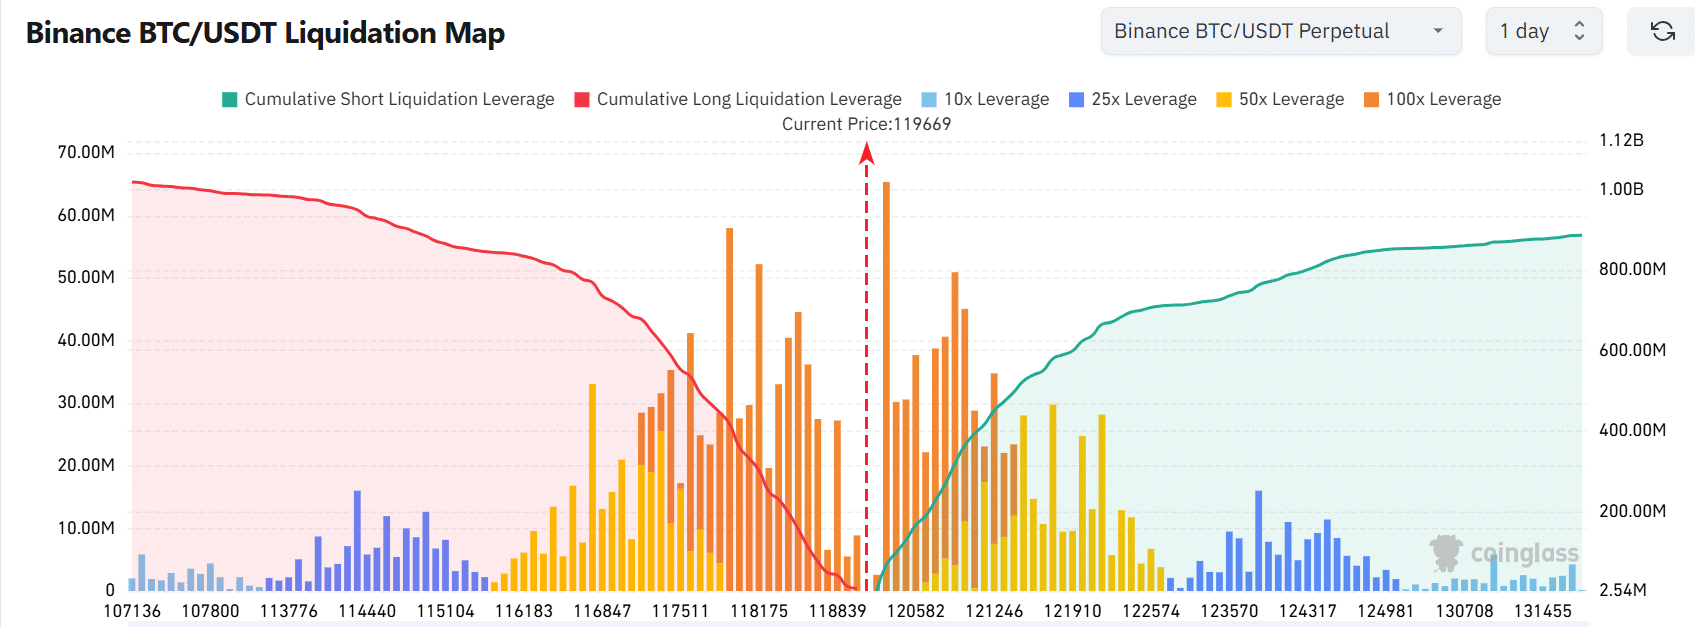
Source: CoinGlass
Bitcoin: Stability or Volatility Ahead?
While reduced selling pressure from miners and increased accumulation by large holders provide potentially positive indicators, the combination of extreme leverage and concentrated liquidation zones heightens the risk of significant price volatility.
The interplay of these conflicting forces will ultimately determine whether Bitcoin maintains its present trading range or experiences a rapid correction in the coming days.