

Key Points to Consider:
- The surge in XRP’s value, hitting $3, has resulted in substantial profits for a large portion of its holders, a situation that historically preceded market corrections.
- Analyzing on-chain data suggests XRP is currently in a phase characterized by “belief and denial,” mirroring patterns observed during previous market peaks in 2017 and 2021.
Data from Glassnode indicates that the recent price increase of XRP (XRP), reaching over $3, has placed approximately 94% of the total XRP supply in a profitable position for holders. You can review the data here.
As of Sunday, the data showed a percentage of 93.92% of XRP’s supply in profit. This figure reflects substantial financial gains for investors, fueled by a dramatic price climb exceeding 500% over the last nine months, escalating from under $0.40 to $3.11.
Historical Trends Suggest Potential XRP Price Peak When Profitability Exceeds 90%
Historically, such widespread profitability has been a signal of potentially overvalued market conditions.
For instance, in early 2018, XRP reached a peak near $3.30 when over 90% of holders were in profit, preceding a significant price decline of 95%. A similar scenario unfolded in April 2021, where profitability levels exceeding 90% occurred just before an 85% price drop from a high of approximately $1.95.
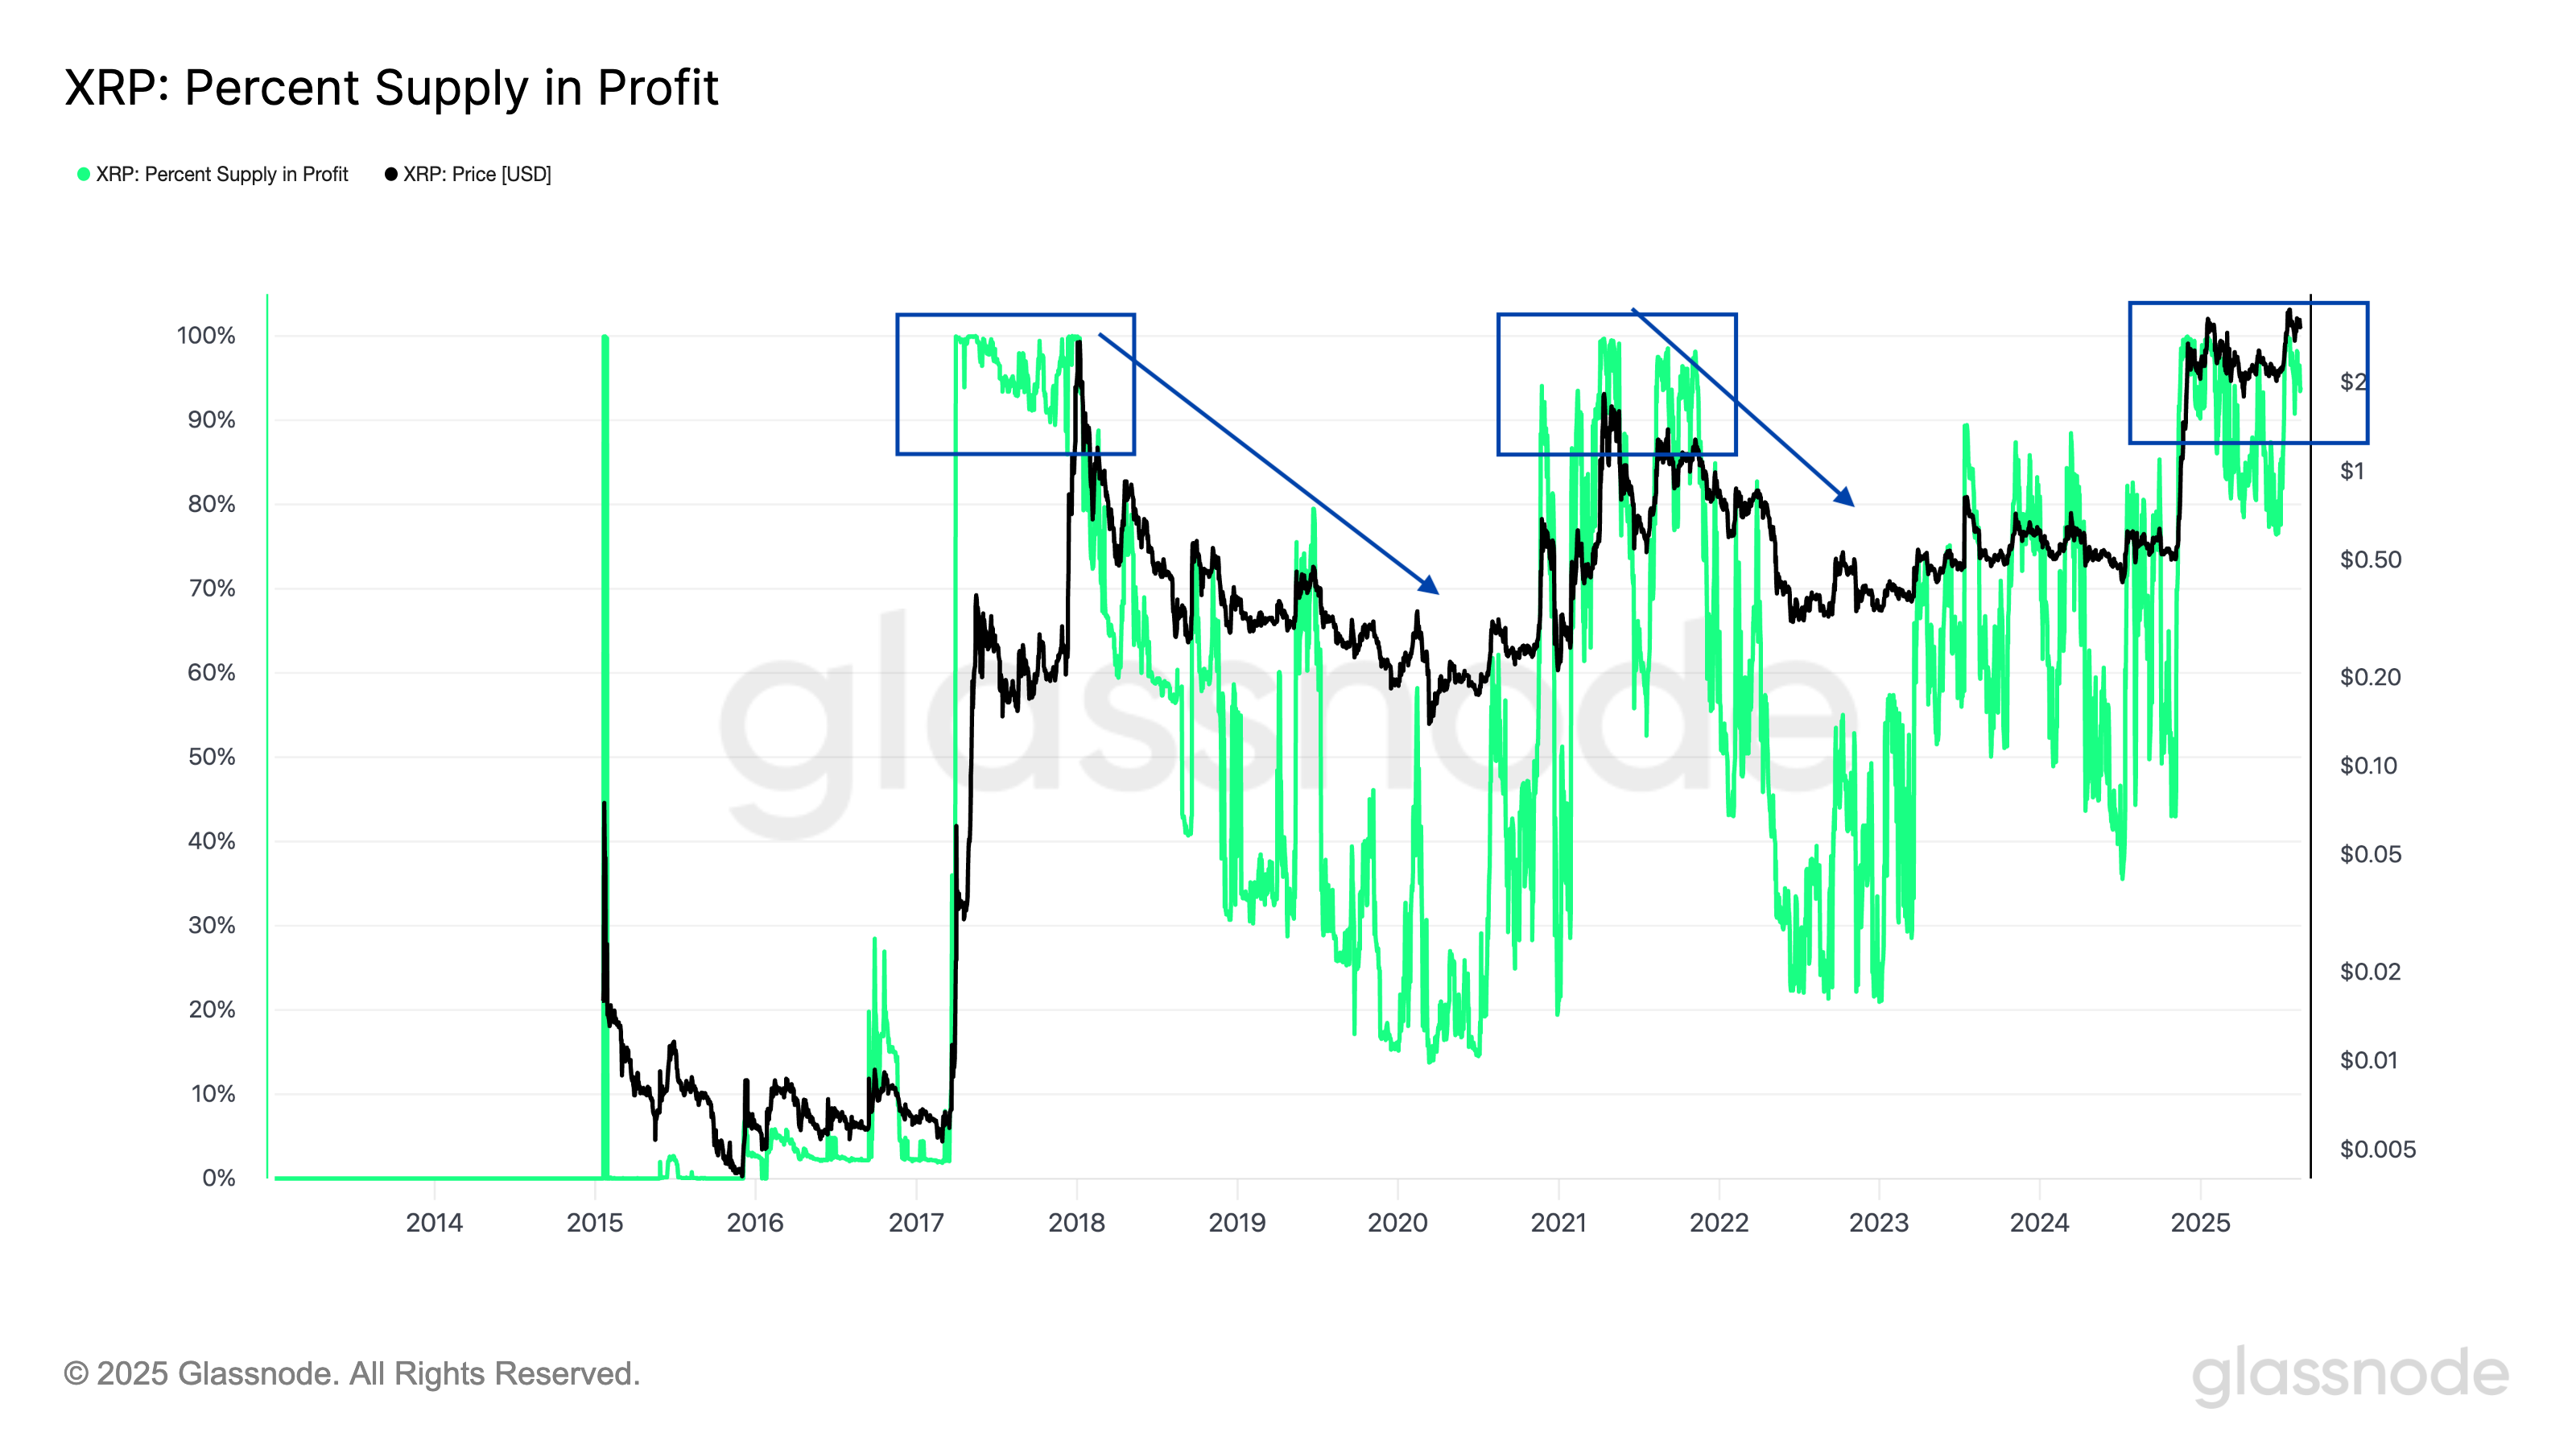
This broad profitability demonstrates strong investor earnings, increasing the possibility of market distribution as investors might look to secure their profits. A comparable situation could be taking shape at present.
NUPL Indicator Mirrors 2017 and 2021 Price Peaks for XRP
Further indications of potential market peaks are emerging from XRP’s Net Unrealized Profit/Loss (NUPL).
This indicator, reflecting the difference between unrealized gains and losses across the XRP network, has transitioned into what is termed the “belief–denial” zone, a phase that has historically been observed either before or during market tops.
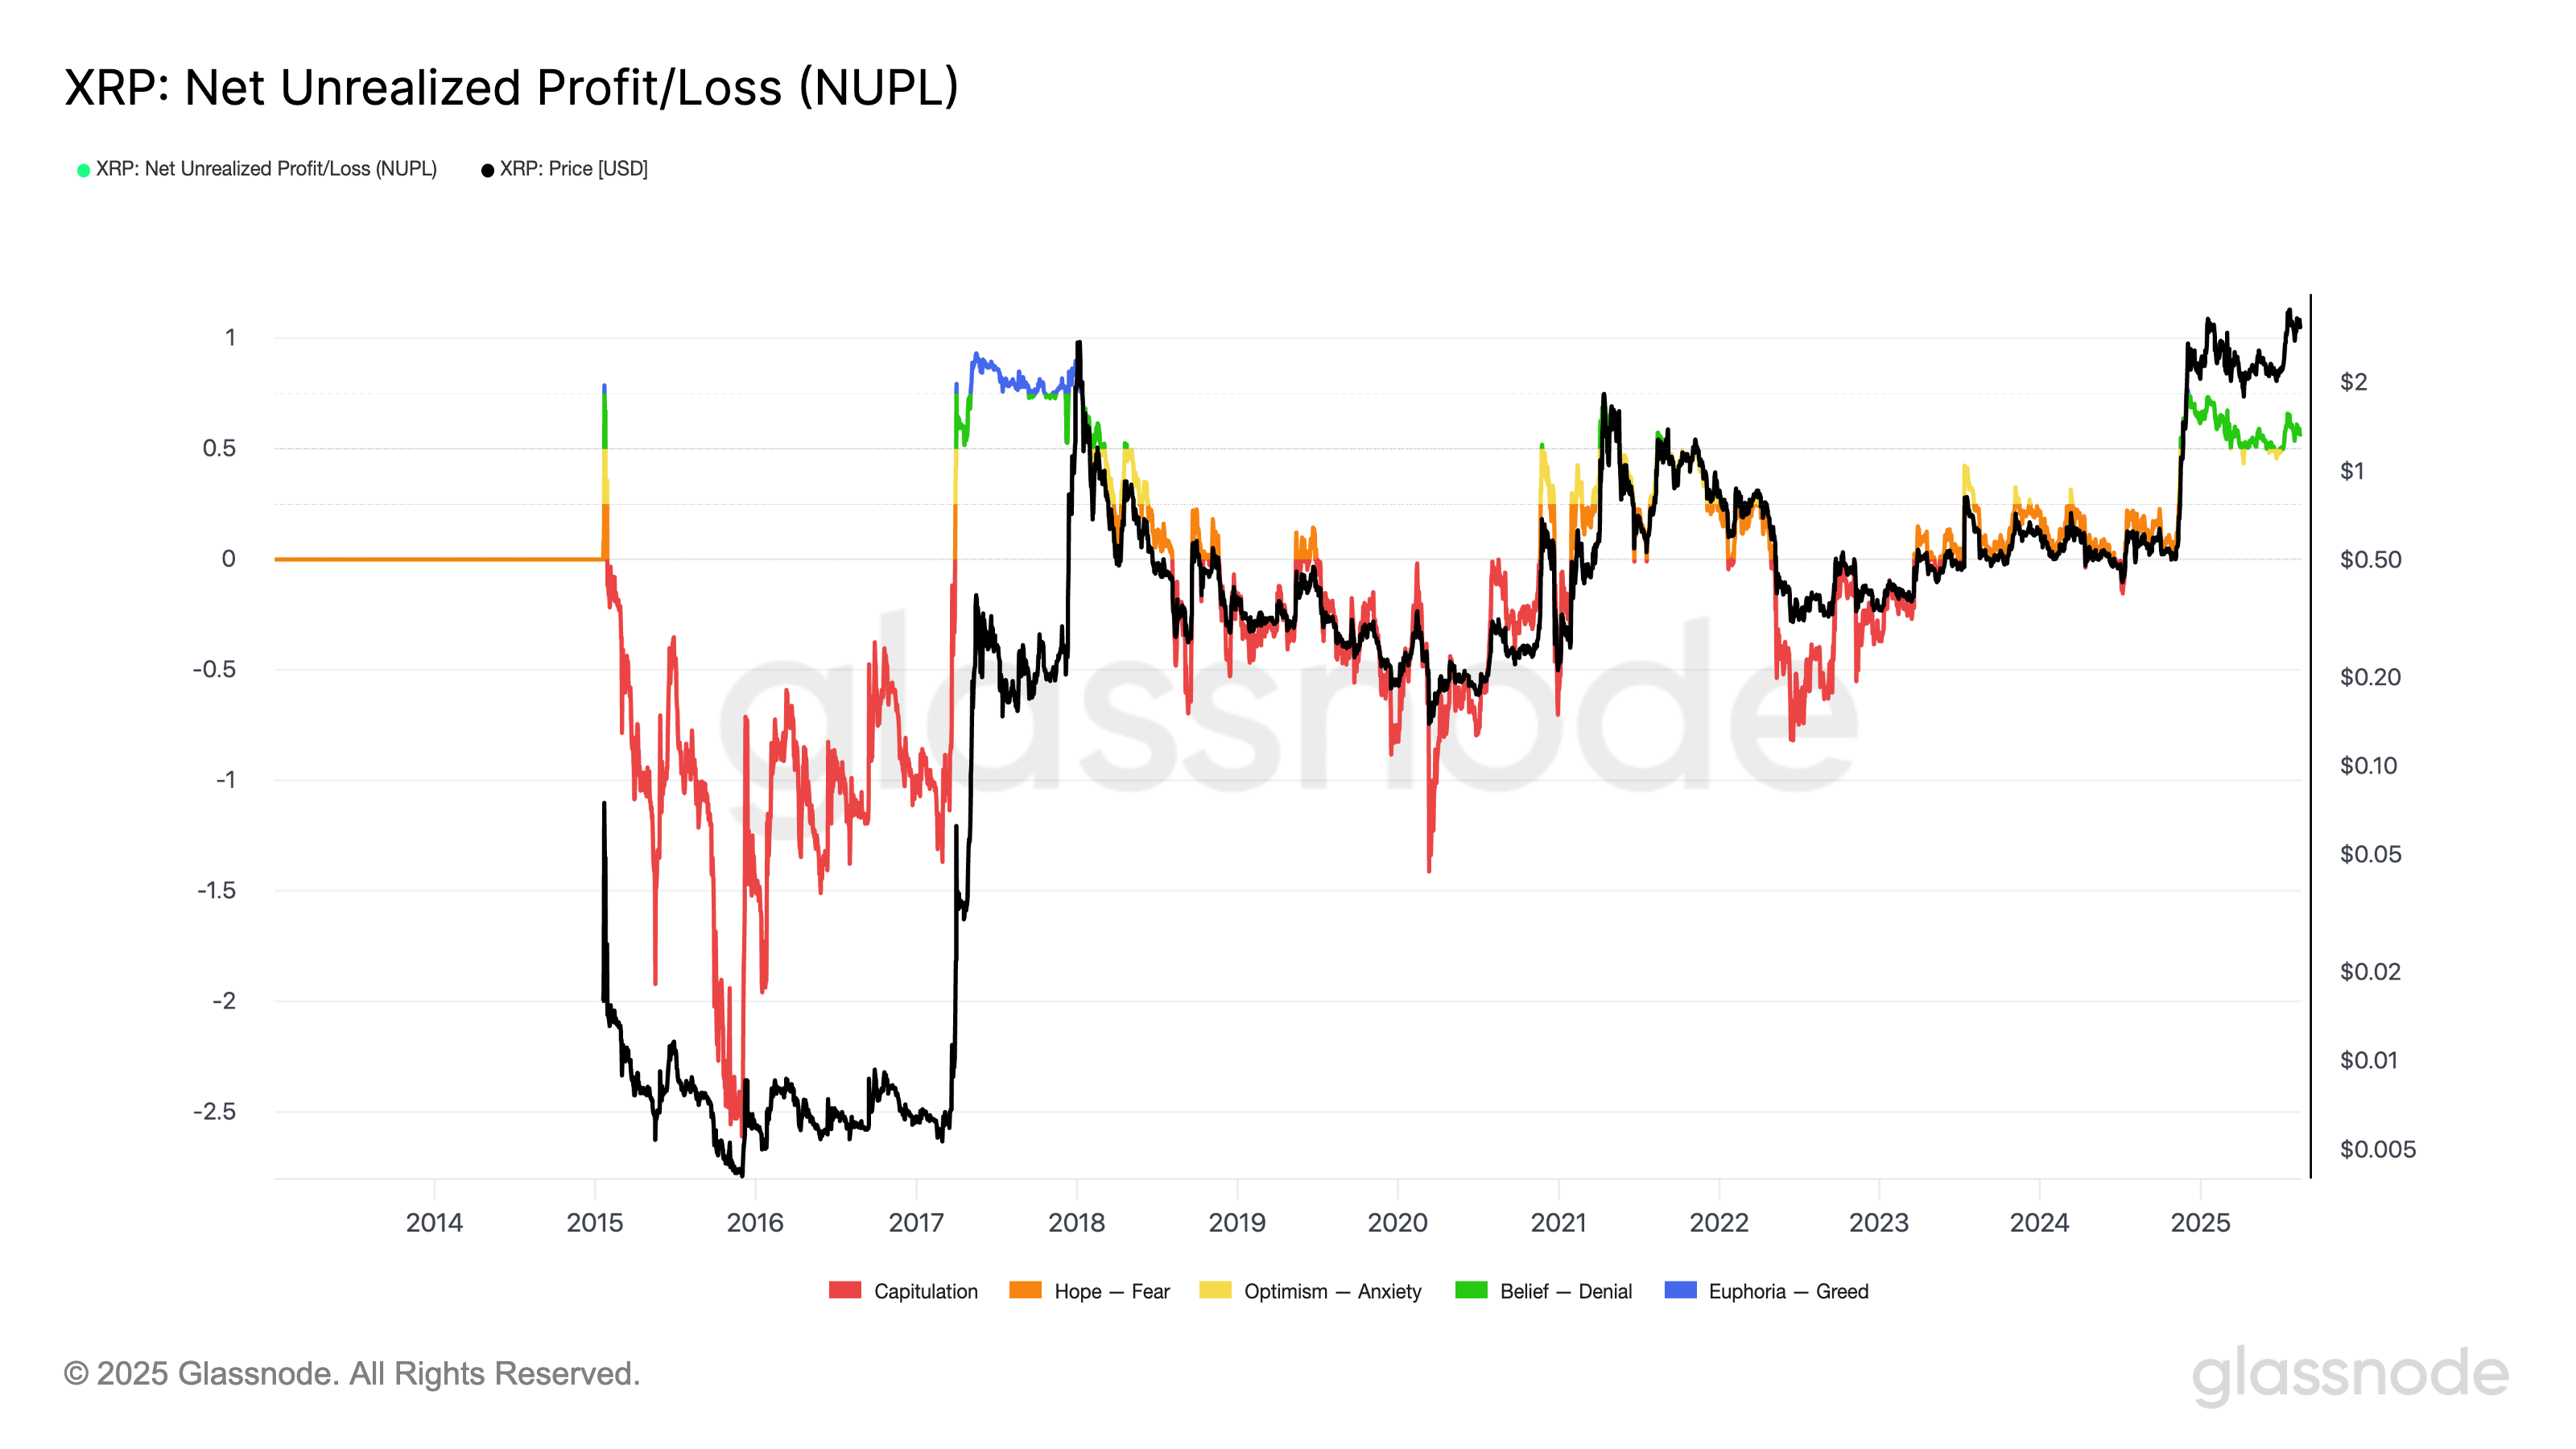
For instance, in late 2017, XRP’s NUPL reached comparable levels just as its price peaked above $3.30. A similar pattern was seen in April 2021, with NUPL readings above 0.5 coinciding with XRP’s high near $1.95 before a sharp market downturn.
The current trend suggests a high level of profitability among investors, though not yet at a stage of complete “euphoria.” However, the possibility of profit-taking and market distribution will significantly increase if the NUPL climbs toward greed levels, something not seen since 2018.
XRP could potentially handle potential selling pressure and avoid a substantial correction below $3 if it manages to draw new investment, supported by interest from institutional investors and the positive trend observed across the broader altcoin market.
Bearish Pattern Risks XRP Price Drop
After rising above $3, XRP’s price is undergoing consolidation within a descending triangle pattern.
This pattern, commonly indicating a bearish trend, is characterized by lower price peaks forming against a steady horizontal support level near $3.05. Earlier in the month, XRP briefly dipped below this support level, a move that turned out to be a false breakout, with the price quickly recovering back inside the structure.
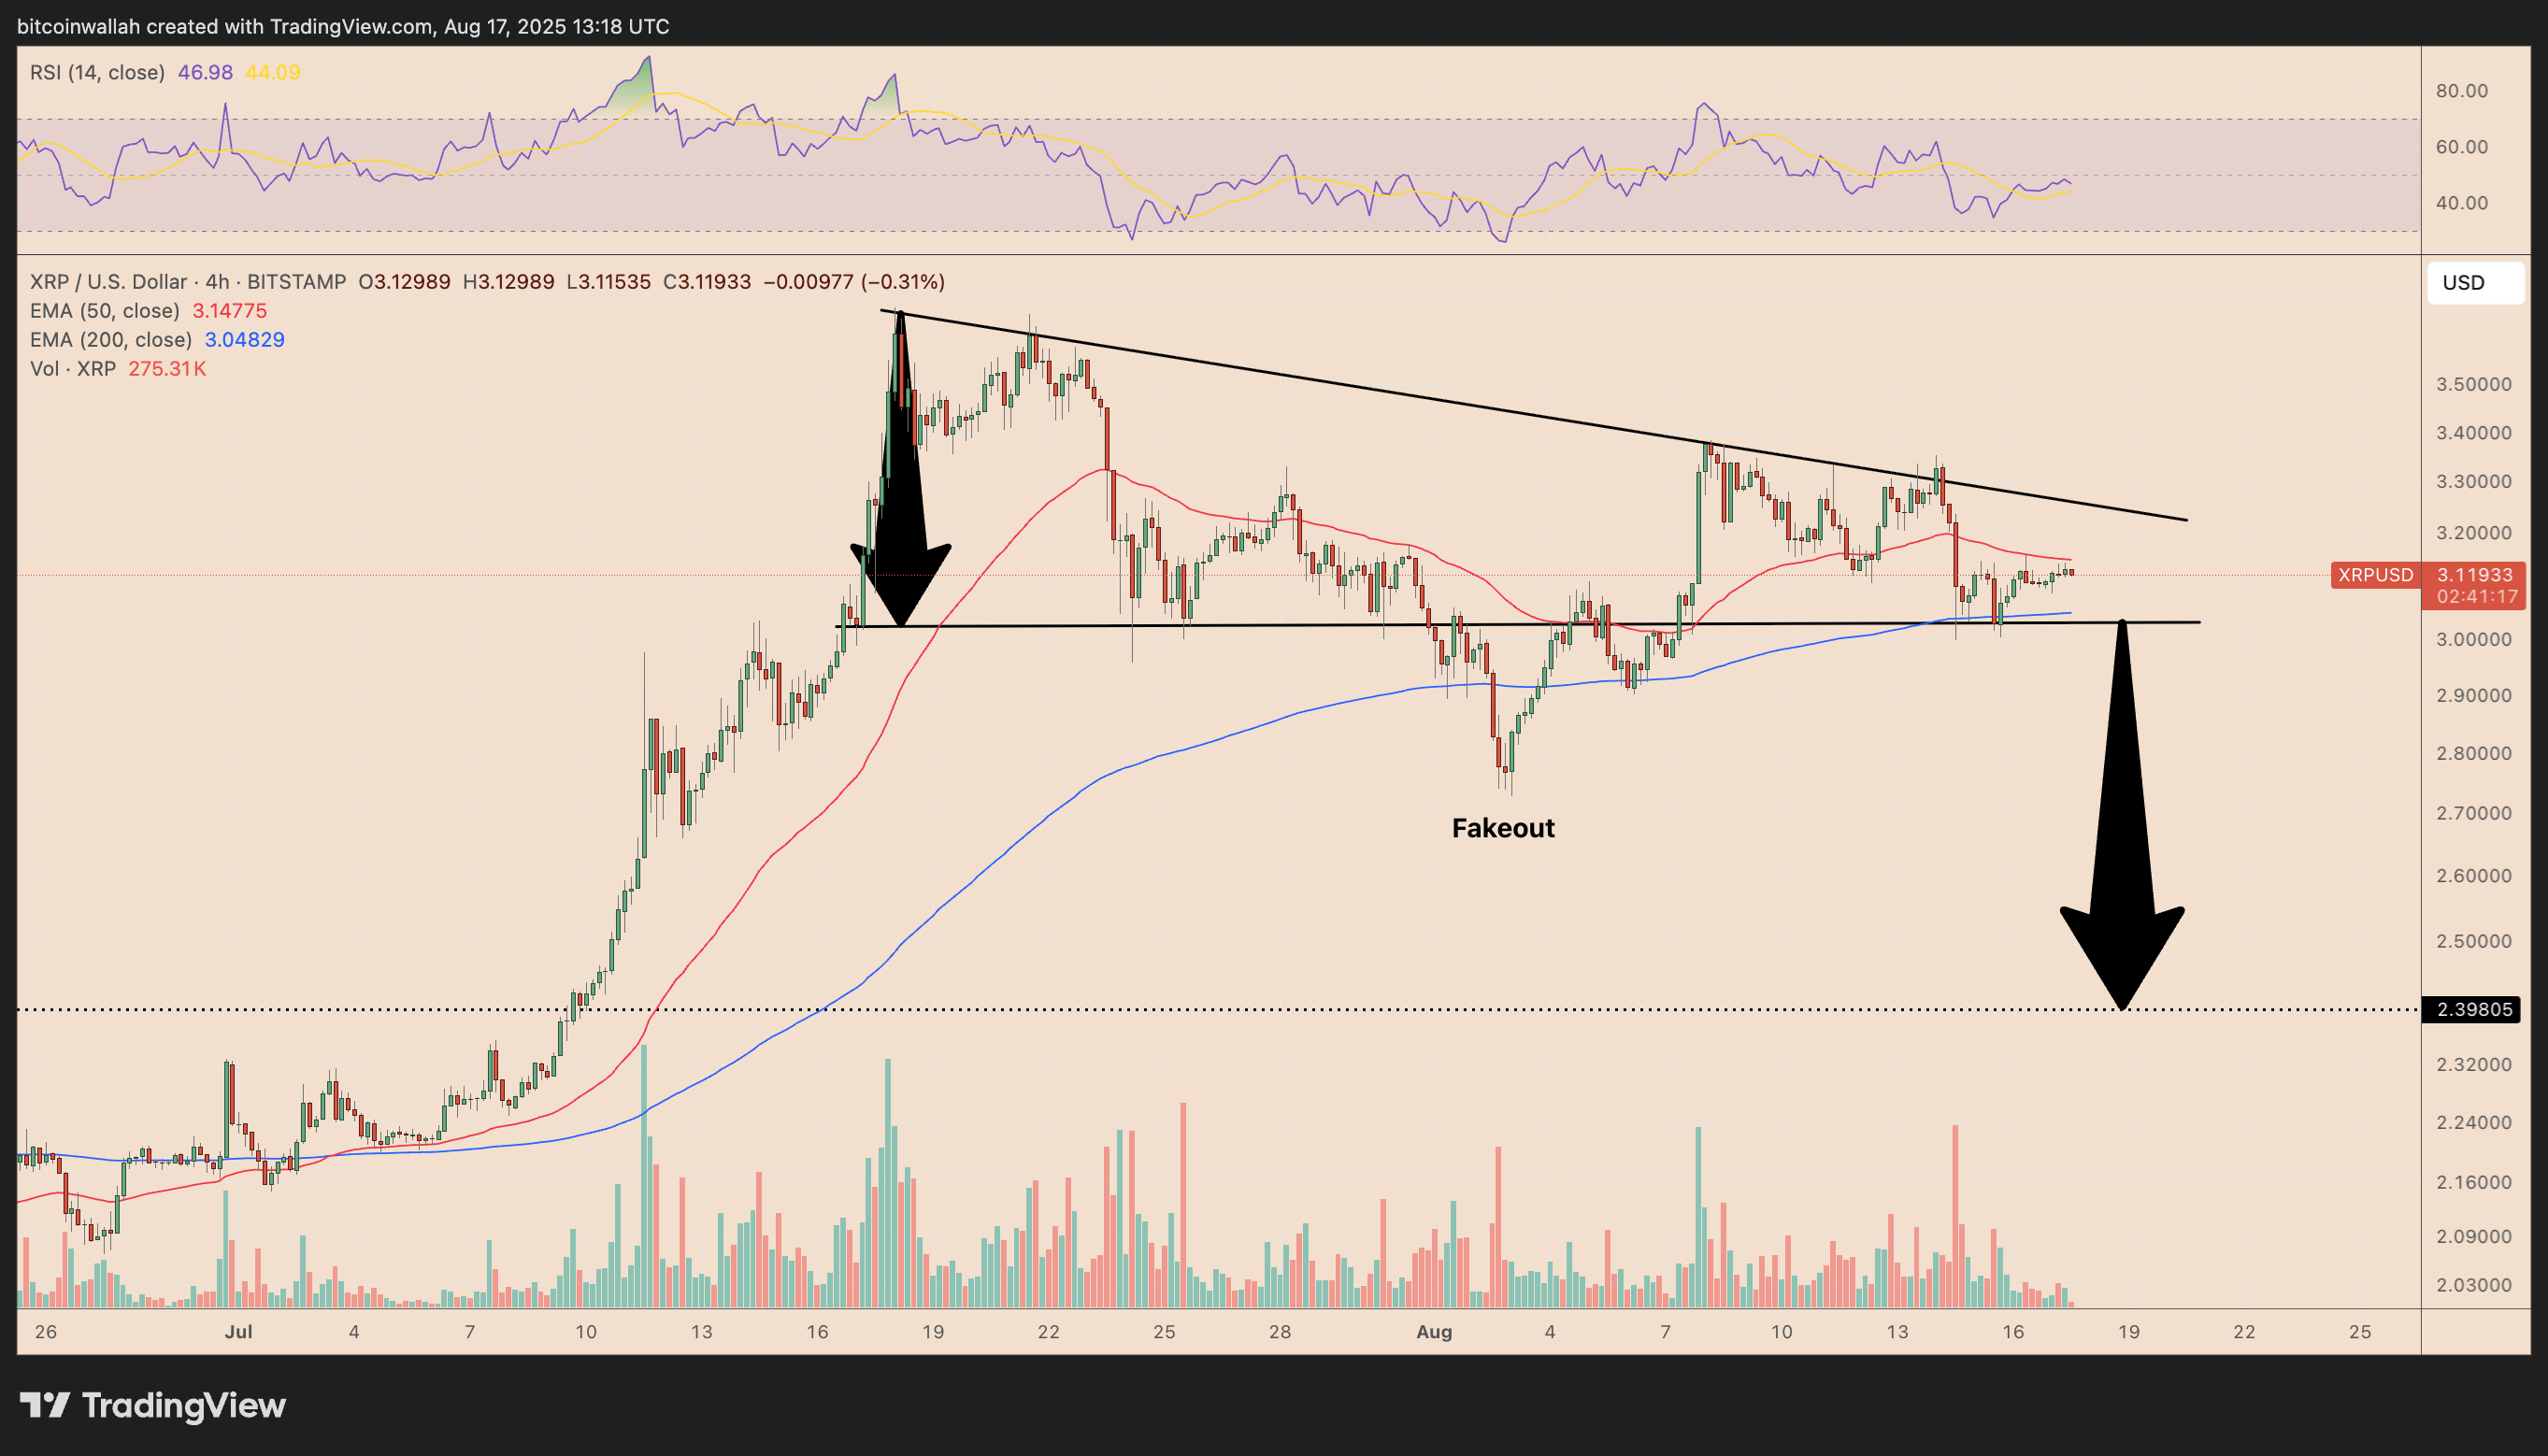
The repeated testing of the lower trendline is increasing the likelihood of a significant breakdown. Should the price decisively fall below $3.05, it could prompt a sell-off towards $2.39 by September, marking a potential decline of about 23.50% from the current price levels.
Related Article: Can XRP reach $30 during this bull run?
Conversely, for the bullish outlook to prevail, buyers need to push the price above the descending resistance line, thereby regaining upward momentum and negating the bearish pattern. Many forecasts suggest that the price of XRP could potentially reach $6 in such a scenario.
This article is for informational purposes only and should not be considered financial advice. Investing involves risk, and it is essential to conduct thorough research before making any investment decisions.