

- Bitcoin’s decline continues after a quiet weekend, testing support near its 50-day moving average.
- Ethereum falls back within a descending channel, with traders watching the $4,000 level as selling pressure increases.
- XRP slips below $3.00, a key support level, raising concerns about further price drops.
Bitcoin (BTC) is extending its retreat below $115,000, currently testing a significant level of support around its 50-day Exponential Moving Average (EMA). This downward move comes amid growing market uncertainty, leading to over $500 million in liquidations across the crypto space in the last 24 hours.
Similarly, Ethereum (ETH) and Ripple (XRP) are experiencing similar negative trends, each showing losses of nearly 4%. This sell-off may impact institutional interest in leading cryptocurrencies like Bitcoin and Ethereum, potentially increasing market volatility.
From a technical analysis perspective, major cryptocurrencies face increased downside risks as selling activity intensifies.
Crypto Market Sees Over $500 Million Liquidated in a Single Day
Data from CoinGlass reveals that total liquidations in the cryptocurrency market reached $552.42 million, with $483.23 million from long positions and $69.06 million from short positions.
The significantly higher volume of long liquidations suggests a growing risk-averse attitude among investors. This environment could lead to further price corrections in the crypto market as fear becomes a dominant factor.
Institutions Maintain Confidence in Bitcoin and Ethereum
Despite the recent pullback, Bitcoin and Ethereum have continued to attract substantial investment from U.S. institutions. This indicates a degree of confidence from these major players, which will face a crucial test as both cryptocurrencies undergo significant declines this Monday.
Sosovalue data shows Ethereum marking its largest weekly net inflow of $2.85 billion, marking its fourteenth consecutive week of positive flows.
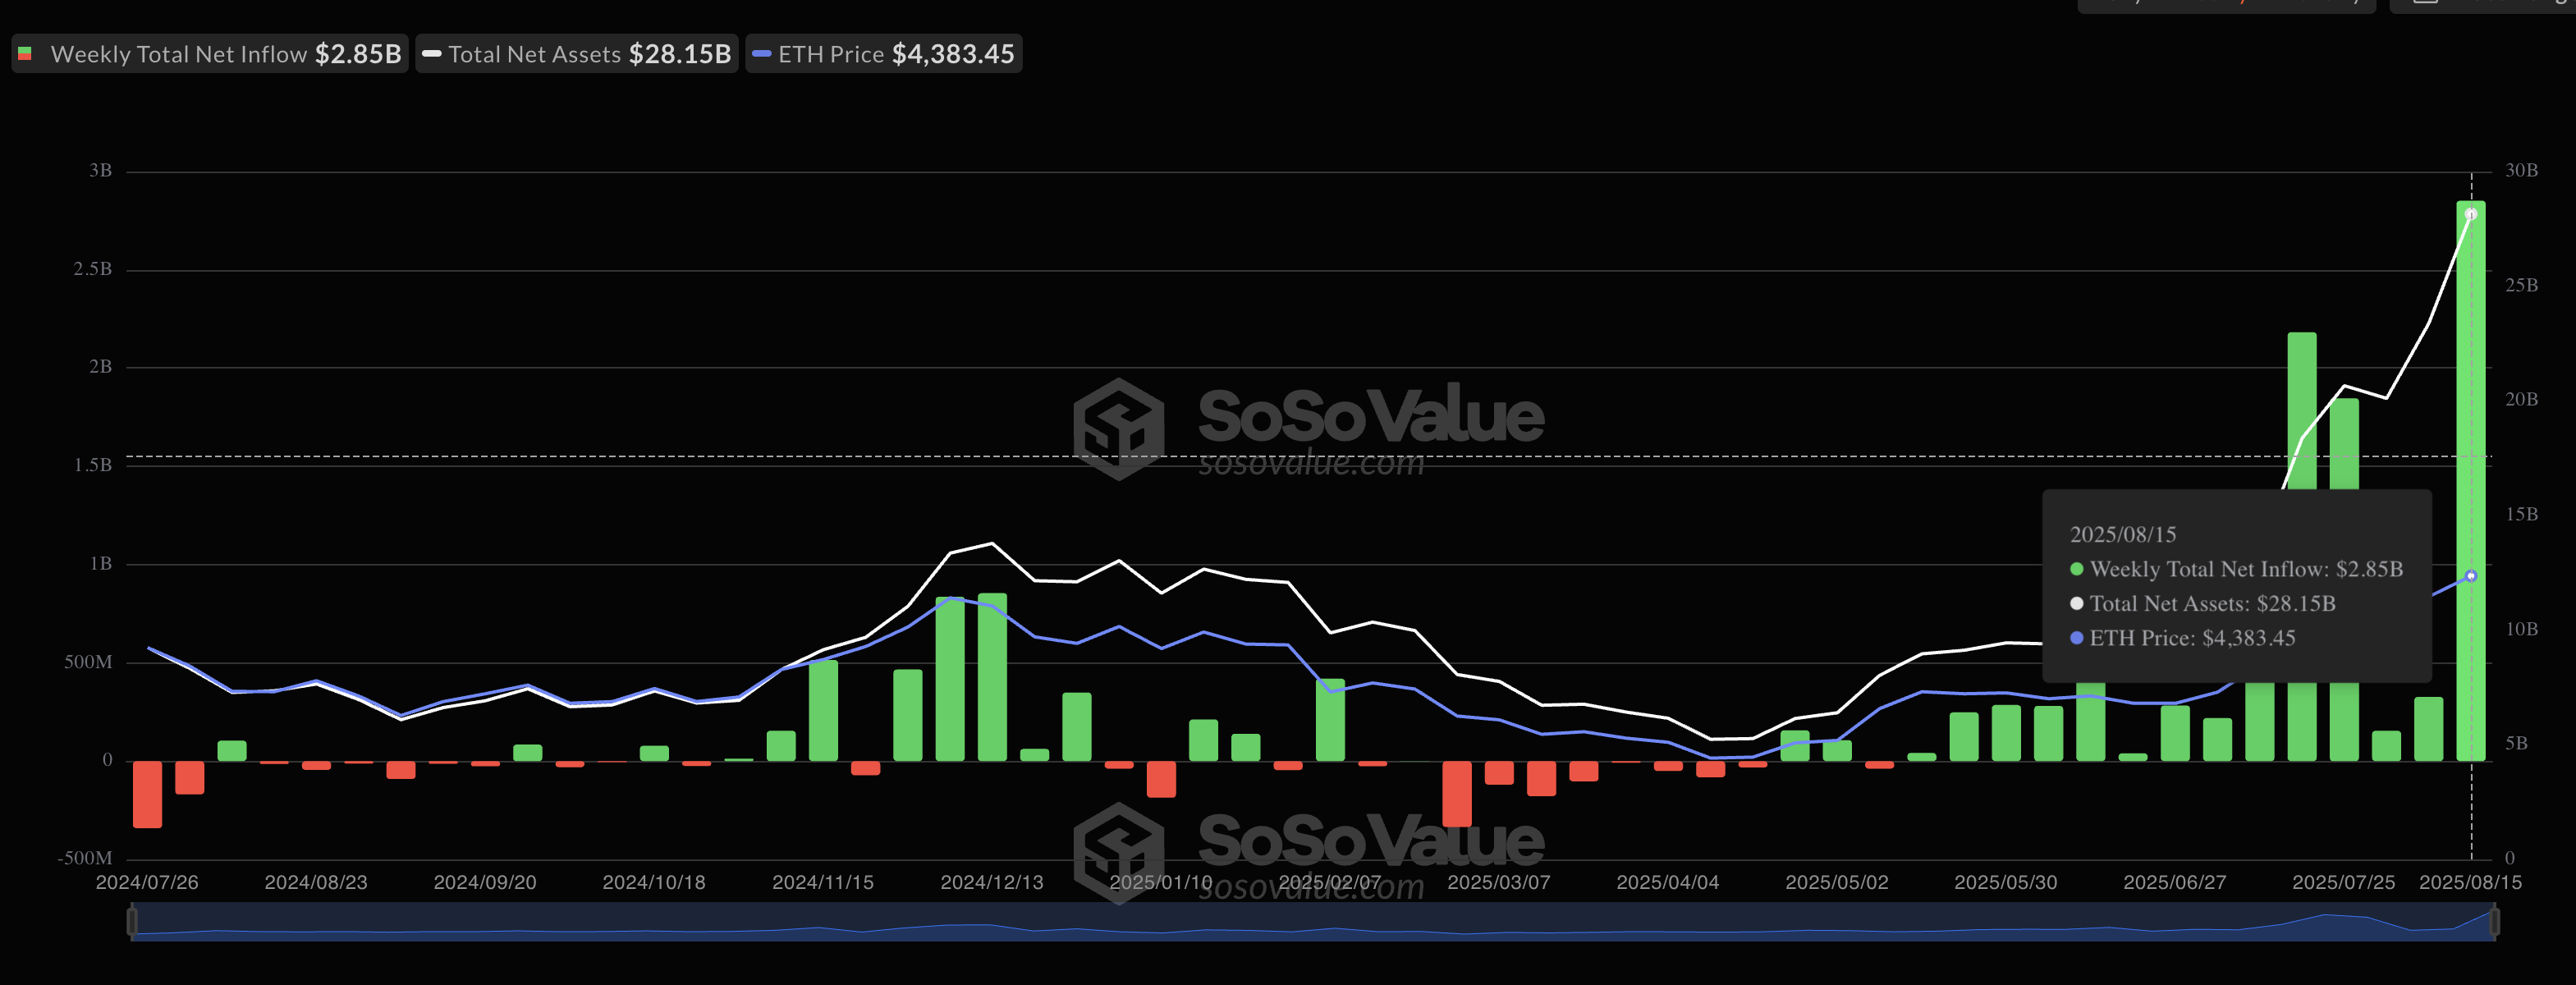
Ethereum spot ETF data | Source: SoSoValue
Bitcoin also experienced consistent growth, with net inflows reaching $547.82 billion, exceeding the $246.75 billion recorded the previous week.
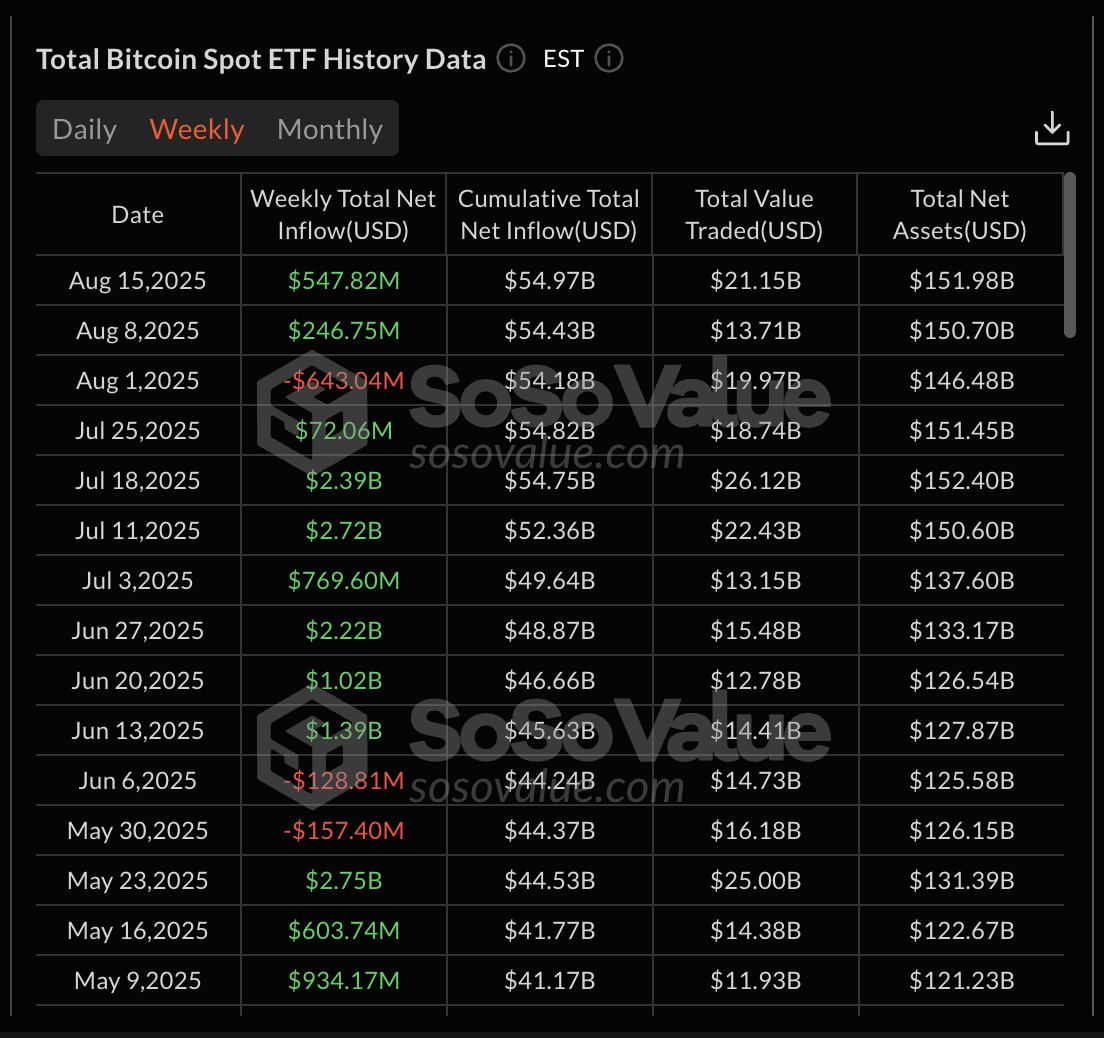
Bitcoin spot ETF data | Source: SoSoValue
Bitcoin and Ethereum ETFs based in the U.S. currently hold total assets valued at $151.98 billion and $28.15 billion, respectively.
Bitcoin Weakens, with Bears Targeting $111,980
Bitcoin is currently down by 2% on Monday, trading below its 50-day EMA at $115,001. The recent downturn follows a 4% price drop on Thursday, triggered by a peak of $124,474, and has fueled the current downward correction.
The most likely scenario points towards a further decline towards the $111,980 support level, which was last tested on August 3, as selling pressure builds.
Momentum indicators are signaling a sell, reflecting decreasing bullish activity. The Moving Average Convergence Divergence (MACD) on the daily chart has crossed below its signal line. Additionally, the Relative Strength Index (RSI) stands at 44, below the midpoint, indicating reduced buying momentum.
The 100-day and 200-day EMAs, located at $110,362 and $102,939 respectively, could provide dynamic support if the downtrend persists.
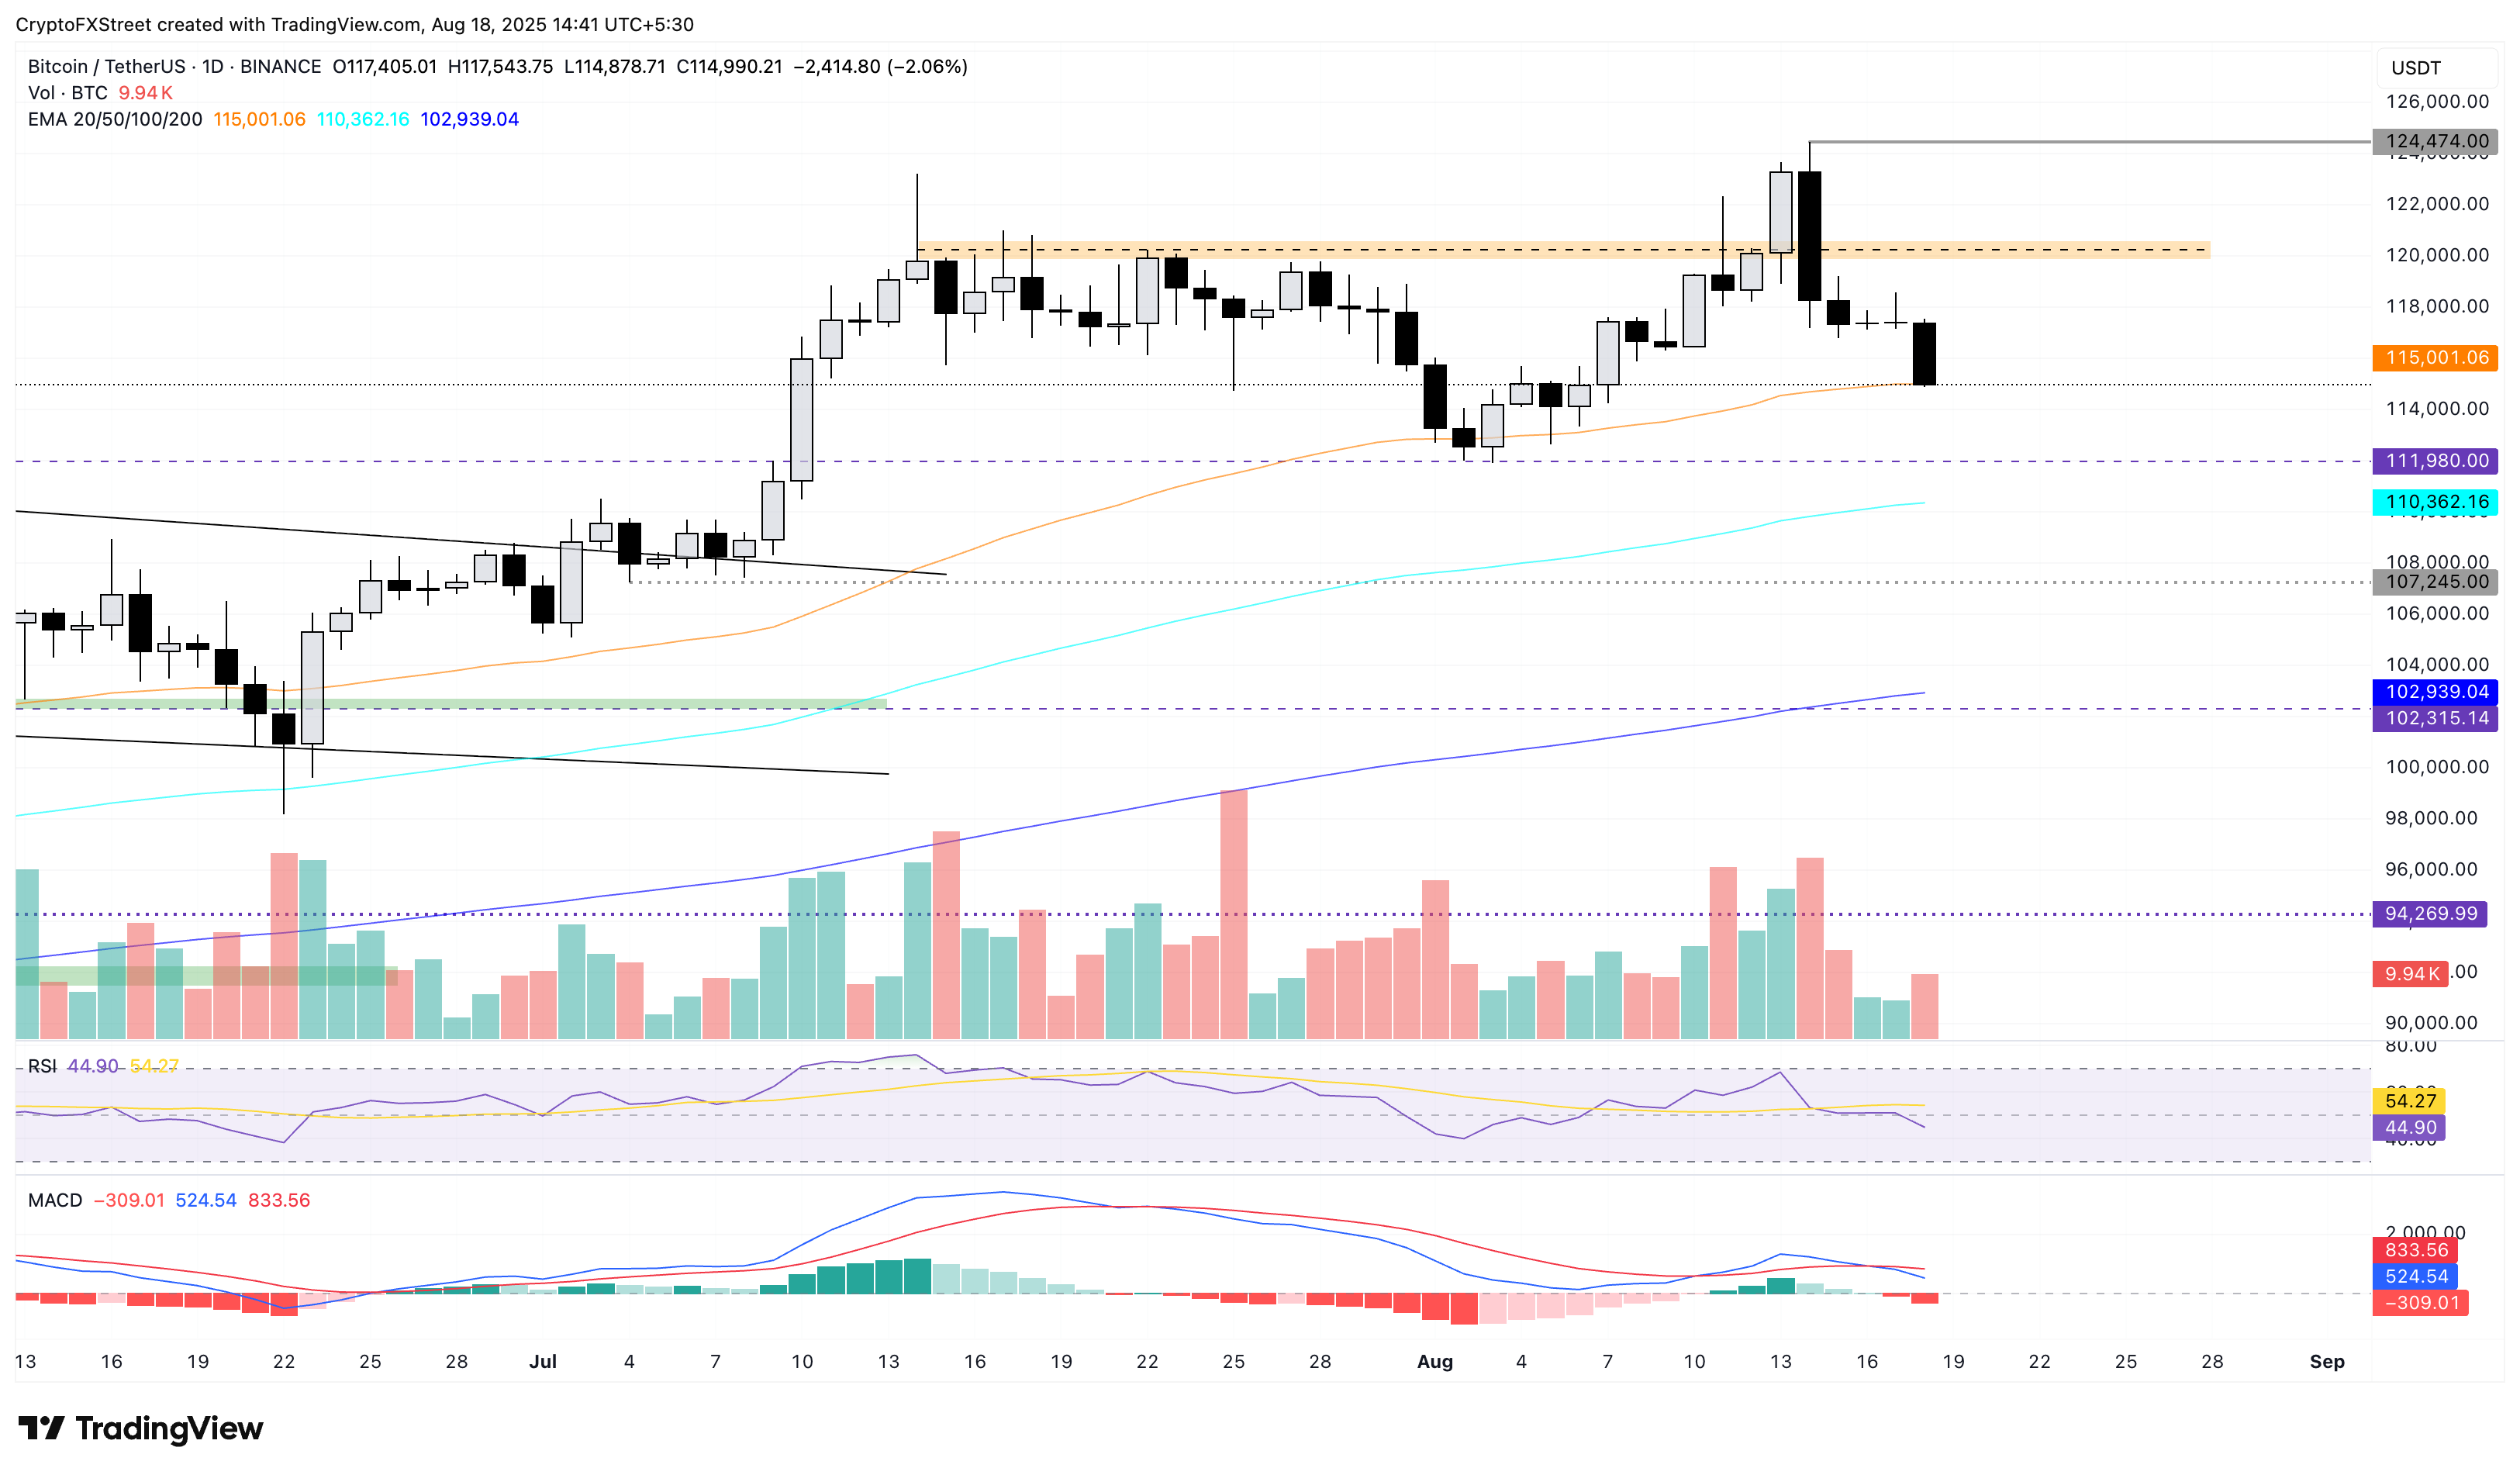
BTC/USDT daily price chart.
Conversely, a rebound from the 50-day EMA at $115,001 could lead to a retest of the $120,000 resistance zone.
Ethereum Declines Within a Channel, Targeting $4,000
Ethereum has failed to maintain levels above $4,300, falling by over 4% at the time of this report on Monday. The altcoin is approaching the support trendline of an ascending channel on the daily chart (see below), reversing from a high of $4,868 last week.
Amidst the selling pressure, ETH is eyeing the $3,941 level, aligning with the July 28 high and the lower boundary of the rising channel.
The MACD is nearing its signal line, suggesting a potential trend change, as declining green histograms indicate weakening bullish momentum. The RSI currently reads 58 on the daily chart, having dropped from overbought territory, signifying a sharp reduction in buying activity.
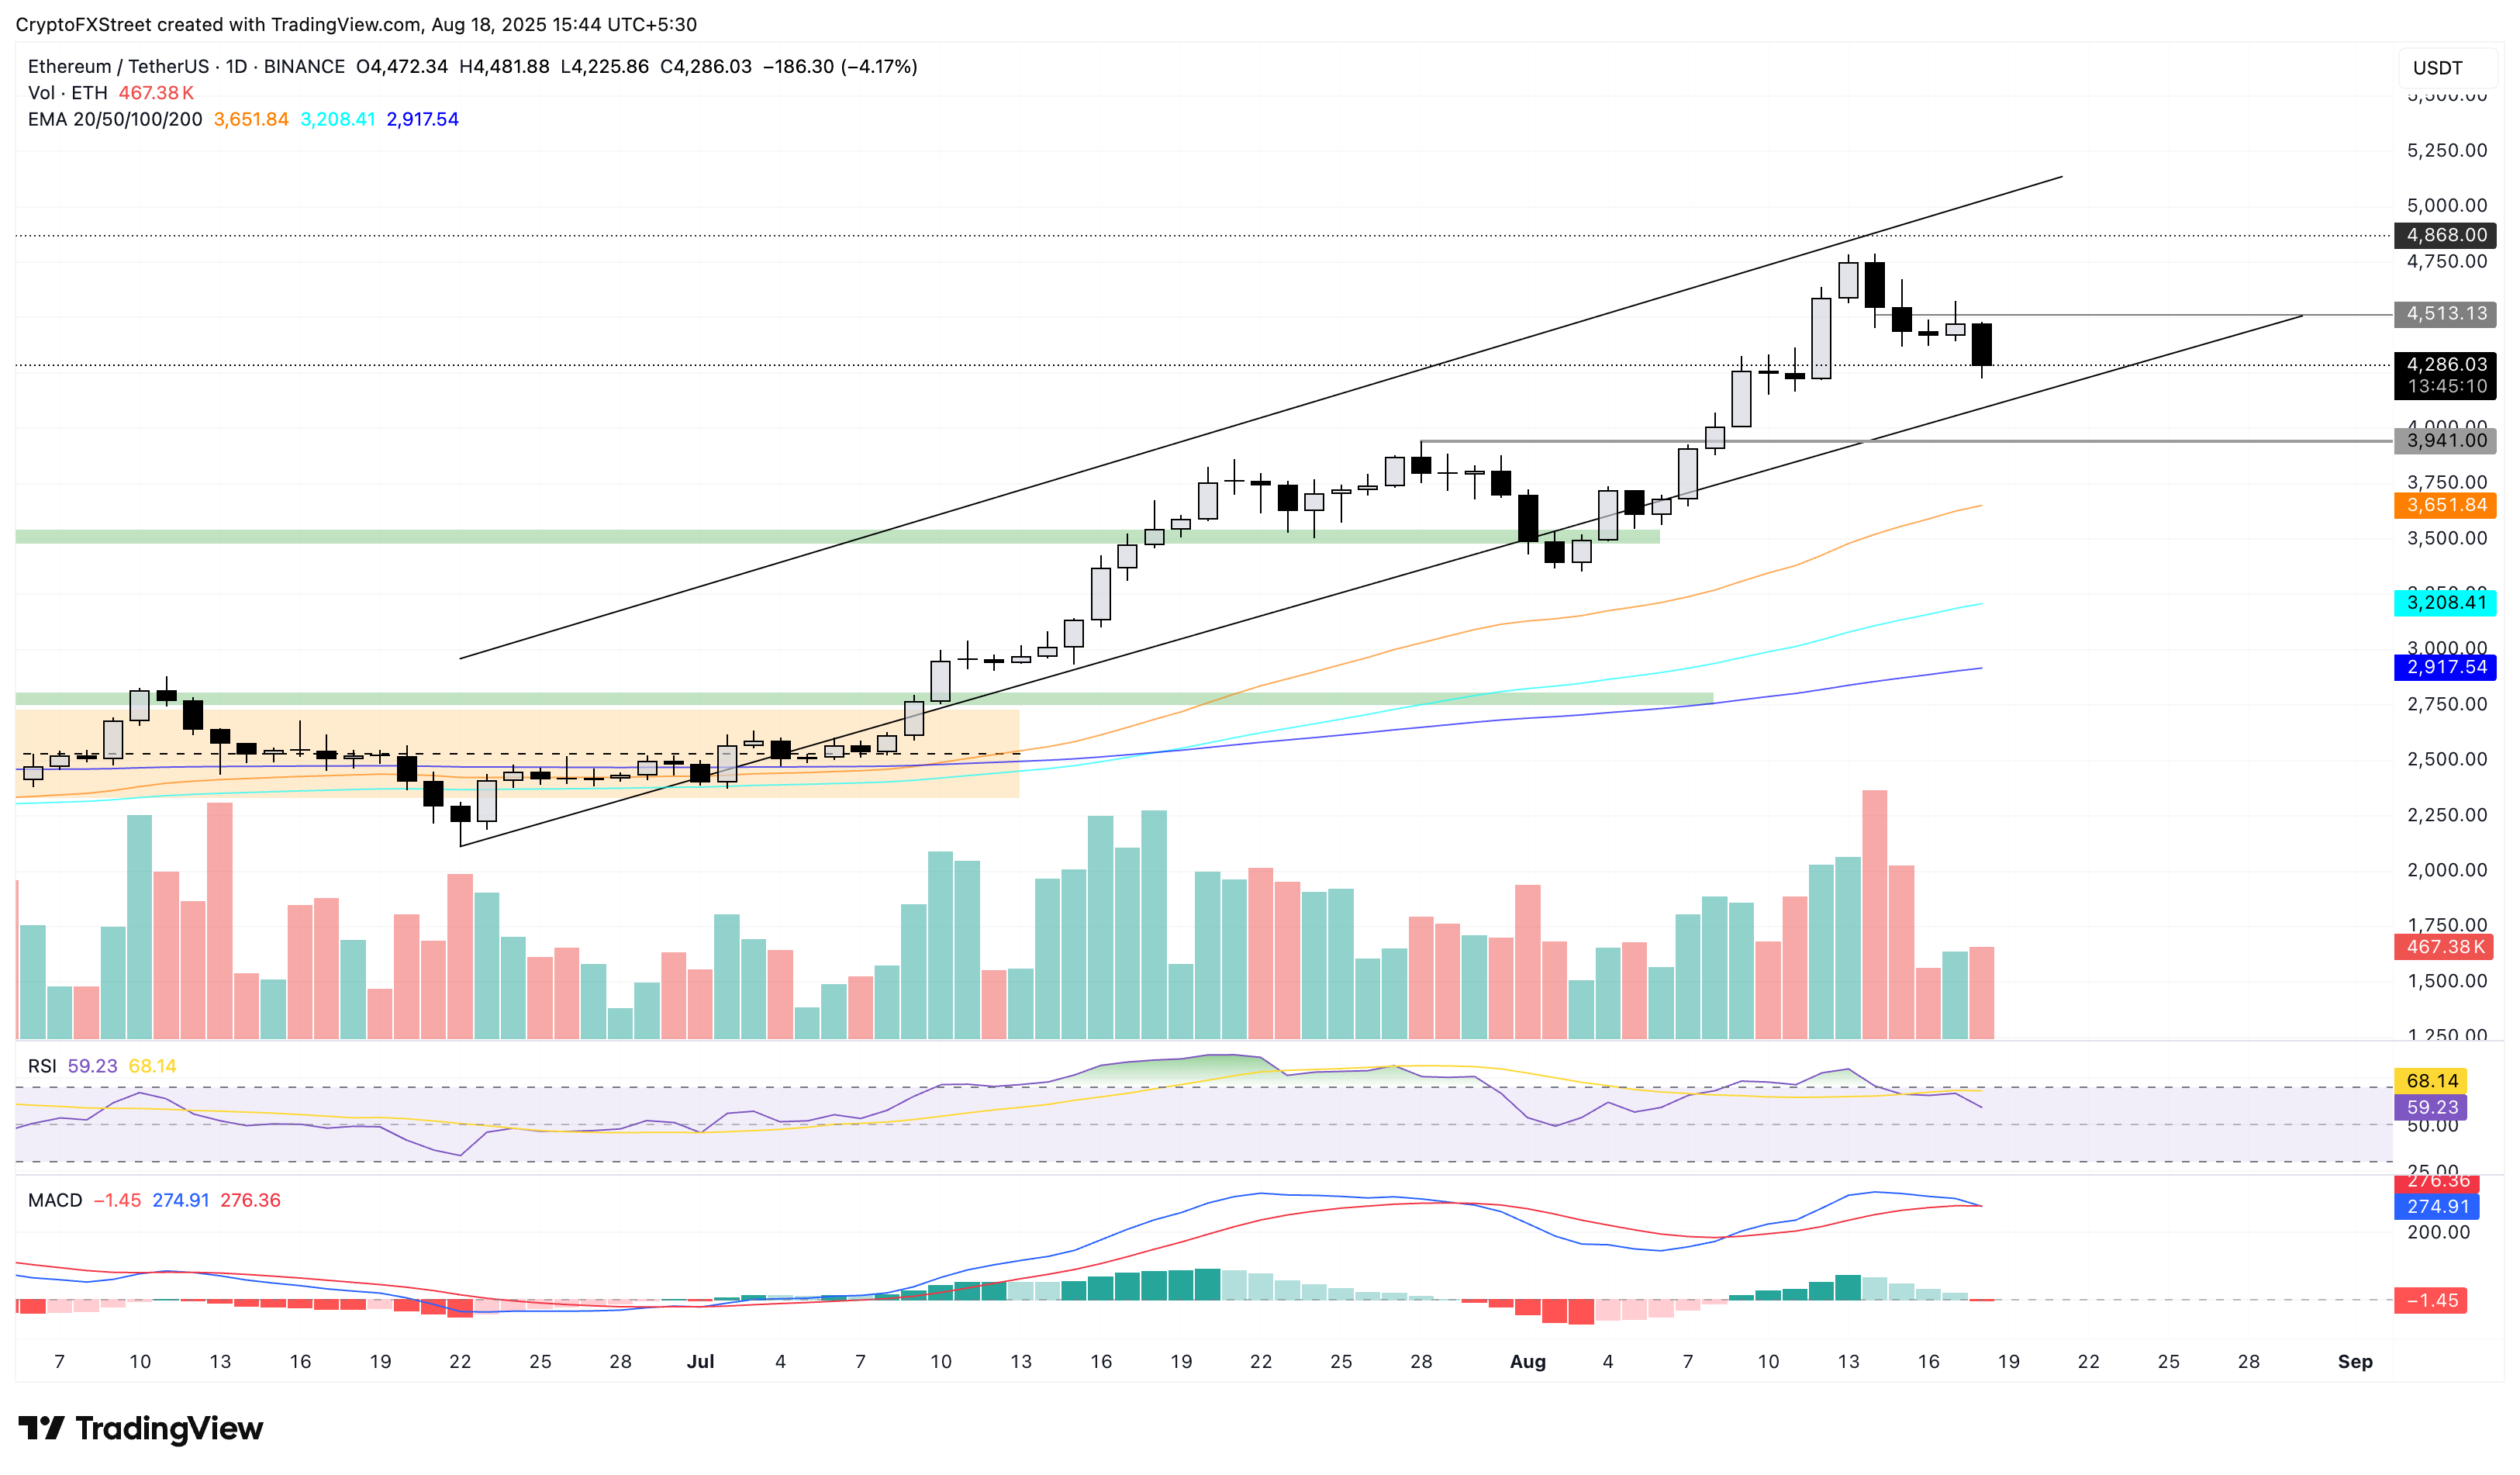
ETH/USDT daily price chart.
On the other hand, an intraday reversal resulting in a positive close could challenge the $4,500 resistance level.
XRP’s Trendline Breakdown Raises Risk of Further Losses
Ripple has fallen below the $3.00 mark, trading at $2.97 as of Monday, with a 3.8% loss. XRP’s retreat is testing a long-standing resistance trendline formed by connecting the lows of June 23 and August 3, as well as the 50-day EMA at $2.94.
The cross-border payment token is also testing the 38.2% Fibonacci retracement level at $2.99, measured from the June 22 low of $1.90 to the July 18 high of $3.66. A decisive close below the 50-day EMA could lead to a test of the 50% retracement level at $2.78.
Momentum indicators are leaning bearish, with the RSI at 45, below the midline, indicating diminishing buying strength. Furthermore, the MACD and its signal line are extending their downward trajectory, pointing to increasing bearish momentum.
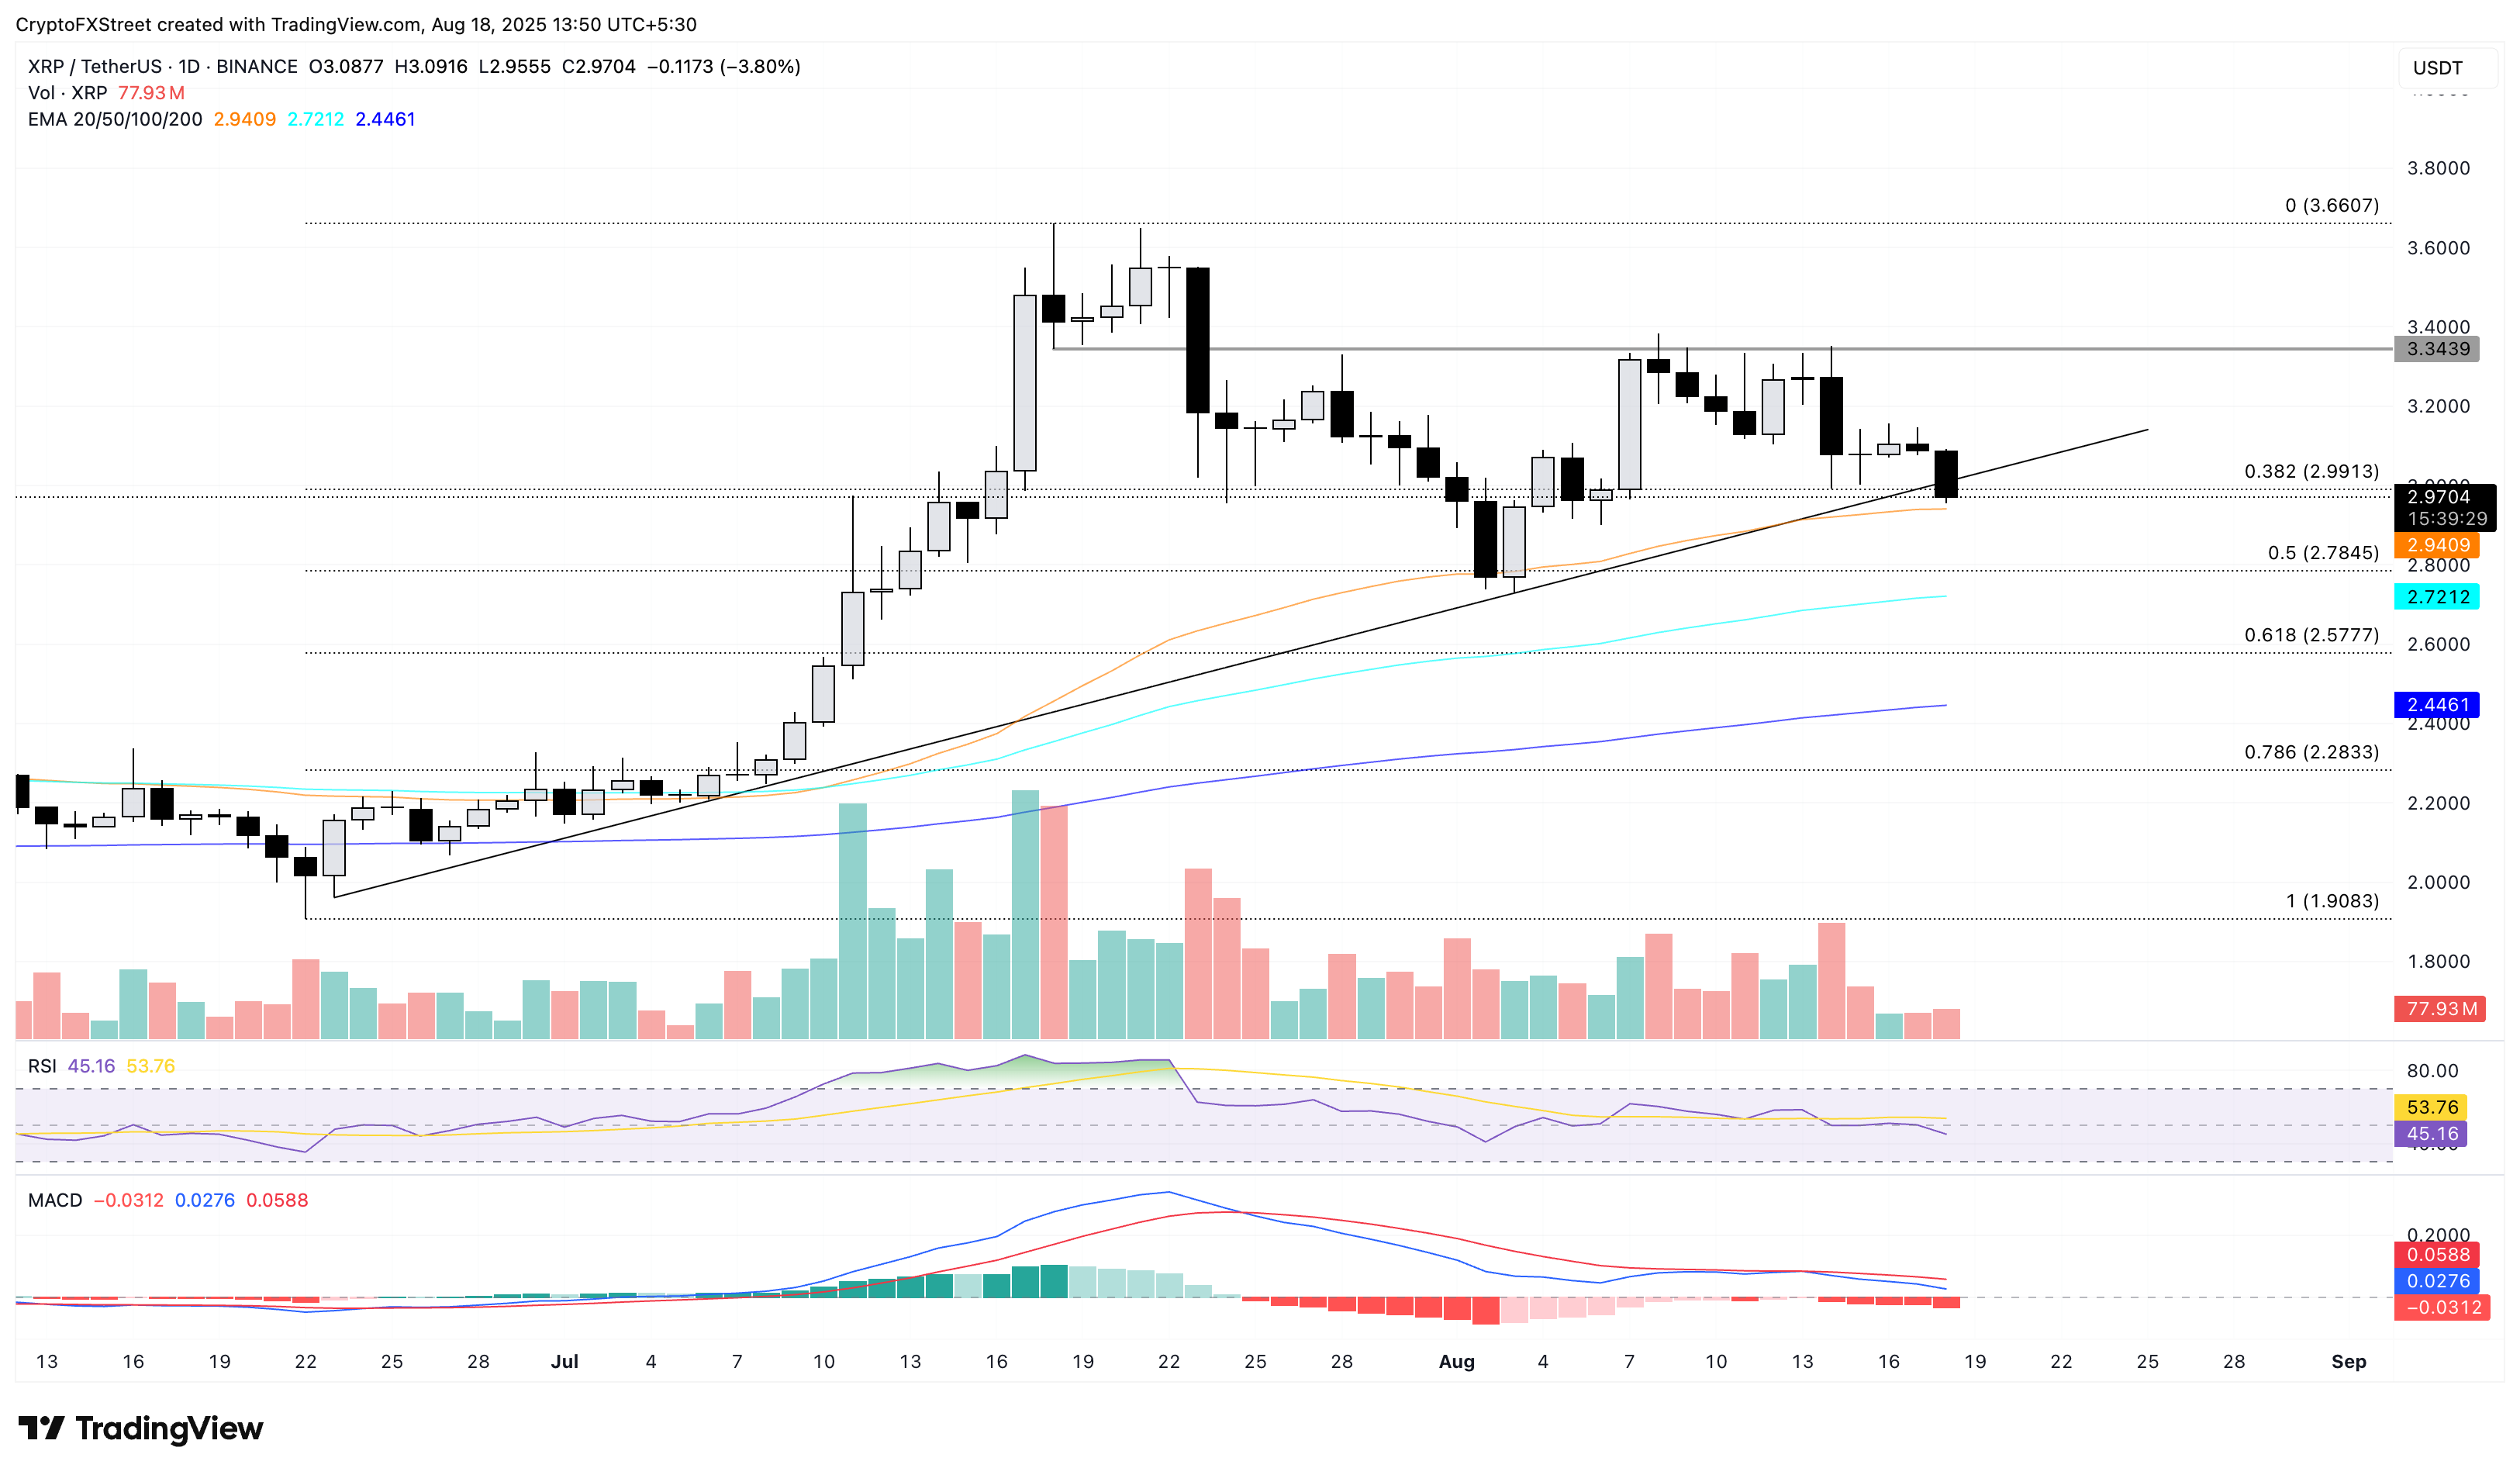
XRP/USDT daily price chart.
Conversely, if XRP can hold above the support trendline at $3.00, a recovery could retest the $3.34 resistance, last tested on Thursday.
Bitcoin, altcoins, stablecoins FAQs
Bitcoin, the leading cryptocurrency by market cap, is a digital form of currency designed for use as money. Its decentralized nature means no single entity controls it, eliminating the need for intermediaries in financial transactions.
Altcoins encompass any cryptocurrency other than Bitcoin, though some consider Ethereum distinct due to its role as a foundational cryptocurrency. Litecoin, for example, represents an early altcoin, forked from the Bitcoin protocol with the aim of offering an “improved” version.
Stablecoins are designed to maintain price stability by being pegged to a reserve asset like the US Dollar (USD). Algorithms or market demand regulate their supply, offering investors an entry and exit point for the broader cryptocurrency market, along with a means to store value without being subject to high volatility.
Bitcoin dominance reflects the ratio of Bitcoin’s market capitalization compared to the total market cap of all cryptocurrencies. It illustrates investor interest in Bitcoin. Higher dominance usually occurs leading up to or during bull markets as investors favour more stable and larger cryptocurrencies. Decreasing dominance may indicate investors moving capital into altcoins in search of higher returns, which often fuels significant altcoin rallies.
Disclaimer: Provided for informational purposes only. Past performance does not guarantee future outcomes.