

Key Points to Consider
Market data indicates that sellers are currently exerting more influence. Key Bitcoin price levels to watch are $113,985 as a potential support and $117,523 as a potential resistance.
Given the market’s current uncertainty, forecasts regarding Bitcoin’s (BTC) future price are a hot topic, especially as the price struggles against downward pressure.
This downward trend began with the appearance of bearish chart formations, coupled with investors securing profits after Bitcoin reached a recent peak.
Seller Dominance Evident
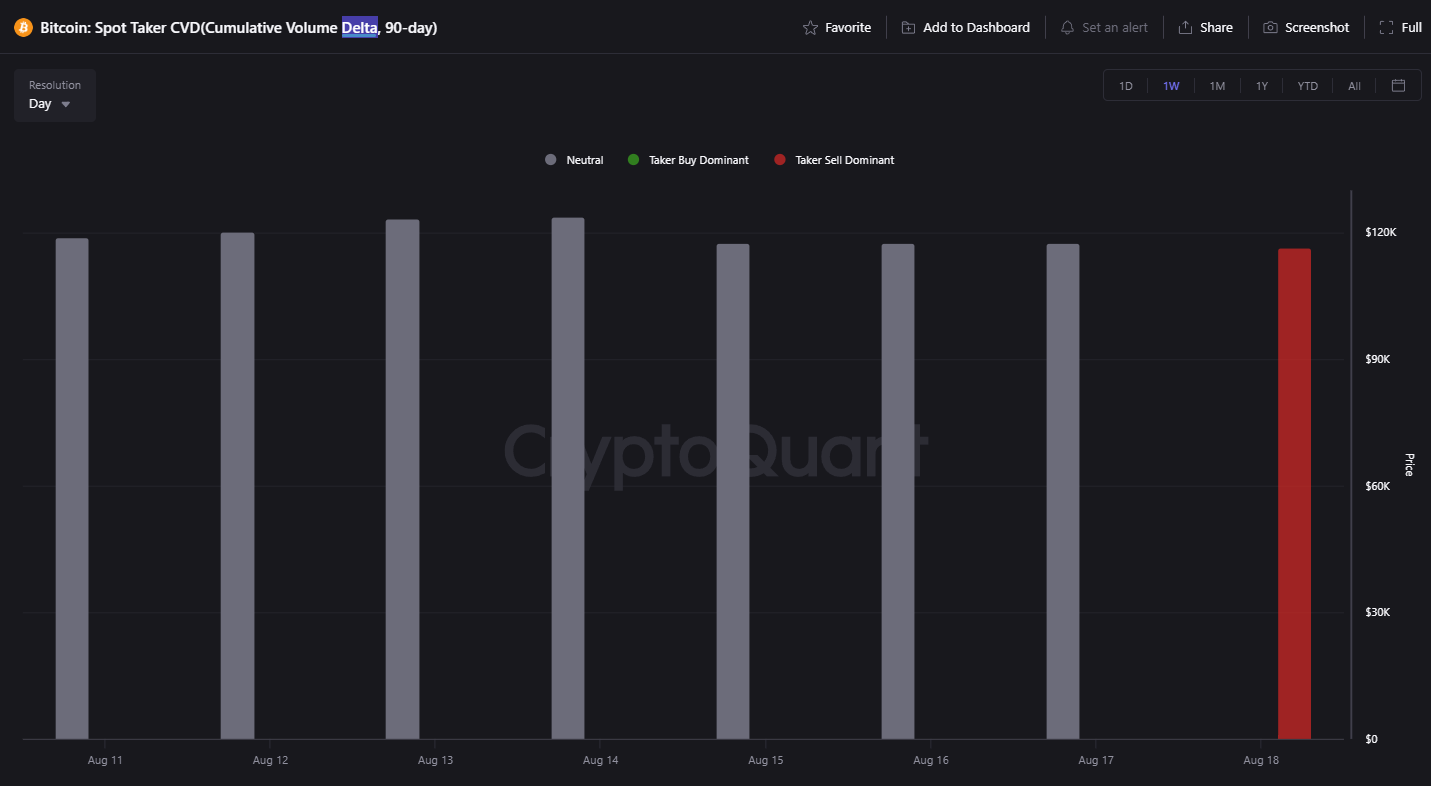
The ongoing trend of profit-taking and indications of continued price weakness are supported by the Spot Taker Cumulative Volume Delta (CVD) metric.
Data from CryptoQuant’s Spot Taker CVD shows that sellers are dominating trading activity, suggesting considerable downward forces at play.
The latest red bar visible on the Spot Taker CVD chart points to substantial sell orders, representing significant selling pressure. Historically, such patterns have often preceded notable price declines.
Reflecting the current market atmosphere, a prominent crypto community shared a warning on social media:
“Exercise caution regarding Bitcoin’s upcoming monthly close.”
They cautioned that if Bitcoin’s monthly chart displays a bearish pin bar candlestick pattern, this could trigger a substantial downward price move.
Current Market Performance
As of the latest update, Bitcoin is trading at $115,076, reflecting a 0.65% decrease over the last day. It has also experienced a 7.35% drop over the previous five trading days and a 2.35% decline over the past week.
This consistent price decrease appears to be impacting participation from both traders and investors, as Bitcoin’s trading volume has dropped by 10% compared to the day before.
Technical Outlook for Bitcoin
According to technical analysis, the short-term outlook for Bitcoin appears bearish, with the possibility of a continued downward trajectory.
The daily chart already shows the formation of a bearish divergence, which has been followed by a 7.3% price decline.
Adding to the bearish signals, Bitcoin has formed a notable bearish engulfing pattern on its candlestick chart, reinforcing the negative outlook.
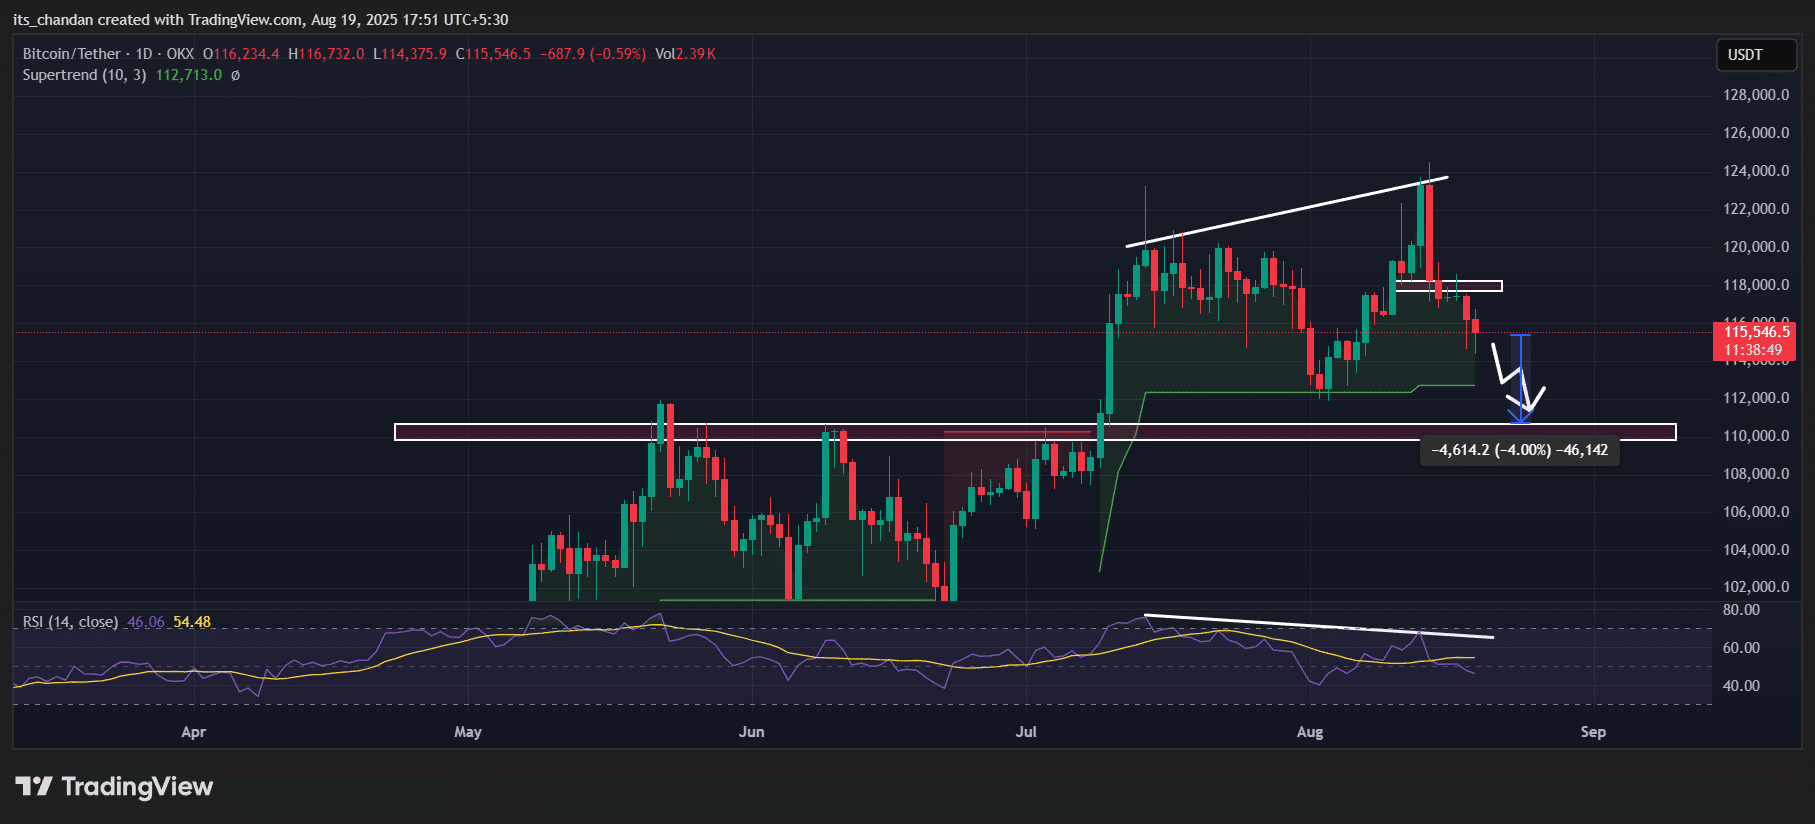
Source: TradingView
Due to recent price behavior and established patterns, this pessimistic view has led to a more negative prediction for Bitcoin’s price, potentially leading to a 4% decrease.
Should this decline materialize, the price could potentially fall to $110,750 or even further.
Currently, the Supertrend indicator is still displaying a green signal and remains positioned below Bitcoin’s price, which implies that the asset is in an uptrend, with buyers holding the upper hand.
Bitcoin On-Chain Data
Considering the current market environment, data suggests that investors and long-term holders are potentially accumulating Bitcoin.
CoinGlass’s data on Bitcoin exchange flows reveals net outflows of $39.95 million in BTC. This indicates possible accumulation, which could lessen selling pressure.
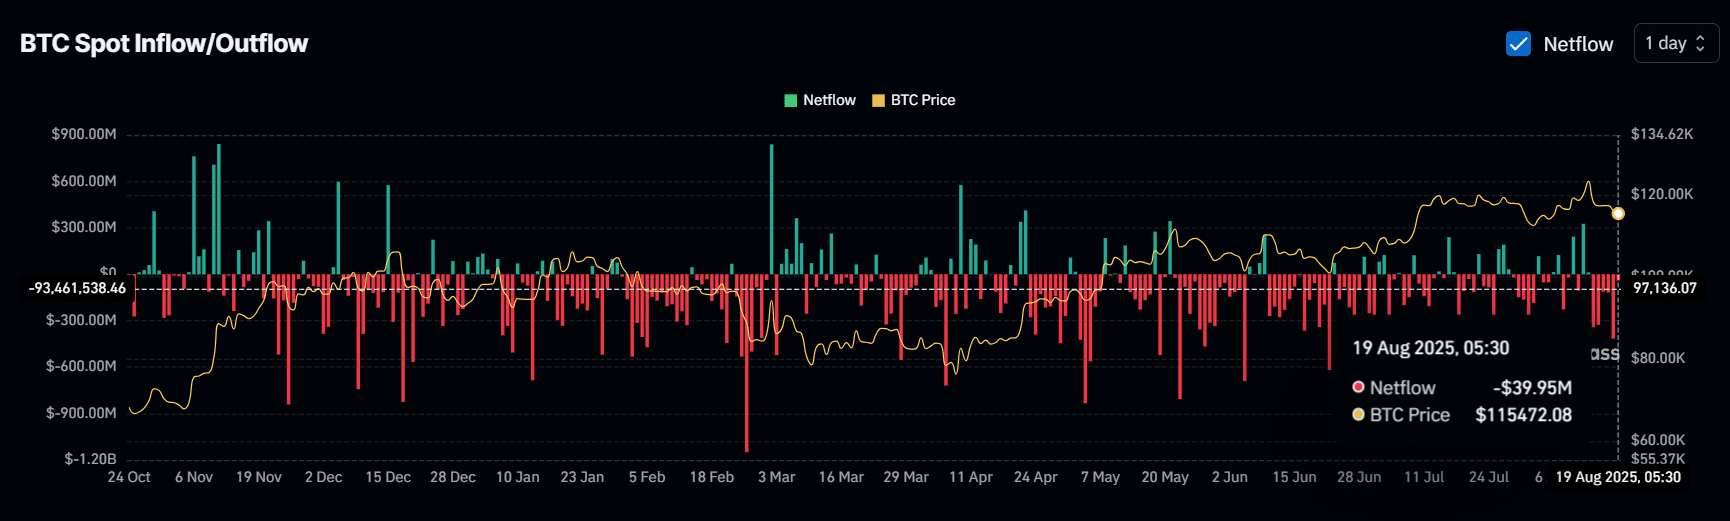
Source: CoinGlass
Furthermore, significant liquidation thresholds for Bitcoin are located at $113,985 on the downside and $117,523 on the upside, indicating levels where traders might be employing excessive leverage.