

Key Highlights
Increased activity on the BNB network, with active addresses jumping 6.7%, and substantial inflows of $20 million are fueling demand. While derivatives market indicators suggest bullishness, technical charts point to the $850-$855 range as a crucial support level before a potential surge toward new all-time highs.
Despite a monthly surge of 13.04%, BNB experienced a slight pullback, declining by 2.02% to trade at $862 over the last day.
Market analysis indicates that heightened participation, evidenced by the increase in active addresses, corresponds with growing investor interest and consistent capital influx. The question now is whether this upward momentum can propel BNB to break previous records.
Positive Signs: Activity and Trading Volume
Data from Nansen reveals that the BNB Chain is currently leading all EVM chains in terms of active addresses as of last week.
The number of active addresses on the BNB Chain has reached 10.8 million, showing a significant increase of 6.7% week-over-week. This puts BNB ahead of Base, which has 6.7 million active addresses, and Ethereum, which trails with 2.7 million within the same timeframe.
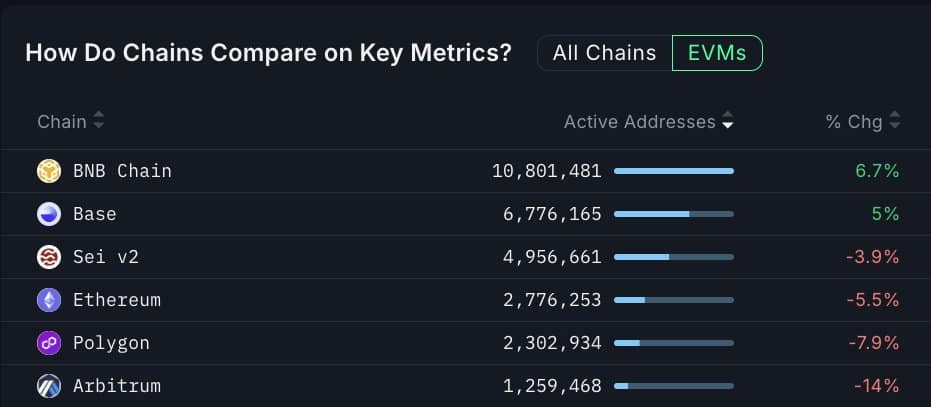
Source: Nansen
This increased activity has directly impacted trading volumes. BNB Chain recorded a daily trading volume of $1.988 billion. Over the last 30 days, its volume totals $58 billion, according to DeFiLlama.
The positive on-chain metrics are also influencing other facets of the crypto market.
Liquidity Boosts Price Momentum
Increased activity also impacts liquidity.
In the last two days, around $20 million worth of BNB has been moved from cryptocurrency exchanges to private digital wallets by investors.
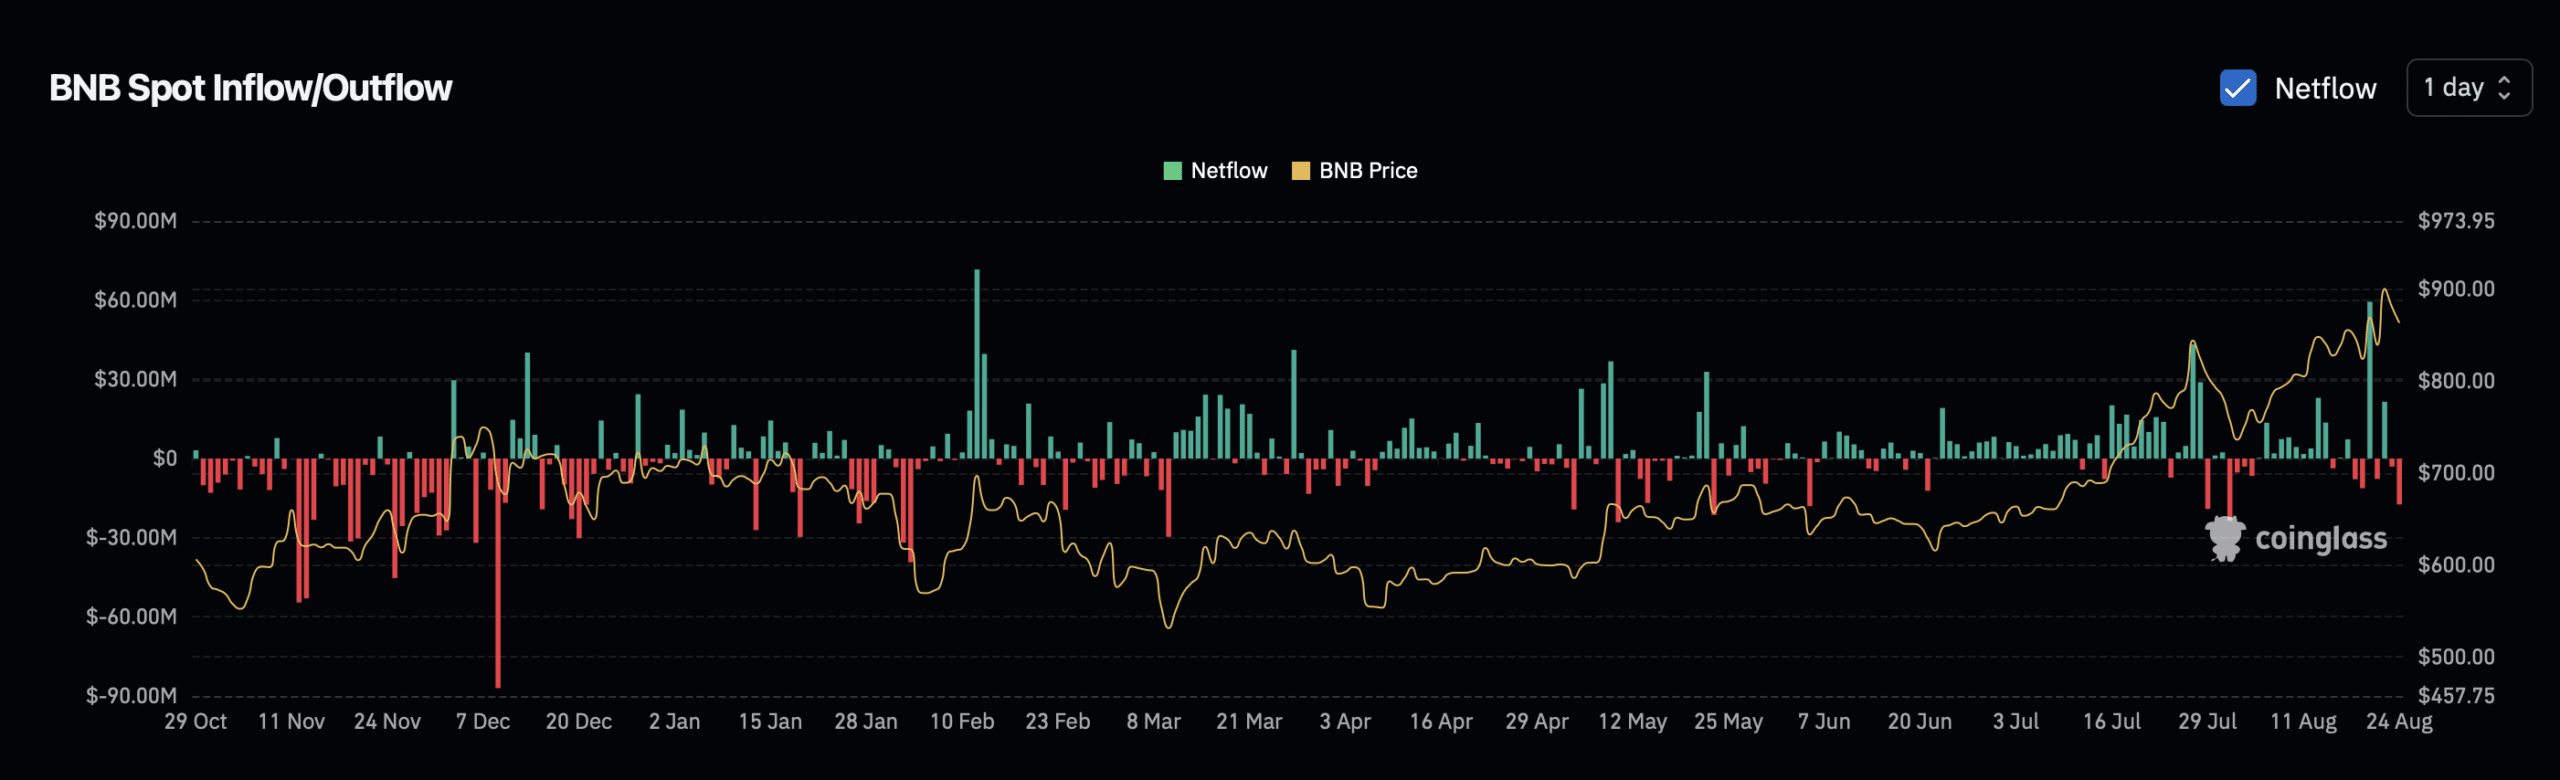
Source: CoinGlass
Traders in the derivatives market are also contributing to the positive trend.
The Open Interest Weighted Funding Rate remains positive at 0.0099%.
This data point suggests a predominantly bullish outlook, with long traders compensating short traders, demonstrating that the market is leaning towards long positions.
The impact of these converging positive trends on BNB’s price in various markets is under assessment through short-term technical analysis.
A Push Towards New Highs Remains Possible
Technical analysis of chart patterns suggests a potential near-term retracement for BNB before it attempts to reach new peak values, despite the currently positive indicators.
Initial support can be found within the $850 to $855 range. A drop into this area could serve as a launchpad for another rally and potentially establish a new record price.
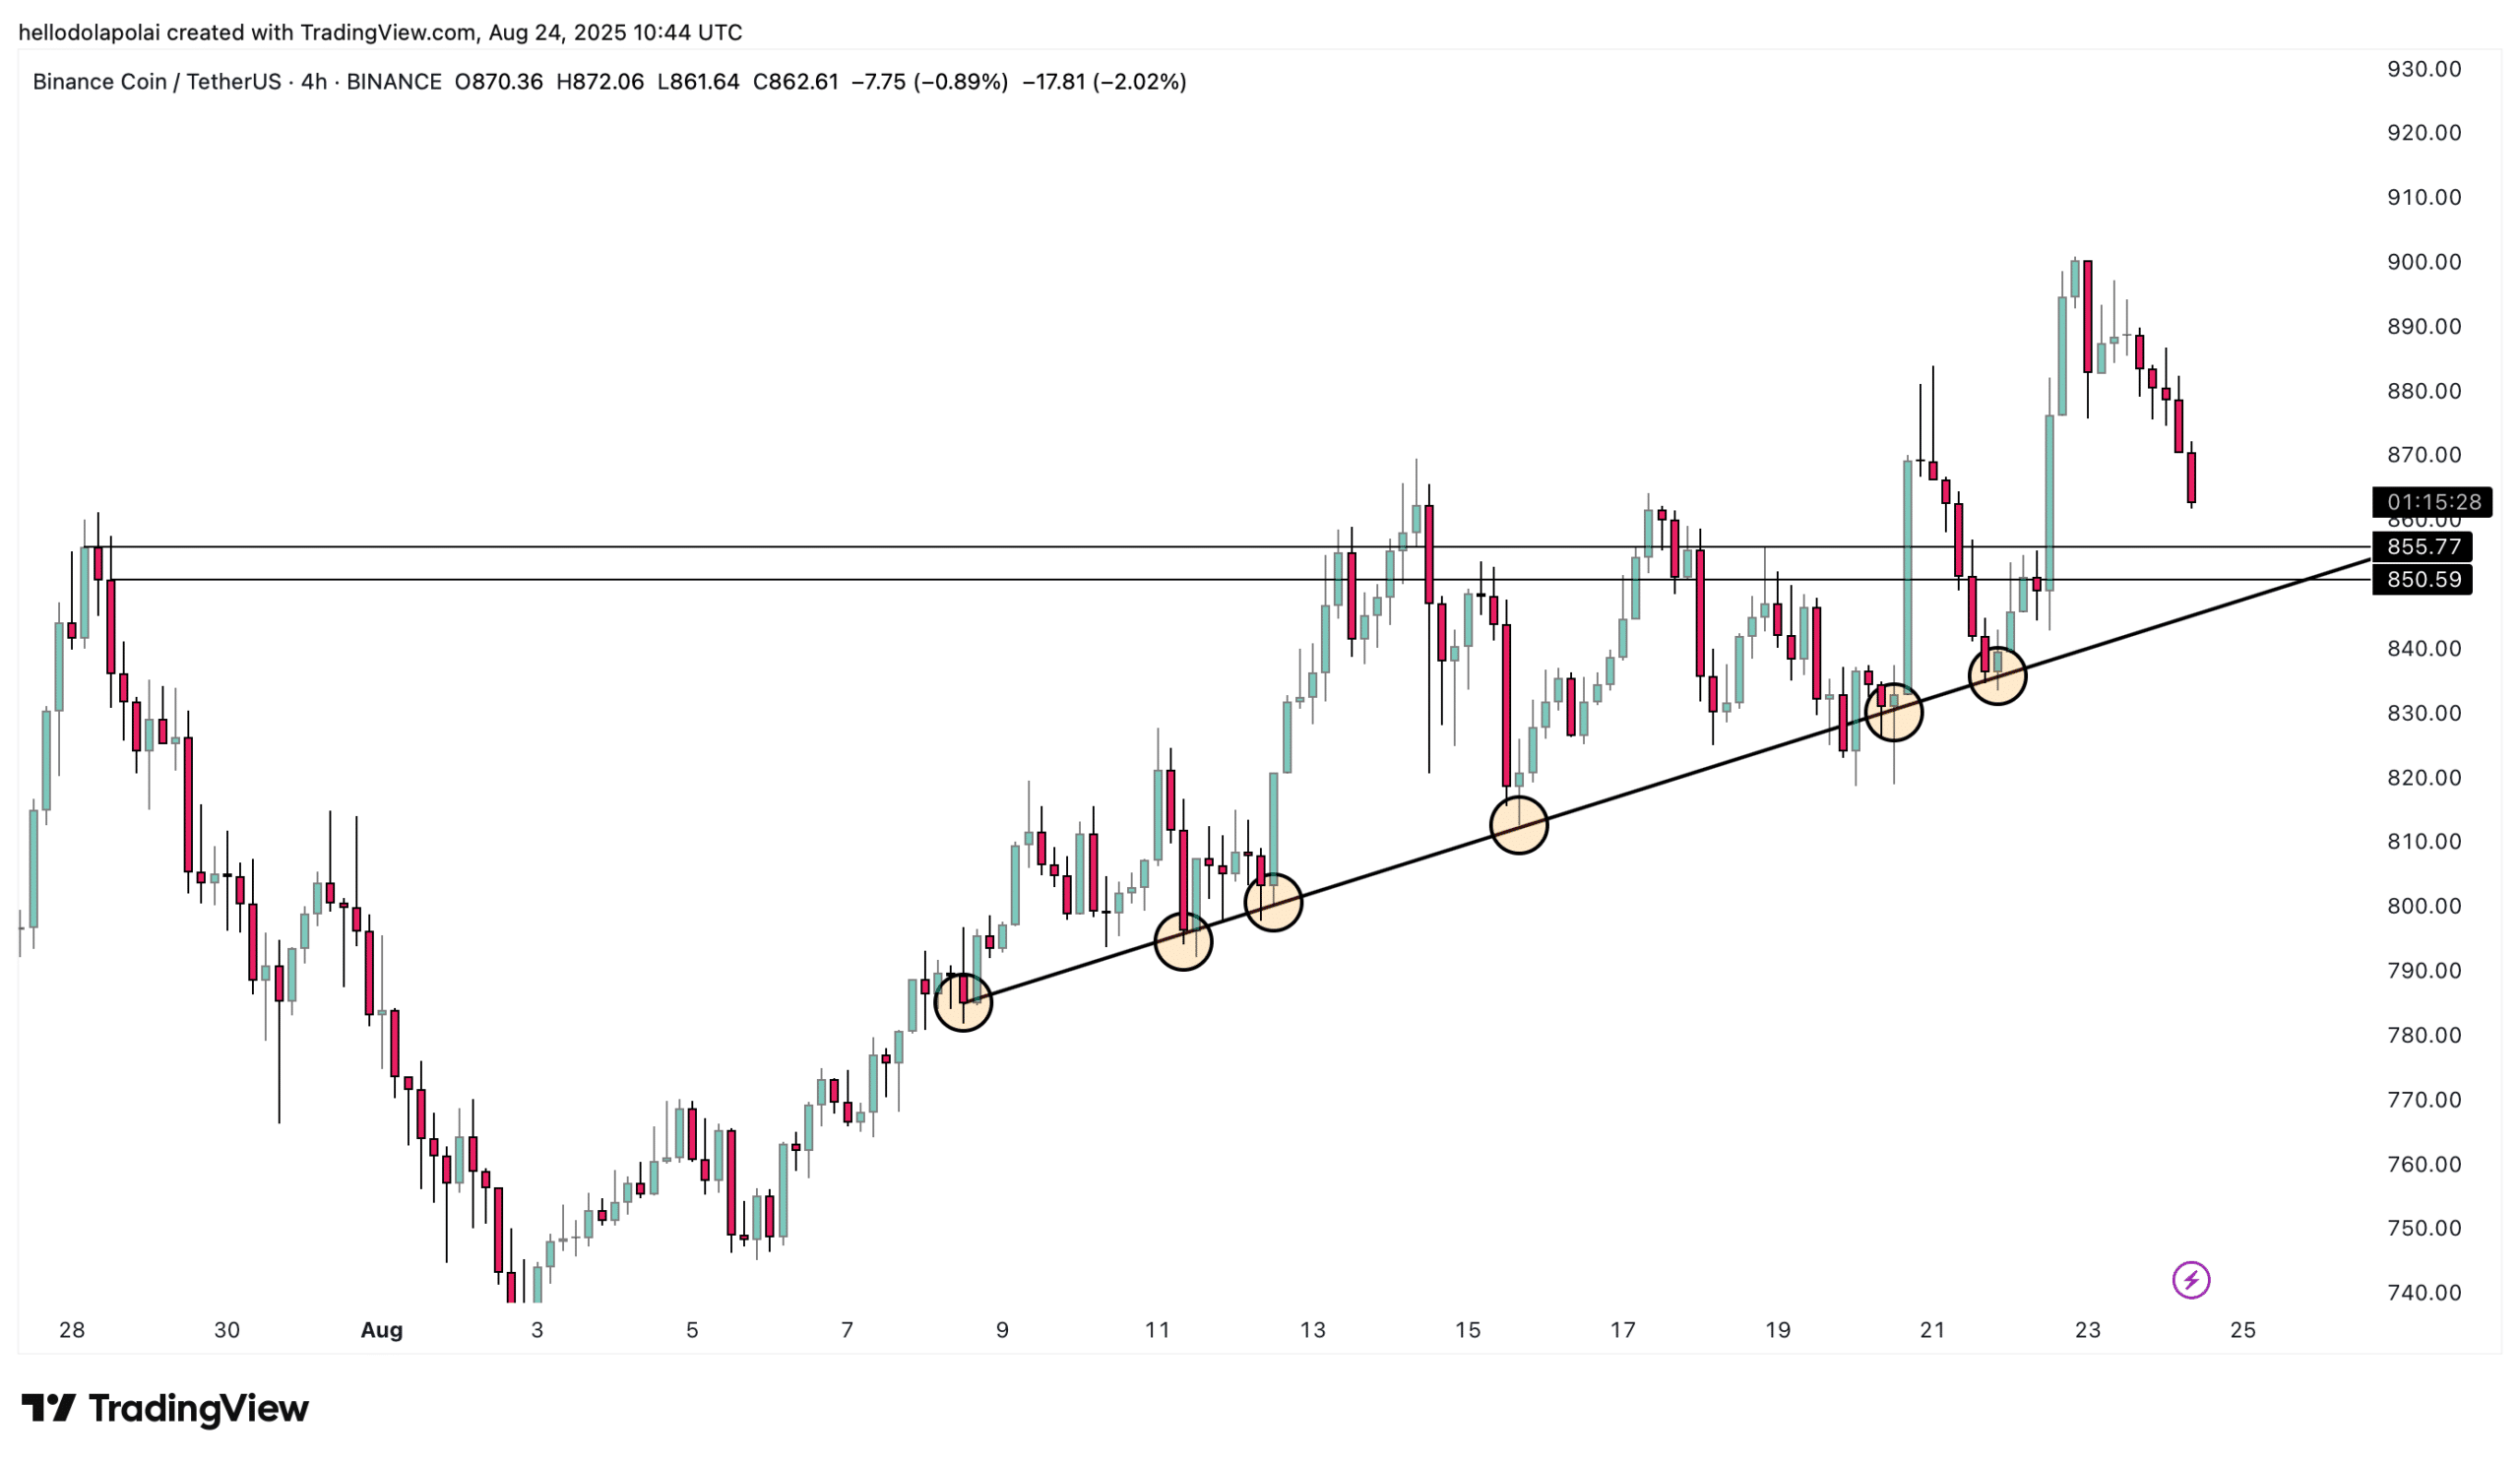
Source: Trading View
However, if buying interest weakens, BNB could fall back to the ascending support line that has historically triggered upward price movements. As it stands, the chart currently suggests a likely scenario of a decline followed by a recovery.