

Ether (ETH) achieved a new milestone on Sunday, exceeding $4,900 on the Coinbase exchange at 5:40 p.m. UTC. This surpasses its previous high of $4,867, recorded on November 8, 2021.
A review of the ETH-USD price chart on TradingView spanning five years reveals a definitive, long-term breakout. After a considerable period of consolidation, ETH has successfully broken through its 2021 peak, entering a phase where no prior price ceilings exist.
Market observers refer to this situation as “price discovery.” In this stage, the market establishes new record highs, guided primarily by market sentiment and order flow, rather than relying on established resistance levels from past charts.
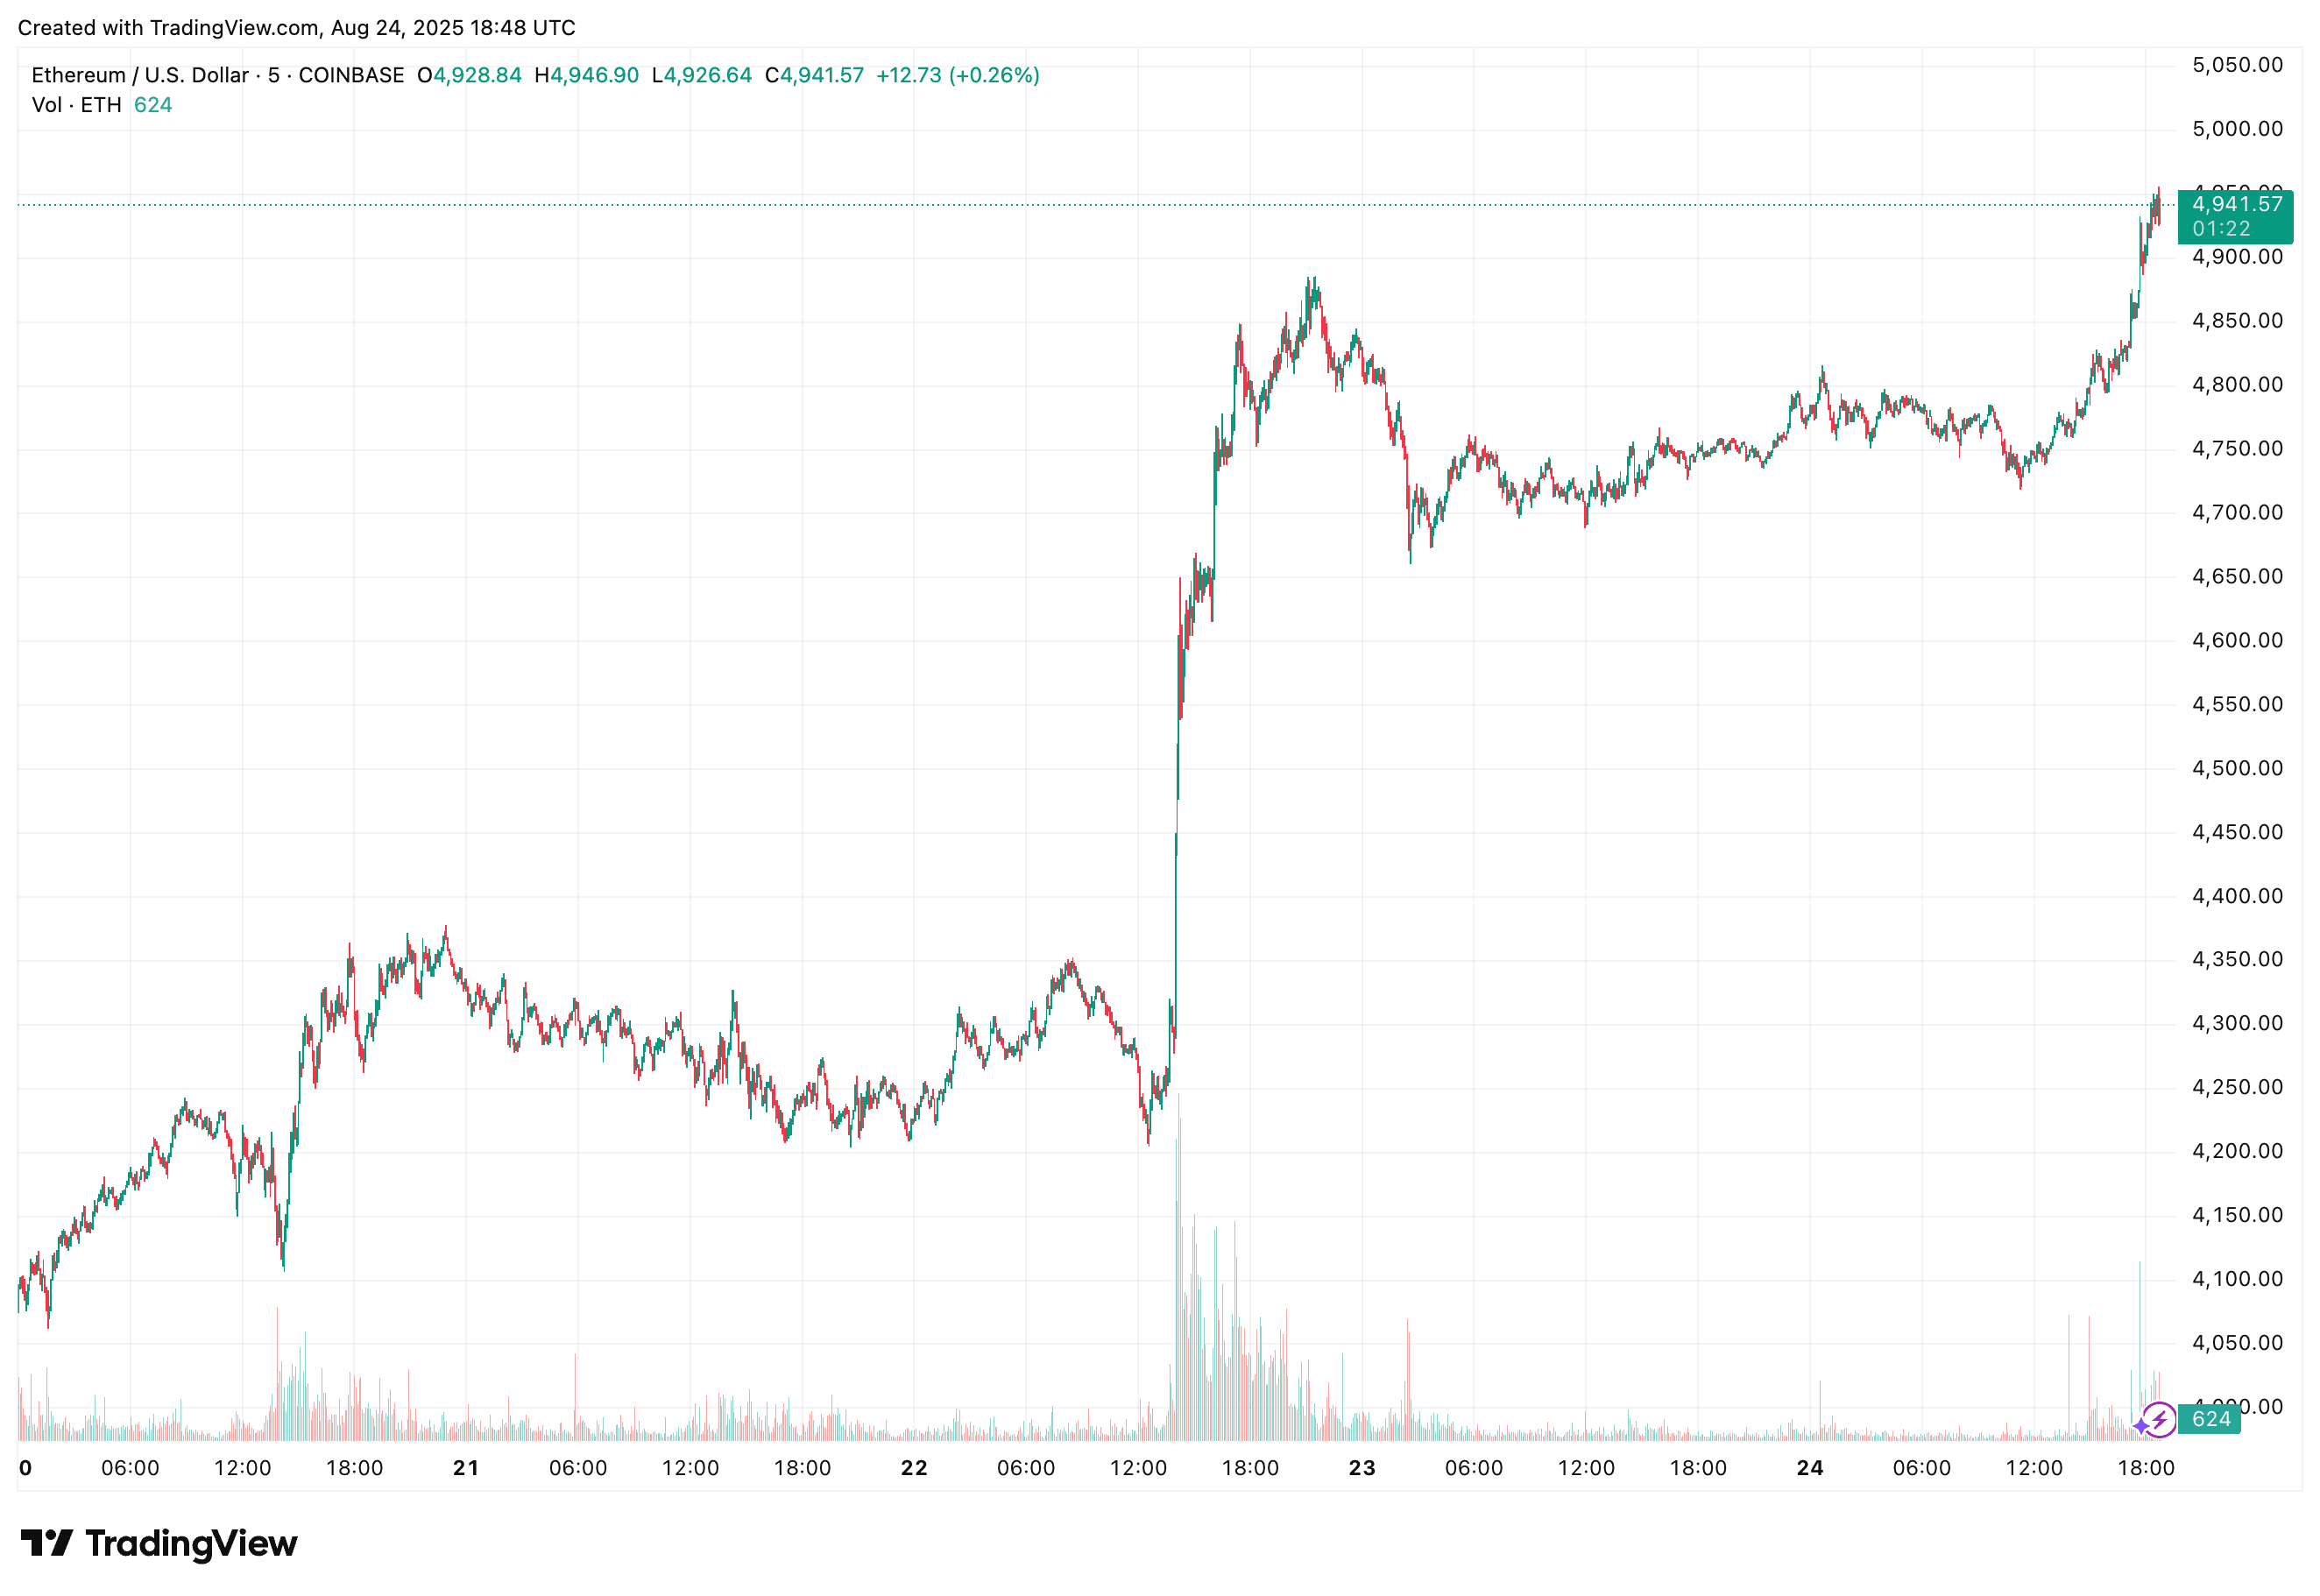
Examining the recent 5-day performance, following a rapid ascent from the mid-$4,700 range, Ether surpassed $4,900, reaching an intraday high of approximately $4,946.90. As of 6:48 p.m. UTC, the latest recorded price stood near $4,941.57. This sequence indicates that buyers absorbed existing supply around the former resistance level and subsequently propelled the price to a new peak, illustrating a typical breakout pattern.
Analyst Miles Deutsher remarked on the shifting market dynamics, stating “BTC is exhausted, ETH isn’t.” Essentially, he’s highlighting that while Bitcoin’s upward momentum has slowed near recent peaks, Ether is experiencing a breakout and entering unchartered territory.
The expression “exhausted” in market terms usually signifies diminishing upward momentum, weak follow-through, and resistance from sellers at higher price points. Conversely, “isn’t” suggests robust momentum, continued fresh highs, and proactive buying during price dips. Traders commonly shift their focus towards assets exhibiting greater relative strength when a previous leading asset shows signs of fatigue.
Crypto Rover emphasized the available supply on exchanges. “Exchange reserves” refers to the quantity of cryptocurrency held within wallets managed by centralized trading platforms.
A declining trend in these reserves implies a reduction in the number of coins readily available for sale. If demand increases concurrently with this thinning of liquid supply, prices can rise rapidly because buyers must offer higher bids to entice coins back into circulation from off-exchange storage. This principle underlies the concept of a “supply shock.” While not guaranteeing immediate price increases, this situation establishes a favorable environment where scarcity can amplify price movements once momentum picks up.
Michaël van de Poppe cautioned about potential risks. He noted the unusually large weekly price movement and warned that weekend breakouts often face retracements when market liquidity returns to normal levels at the beginning of the week.
The underlying idea is that weekend trading activity can be characterized by thinner order books, potentially leading to amplified price movements. With increased participation returning on Monday, prices might retest the breakout area to confirm its strength as a support level before resuming any upward trend. In practice, a temporary pullback towards the breakout zone shouldn’t necessarily invalidate the larger bullish trend indicated in the 5-year chart.