

Recent observations of blockchain data reveal a widespread shift towards selling among all groups of Bitcoin investors, hinting at a possible change in the prevailing market sentiment.
Bitcoin Accumulation Trend Score Indicates Selling Across All Investor Segments
According to a recent report shared on X, Glassnode, an on-chain analytics provider, highlighted a new trend based on the Bitcoin Accumulation Trend Score across different investor categories. This score evaluates the degree to which Bitcoin holders are either accumulating or distributing their holdings.
The Accumulation Trend Score is derived from two key factors: changes in the balances held by investor wallets and the size of these wallets. This weighting means that larger entities have a greater influence on the overall score.
Below is a visual representation provided by Glassnode showing the Bitcoin Accumulation Trend Score over the past year, segmented by holder groups:
As seen in the chart above, the Bitcoin Accumulation Trend Score for all investor segments was above 0.5 back in July, suggesting a net accumulation pattern across these groups.
Specifically, retail investors (those holding under 1 BTC), whales (holding between 1,000 and 10,000 BTC), and mega-whales (holding over 10,000 BTC) even saw the score approach 1 at one point, indicating a strong accumulation phase.
Earlier this month, signs of weakening buying pressure appeared, and now, investor behavior has reversed, with most groups engaging in distribution. Smaller whales, with holdings of 10 to 100 BTC, are currently leading the selling activity, reflected by an Accumulation Trend Score approaching zero.
“This uniformity across different investor groups suggests increasing selling pressure is influencing the market,” the analytics firm stated. The chart shows the last instance of such a pattern occurred in January, after which Bitcoin experienced a bearish phase.
Therefore, it remains to be seen if this recent shift to distribution will trigger a similar downturn. Another potentially bearish signal could be Bitcoin’s retesting of the Realized Price for investors who have held their coins for 1 to 3 months, as detailed by Glassnode in another X post.
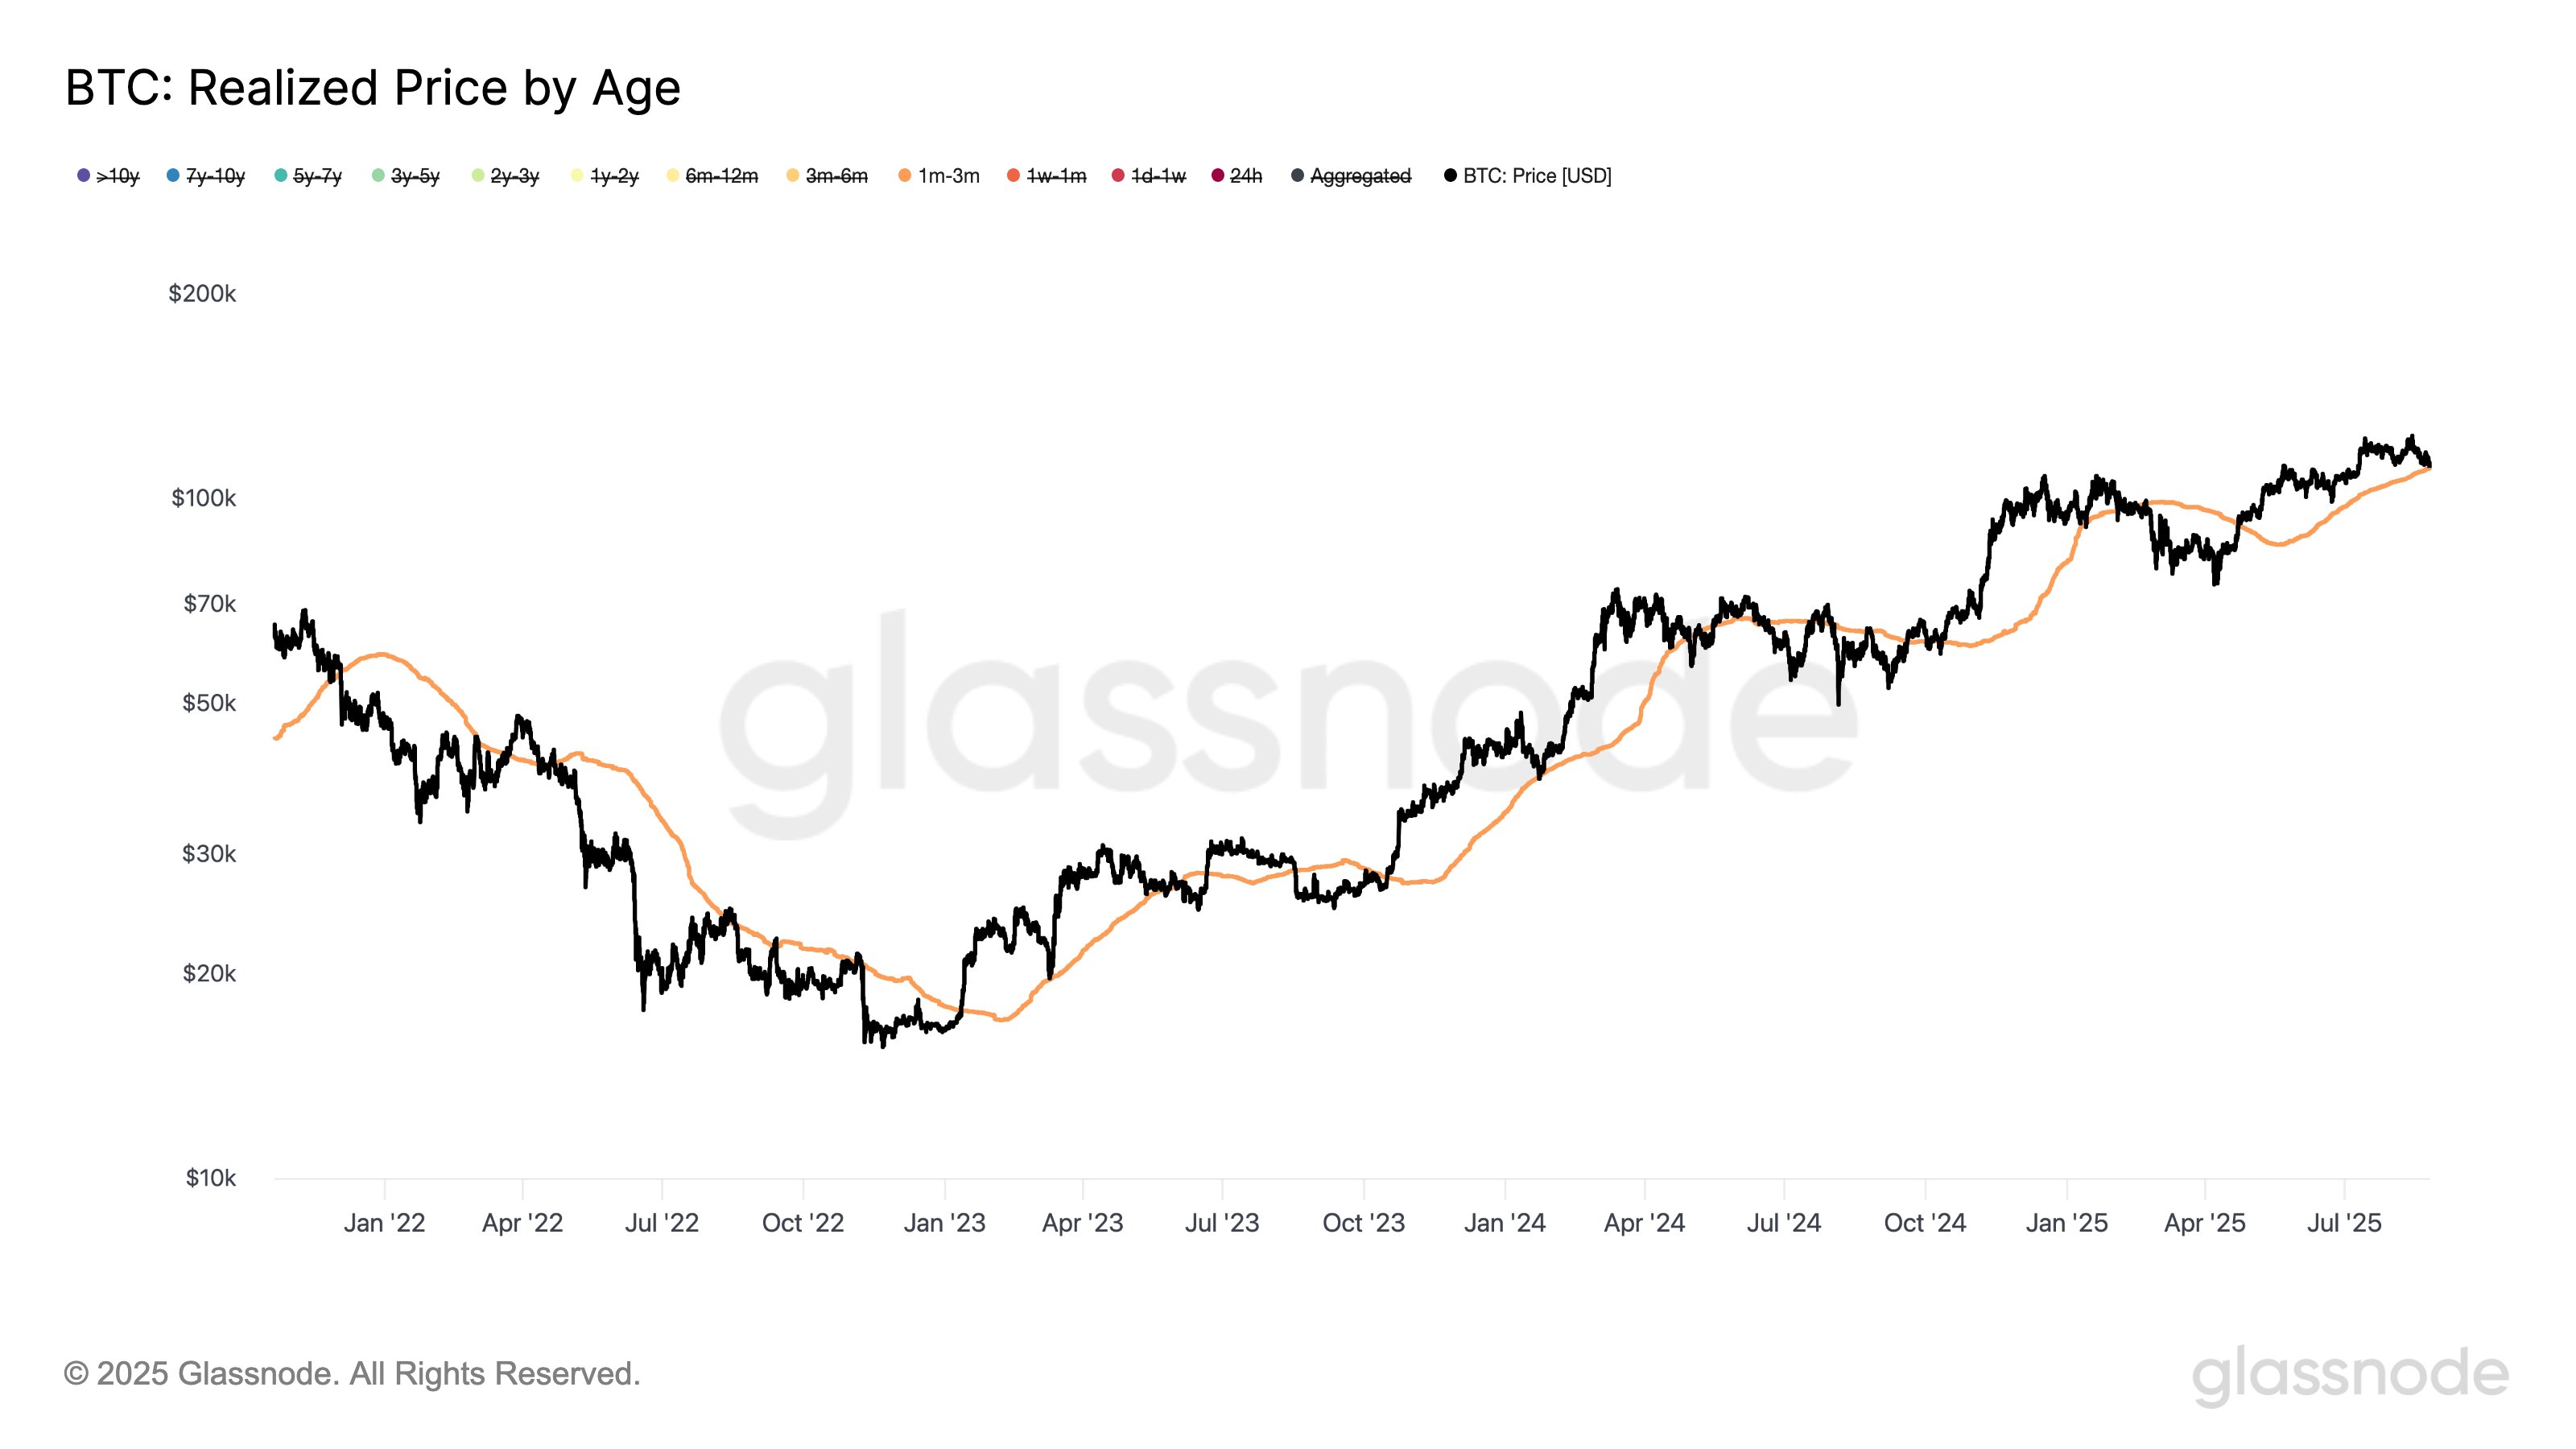
The Realized Price represents the average acquisition cost for Bitcoin investors. The displayed metric specifically tracks this value for holders who acquired their Bitcoin within the past one to three months.
Currently, the metric is hovering around $110,800, aligning with Bitcoin’s trading range following its recent decline. According to the analytics firm, “Historically, failing to maintain support above this level has frequently preceded periods of market weakness extending over several months, potentially leading to more significant corrections.”
BTC Price
As of this writing, Bitcoin’s price is around $109,900, reflecting a decrease of over 5% during the past week.