

Essential Points to Consider
Charts analyzing Cardano indicated a potential short-term increase in buying activity, based on the volume of buy versus sell orders. However, analysts warn this could be a misleading signal. Looking at the broader picture, the trend remains positive, but the price points of $0.822 and $1 are critical benchmarks for determining future direction.
Buyers of Cardano (ADA) have been actively defending the $0.846 immediate support level. Since July 8, when the price was around $0.572, the price of this altcoin has risen by about 51%. The overall sentiment in the cryptocurrency market is currently mixed, with significant price swings observed in recent weeks.
Bitcoin (BTC) is also hovering near its $112k support zone. It’s important to acknowledge the possibility of a drop towards the $100k level, a situation that could negatively affect Cardano’s price.
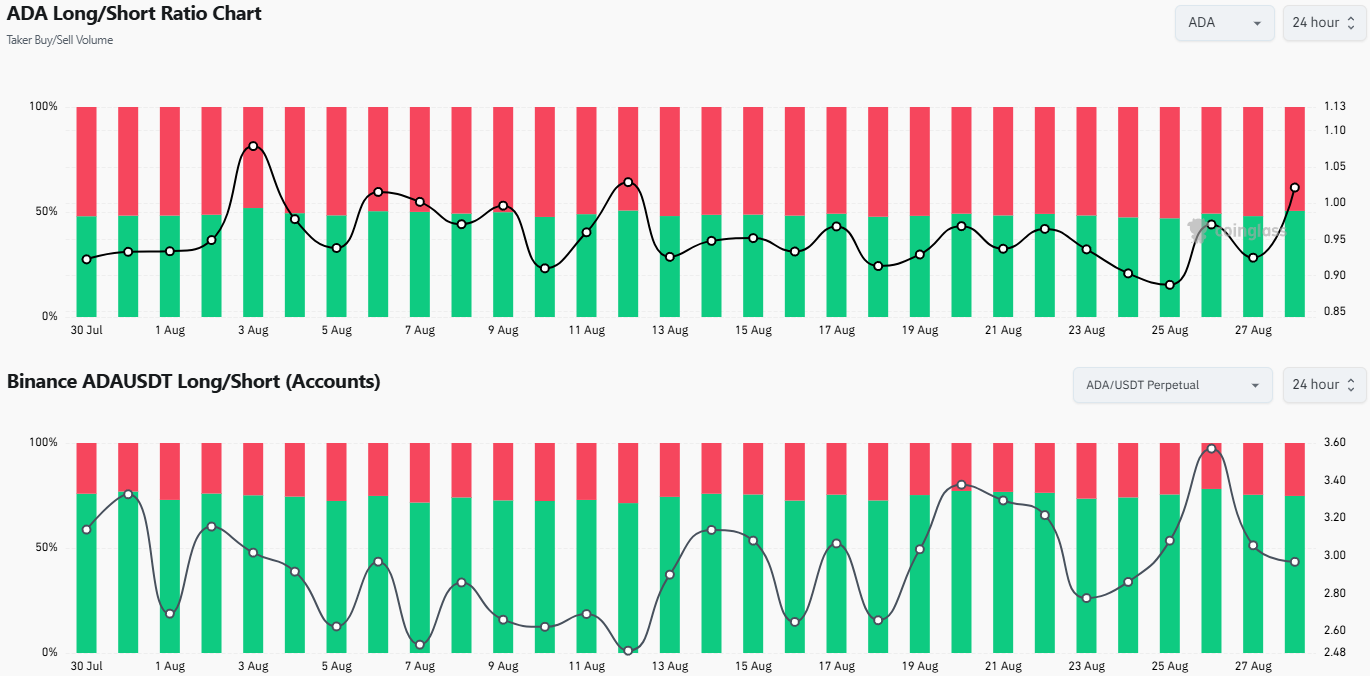
Source: Coinglass
Data from Coinglass shows a slight lean towards long positions in the ADA market. This indicates a modestly higher buying volume, hinting at a short-term positive outlook. However, further analysis is needed for a comprehensive understanding.
Analysis of long/short positions reveals that 74% of accounts are holding long positions. A similar trend can be observed among top traders on Binance, where 77% of positions are long. While these figures support a bullish short-term expectation, they also spark discussions about the possibility of a deceptive upward movement.
Cardano’s Potential Trajectory in the Near Future
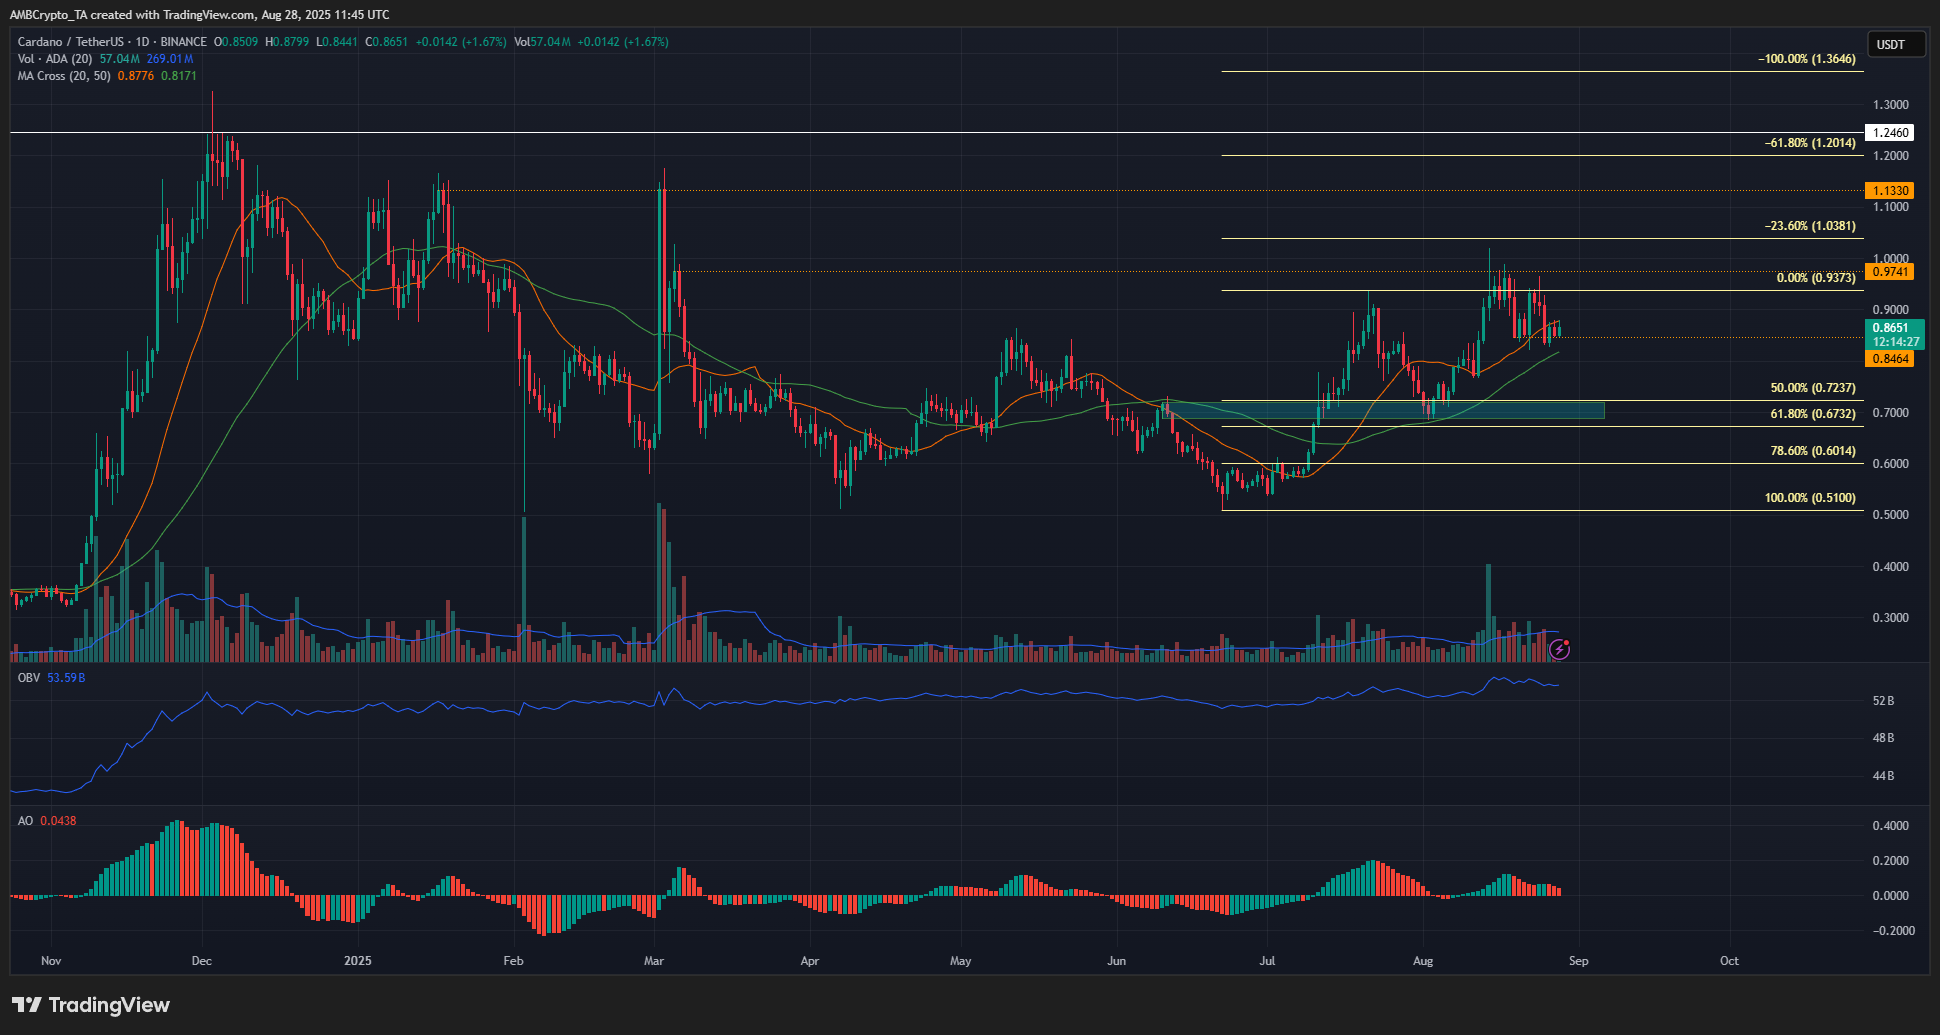
Source: ADA/USDT on TradingView
Determining whether the current trend is a true bull run or a temporary upswing depends significantly on Bitcoin’s price performance. Stepping back to observe a wider perspective, the daily chart for Cardano indicates that the positive market structure for this altcoin is still intact.
The Awesome Oscillator’s recent decline towards the zero line suggests a weakening momentum. However, the price hasn’t experienced a notable drop. A price decline below $0.822 would be needed to officially shift the daily structure to a negative outlook.
The On Balance Volume (OBV) has seen a slight decrease in the past two weeks. However, the selling activity isn’t strong enough to cause significant concern.
If the price surpasses $1, the subsequent resistance levels to watch are the $1.2 mark and the range between $1.36 and $1.4.
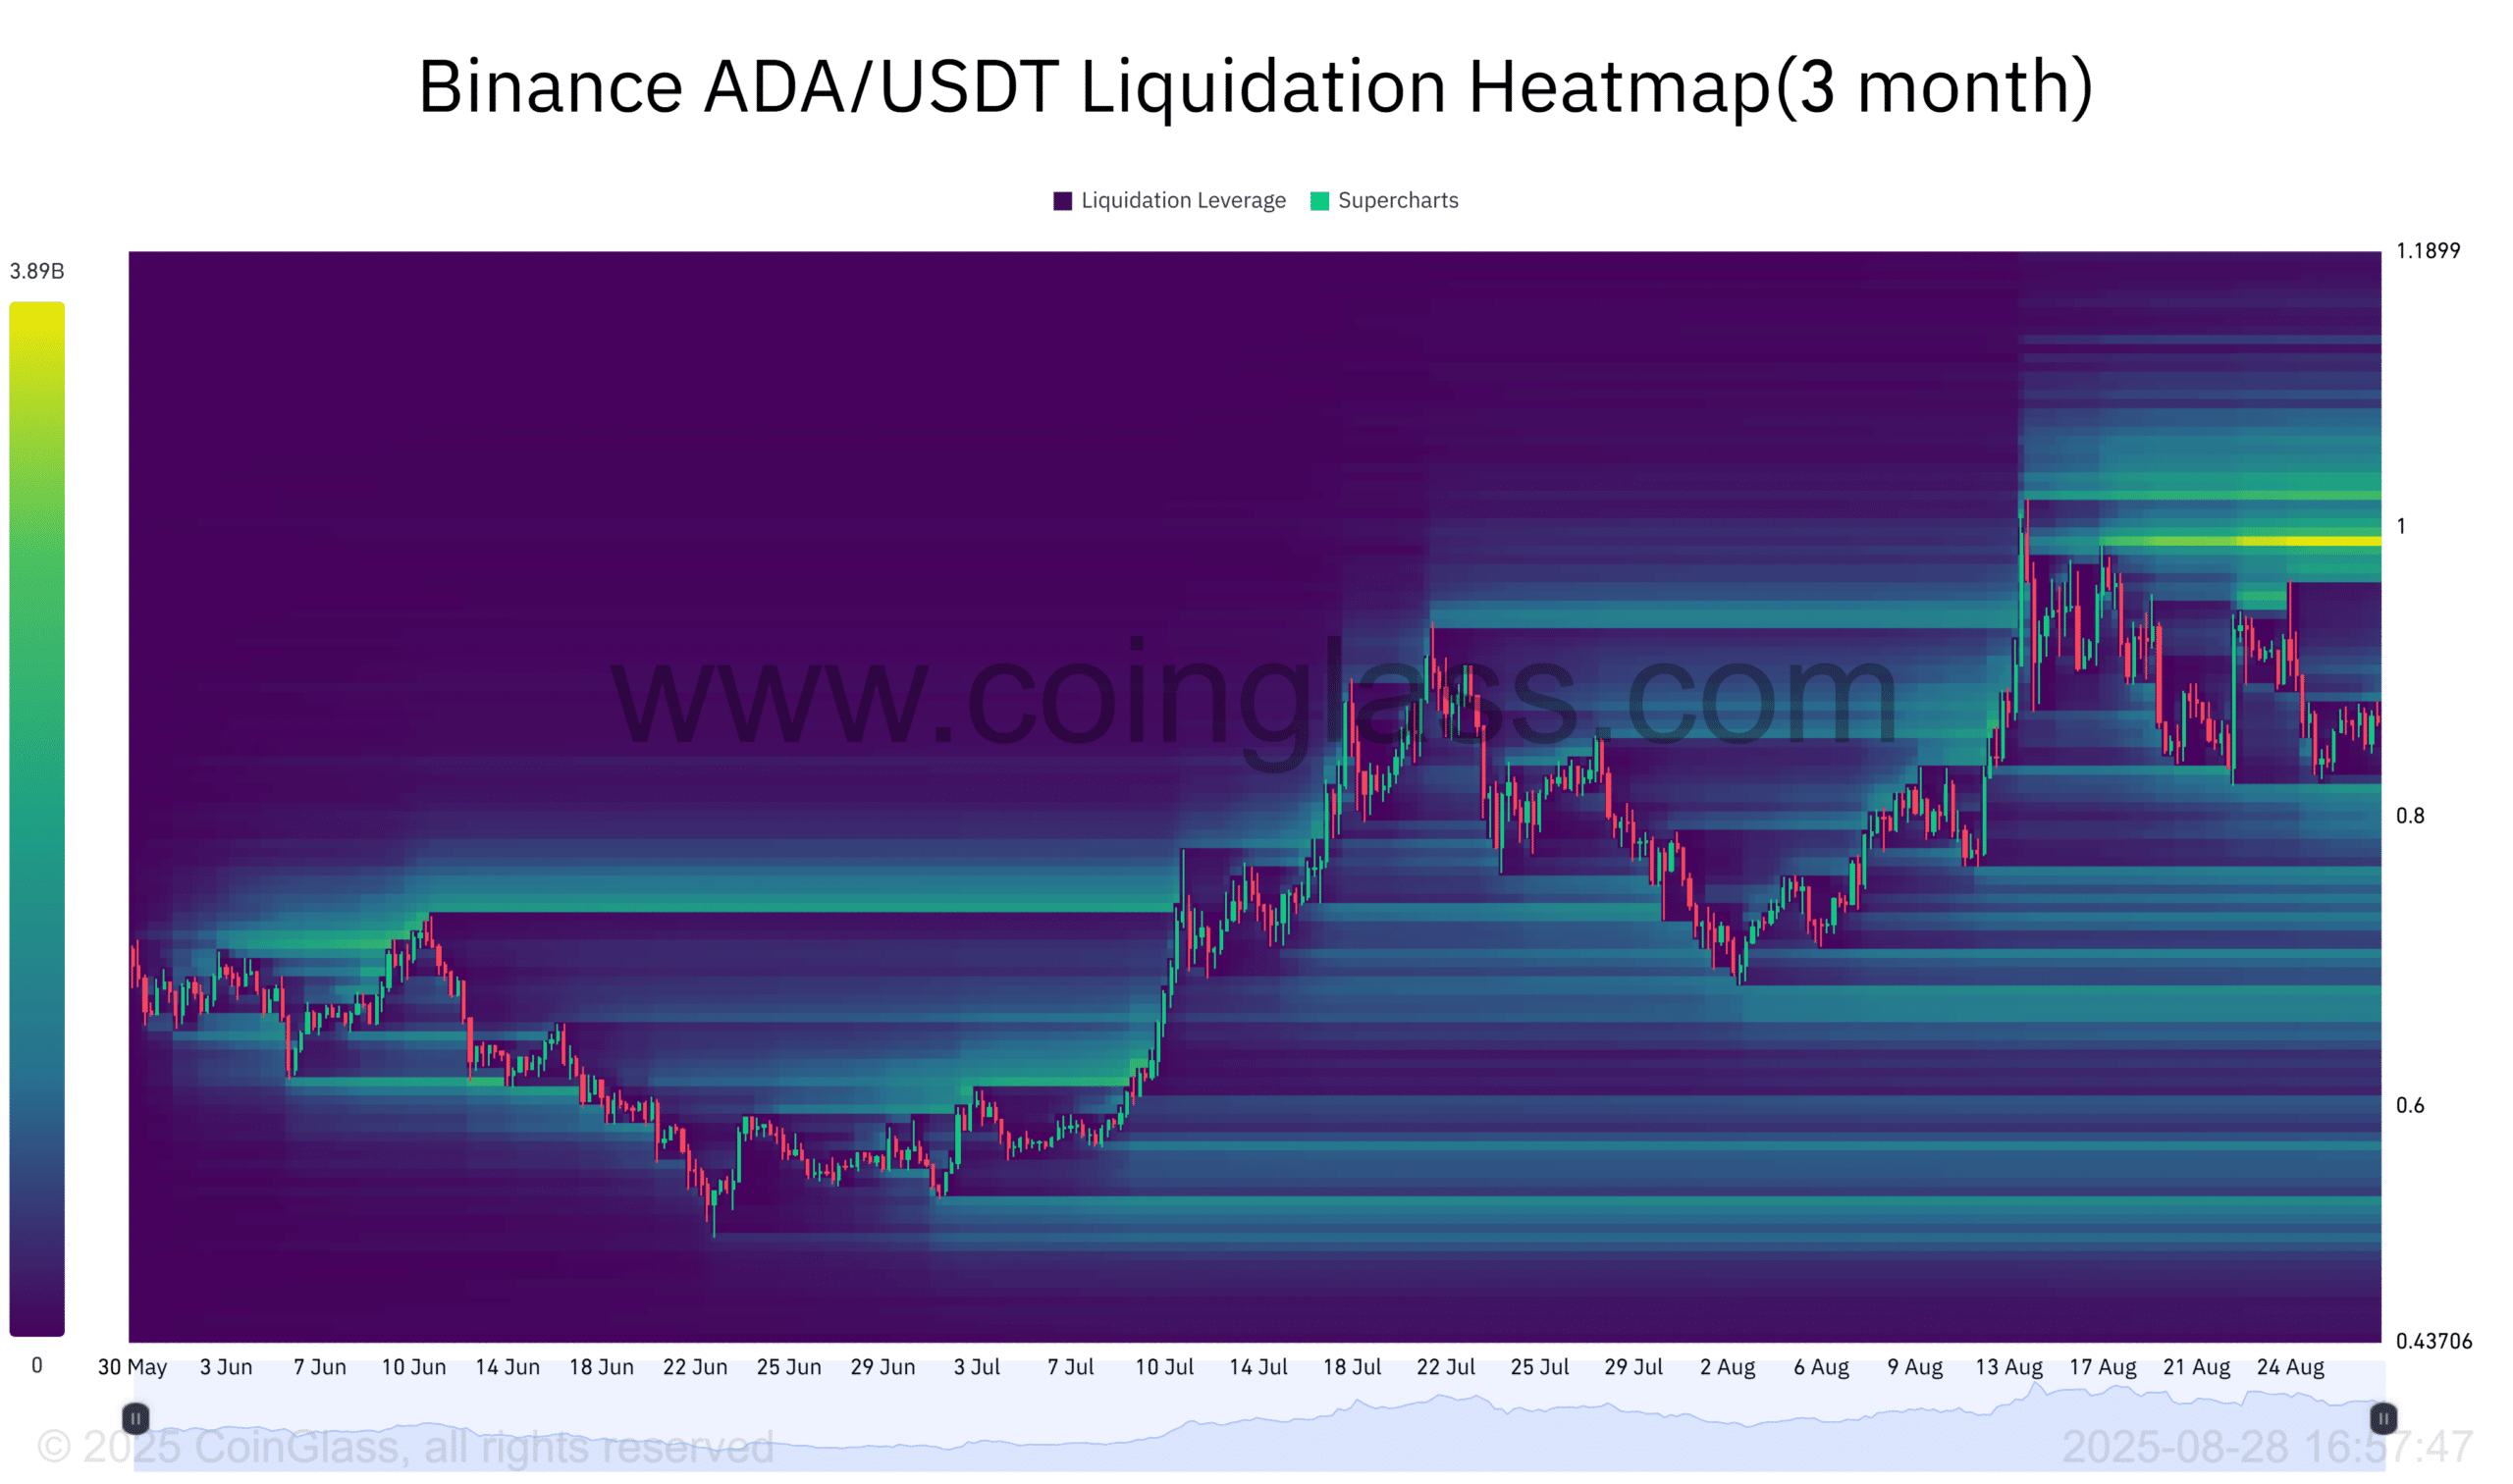
Source: Coinglass
The liquidation heatmap over the last three months points to the $1 area as a significant point of attraction for the price. It’s plausible that Cardano will aim for this price range in the coming weeks. Conversely, the $0.82 level also represents a key target to the downside.
This level is consistent with the higher low established by ADA on the daily chart. A potential scenario involves the price briefly dipping below $0.8, followed by a surge towards $1 and beyond. However, this hinges on Bitcoin avoiding a fall towards $100,000 during August and September.
Disclaimer: This analysis is for informational purposes only and should not be interpreted as financial, investment, or trading advice. The views expressed are solely those of the author.