

Key Points
Major investors are increasing their Solana holdings, and price charts hint at a potential rise to $263-$300. However, an overactive futures market and an imbalance towards long positions suggest increased price swings, either upward or downward, before a clear upward trend emerges.
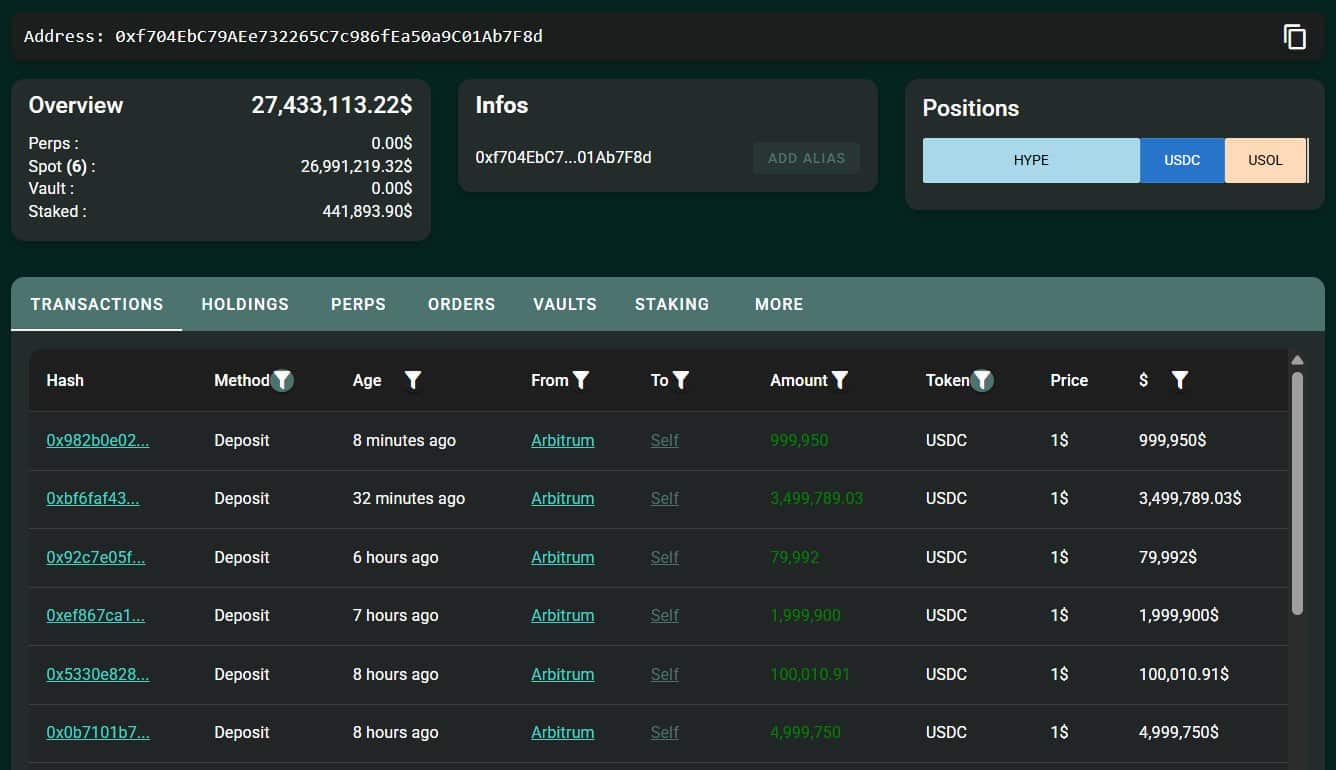
A significant investor deposited $11.68 million in USDC into HyperLiquid, acquiring 28,390 Solana (SOL) using a time-weighted average price (TWAP) order that was still in progress at the time of reporting.
This significant purchasing action has sparked discussions regarding a potential breakout for Solana from its current period of price consolidation.
Such substantial buying not only reduces the available supply but also indicates strong confidence in Solana’s future from major market participants.
Can Solana’s Triangle Pattern Lead to $300?
On the daily price chart, Solana has formed an ascending triangle pattern, which is often seen as a signal of a continuing upward trend.
The price is currently facing resistance between $222 and $230. Breaking above this range could pave the way for a move towards $263 and possibly $300, aligning with Fibonacci extension levels.
Meanwhile, support levels are established at $188 and $183, offering protection against potential downward price movements if the breakout fails.
Additionally, the Relative Strength Index (RSI) is currently around 57, showing neutral momentum at the time of this report. This indicates that SOL is neither overbought nor oversold, leaving room for buyers to drive further price increases.
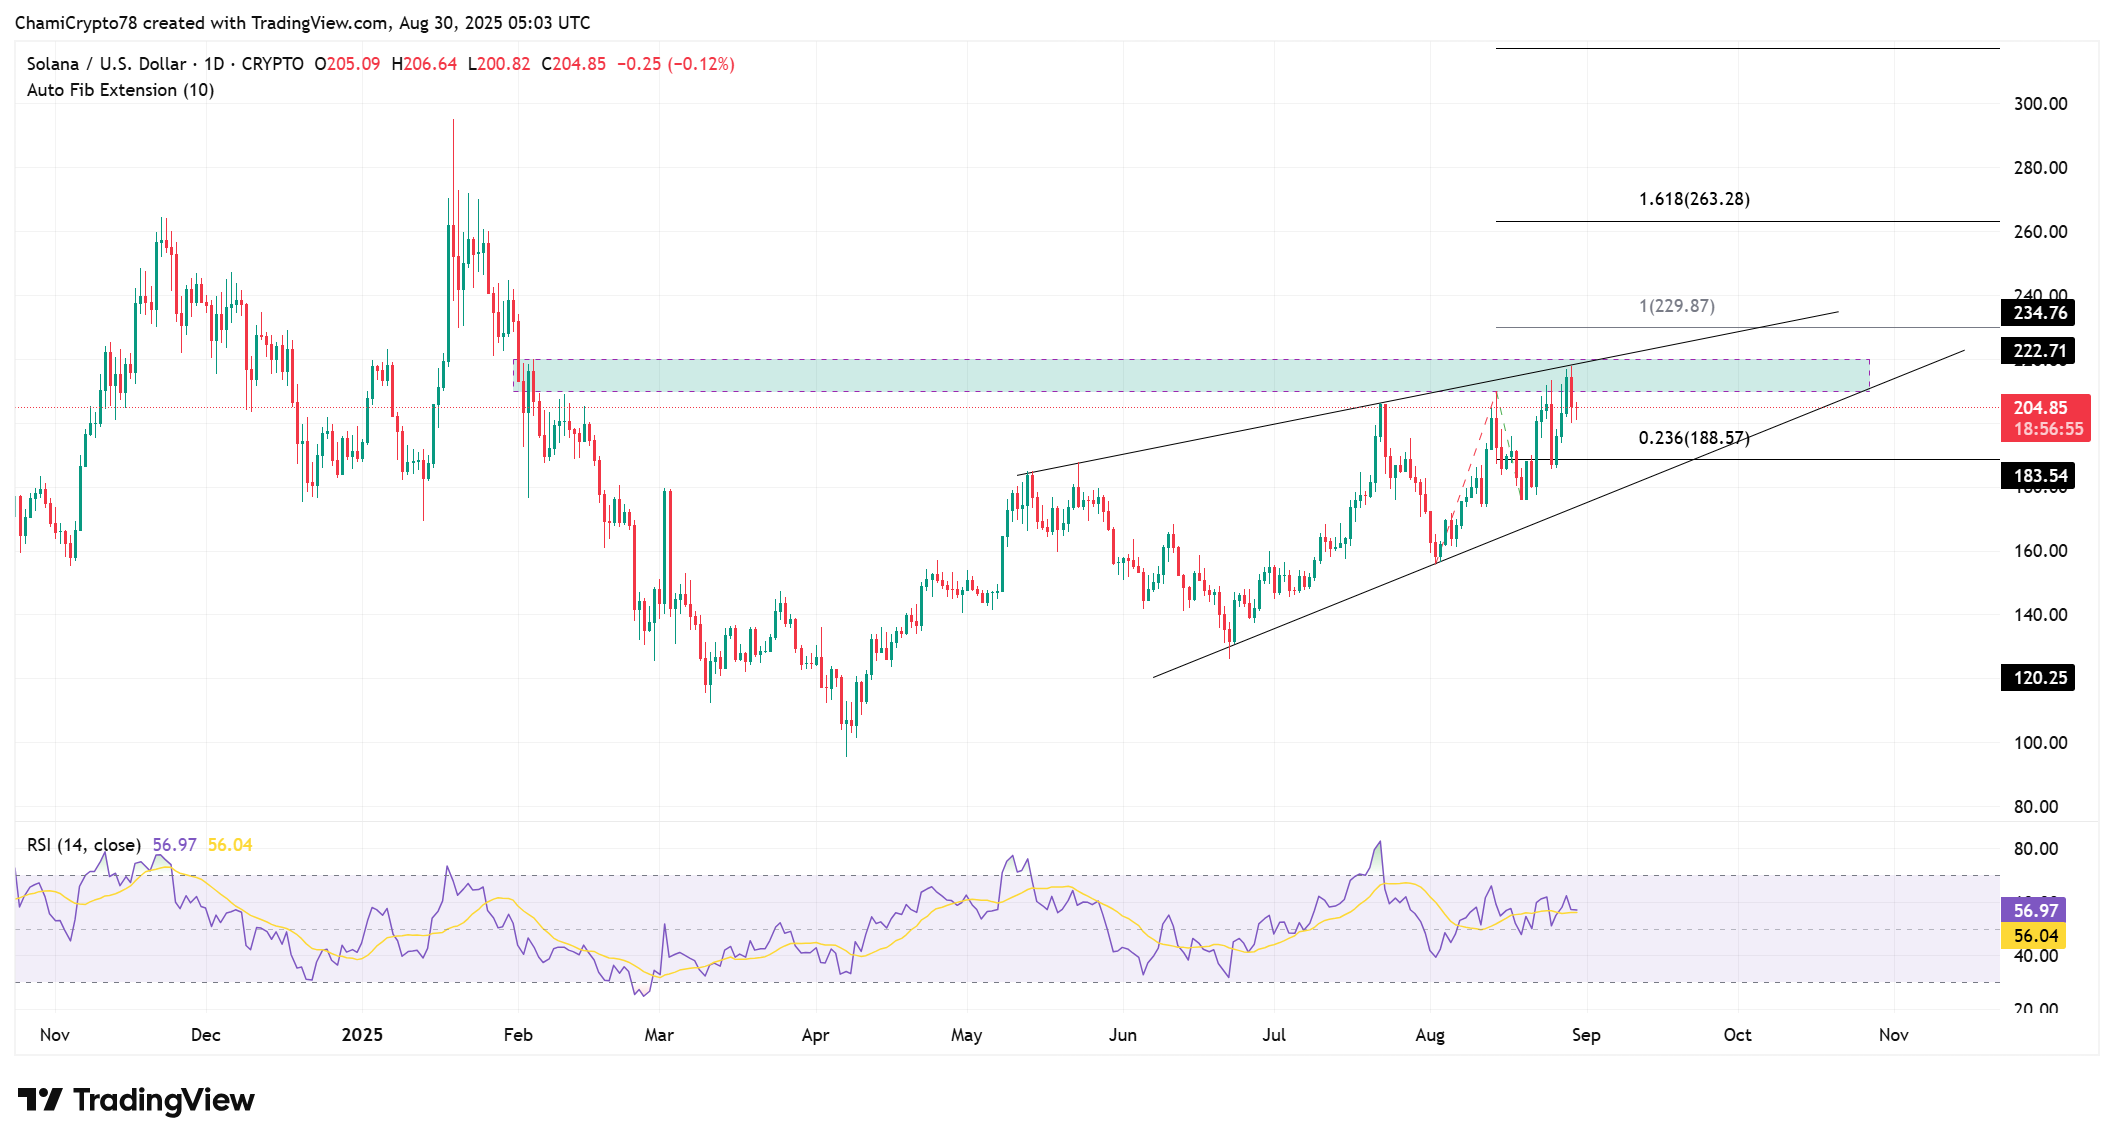
Source: TradingView
Are Traders Overly Optimistic About Solana?
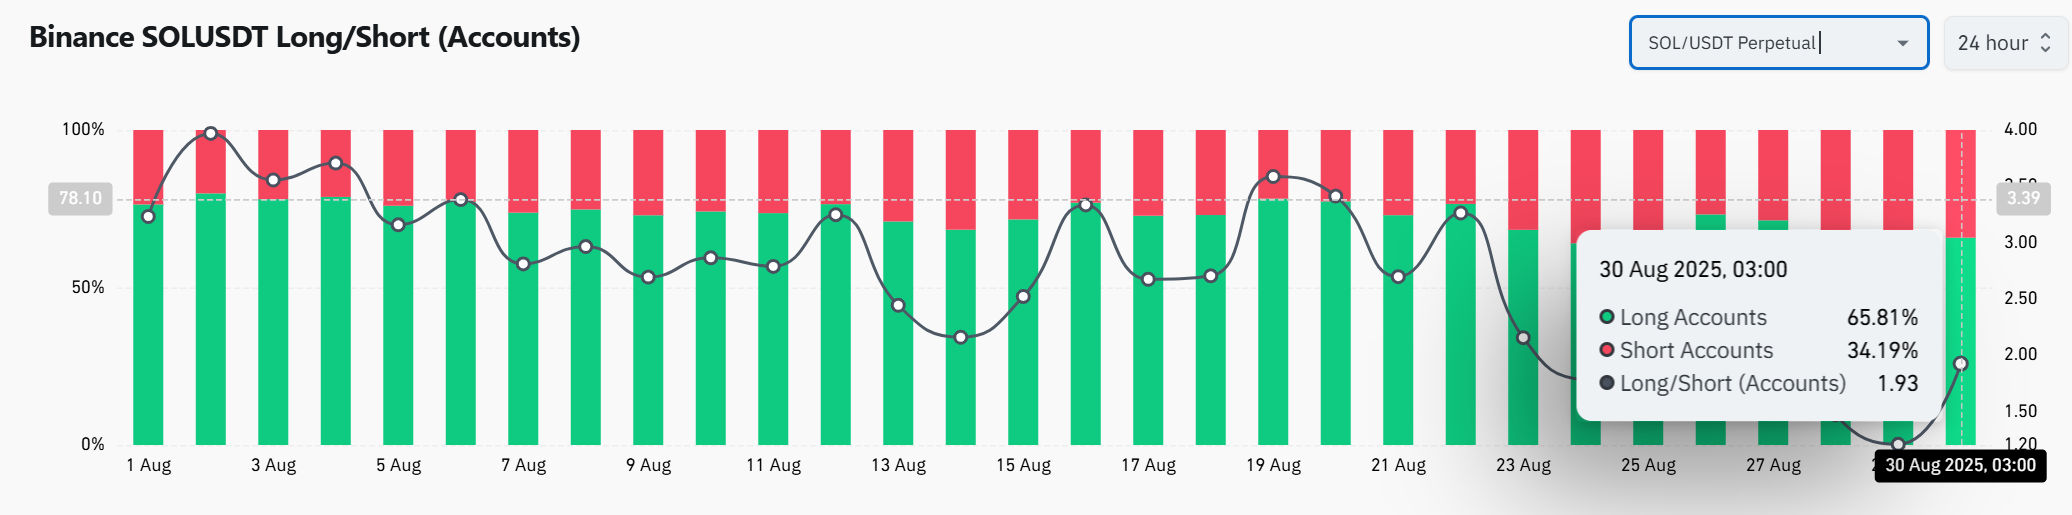
Data from Binance indicates a significant bullish bias among traders. Long positions currently account for 65.81% of all positions, while short positions make up only 34.19%.
The Long/Short Ratio stands at 1.93 at the time of this analysis, showcasing the strong confidence of traders using leverage.
This skewed positioning raises questions about the sustainability of the upward trend, as such imbalance can amplify volatility during sudden price changes.
If the resistance level holds, traders with excessive long positions could face liquidation, leading to increased downward pressure before a potential rebound.
Could Overheating Futures Markets Cause Volatility?
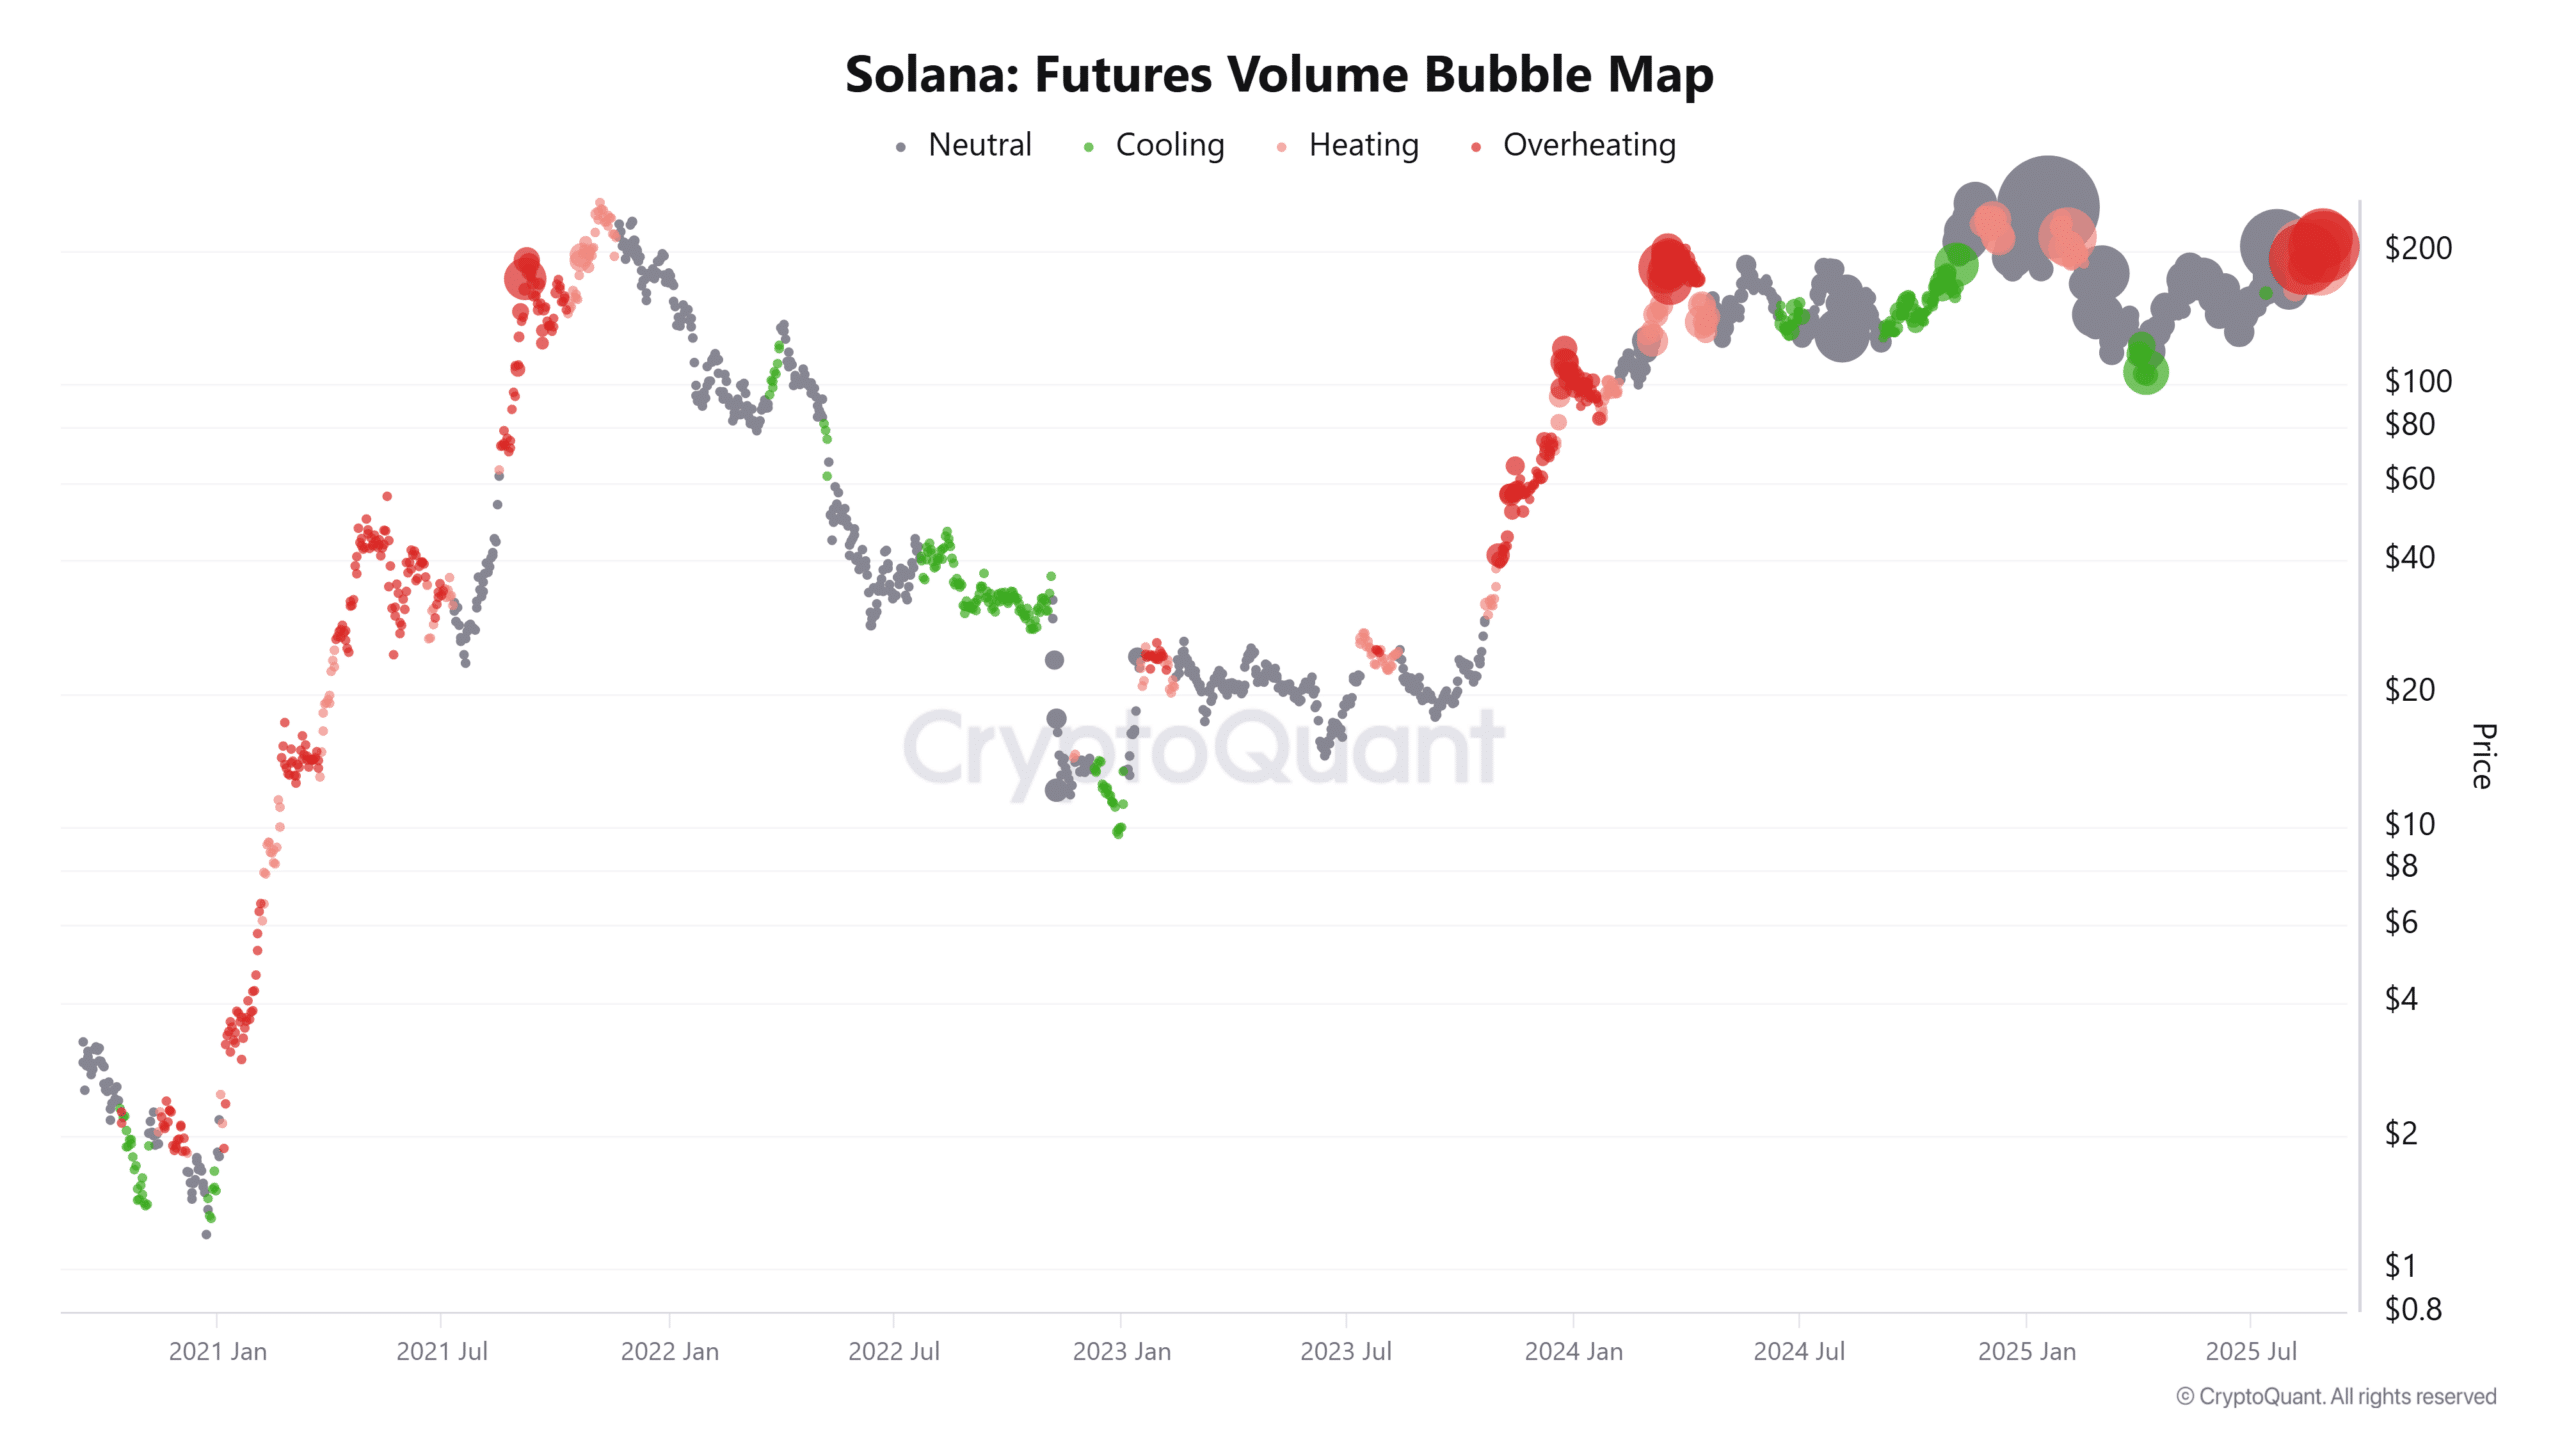
The Futures Volume Bubble Map shows that Solana’s derivatives market is currently “overheating,” suggesting high levels of leverage across different trading platforms.
Such conditions often lead to sudden liquidations, as high speculative exposure makes the market more vulnerable to rapid price swings.
While strong leverage can amplify upward breakouts, it also increases the risk of abrupt reversals, particularly if key resistance levels are maintained.
As volatility driven by futures trading intensifies, traders should approach the market with a balanced perspective, combining optimism with caution.
With significant accumulation by large investors and bullish sentiment prevailing, the next price movement will likely depend on whether demand can effectively absorb profit-taking and maintain momentum above the established resistance zones.
Will Whale Buying Activity Trigger a Breakout?
Increased buying activity by large investors has fueled speculation, while the ascending triangle pattern, strong trader bias, and futures market activity all highlight the high stakes involved in Solana’s current market situation.
If the $230 resistance level is broken, a move towards $263 and even $300 appears possible.
However, the overactive derivatives market and the high number of long positions suggest potentially volatile price movements in the near future. Ultimately, Solana’s chances of a breakout depend on whether buying pressure from large investors can overcome resistance and propel the price into a new rally phase.