

Journalist
Published:
Key Points
According to MEXC’s top analyst, SOL has the potential to continue its Q3 growth, reaching $215 and eventually targeting $250. The question remains: can the bulls overcome the historically weak September performance and the decrease in network activity?
In August, Solana [SOL] witnessed a 16% increase, boosting its Q3 returns to 30%.
Despite September traditionally being a challenging month, Shawn Young, the chief analyst at MEXC, forecasts that the altcoin could reach $215, indicating a possible 7% further increase.
Young stated to AMBCrypto that the recent Alpenglow upgrade, promising a 100x improvement in speed, combined with anticipated ETF inflows and over $1.7 billion in crypto treasury demand, could fuel this recovery.
“The synergy between technological advancements, strategic accumulation, and inflows related to ETFs significantly raises the stakes for SOL, potentially marking a turning point in adoption and price discovery.”
Young further elaborated,
“These factors could propel SOL’s price as high as $215 before September concludes and $250 before the end of Q4, assuming broader market conditions remain favorable.”
Indeed, some analysts predicted SOL could rise to $300 before year-end. However, the recent dip in network activity raises concerns about a potential short-term drag on this upward trend.
Solana’s Network Activity Takes a 90% Dive
While the medium-term outlook is positive, some market observers point out that activity on the Solana network has declined significantly, dropping by 90%.
The number of active traders on the Solana network has fallen from over 30 million during its peak in Q4 2024 to approximately 3 million as of September 2025. This decreased activity in decentralized exchanges (DEX) could negatively impact the demand for SOL.
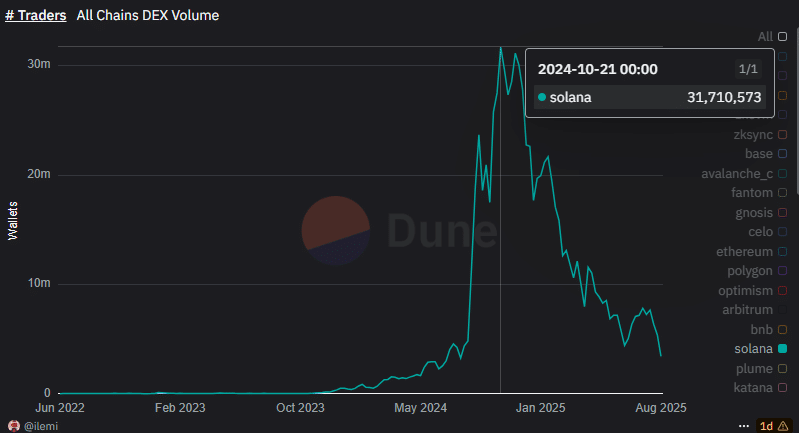
Source: Dune Analytics
Analyst Ted Pillows, in his analysis, suggested that SOL might test the significant liquidity range between $160 and $180 before potentially rallying to a new all-time high in Q4.
“I believe SOL could test the lower liquidity levels in September before achieving a new peak in Q4.”
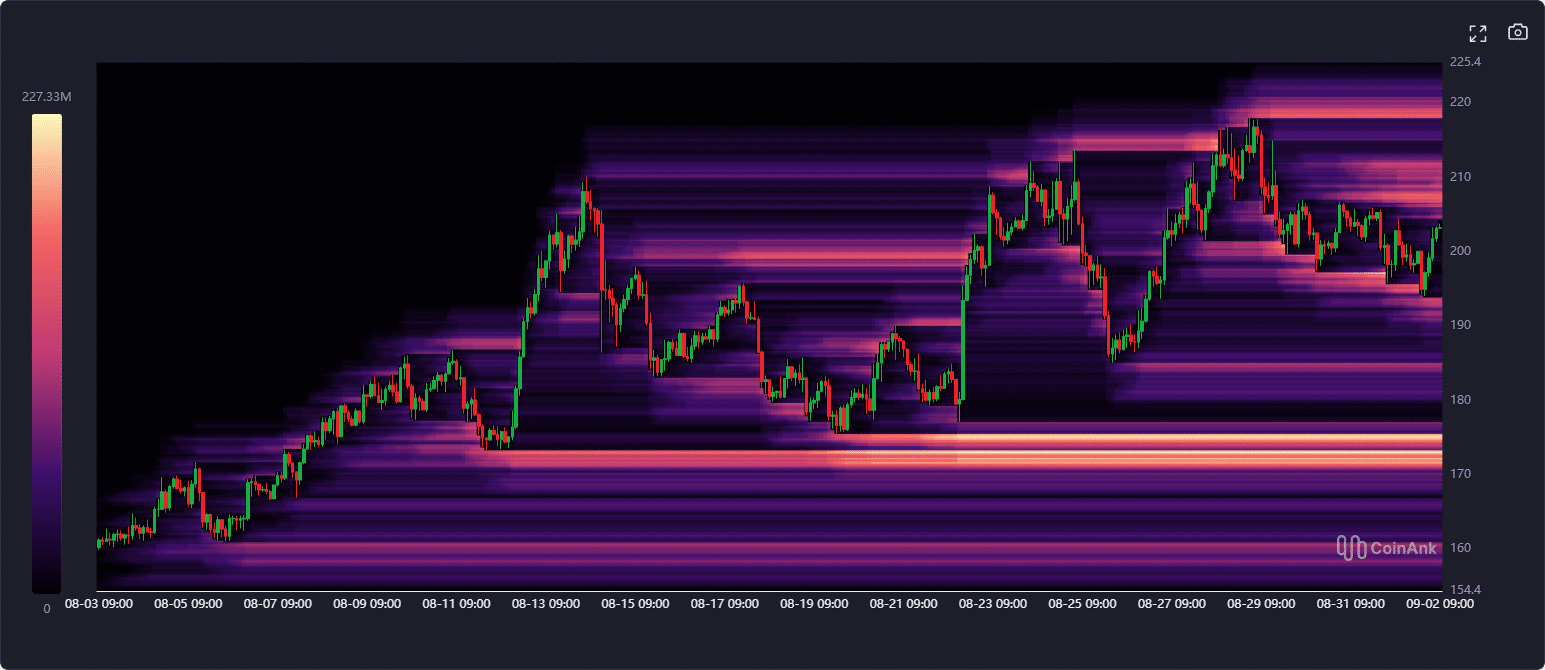
Source: CoinAnk
The most significant area of lower liquidity appears to be around $170-$175, making it a crucial area to watch if a pullback occurs.
Interestingly, price charts seem to align with this hypothesis. SOL has encountered price resistance at the upper boundary of the ascending triangle (marked in yellow) and the Bollinger Bands.
If historical patterns persist, the $215-$220 area could become a significant supply zone in the near term.
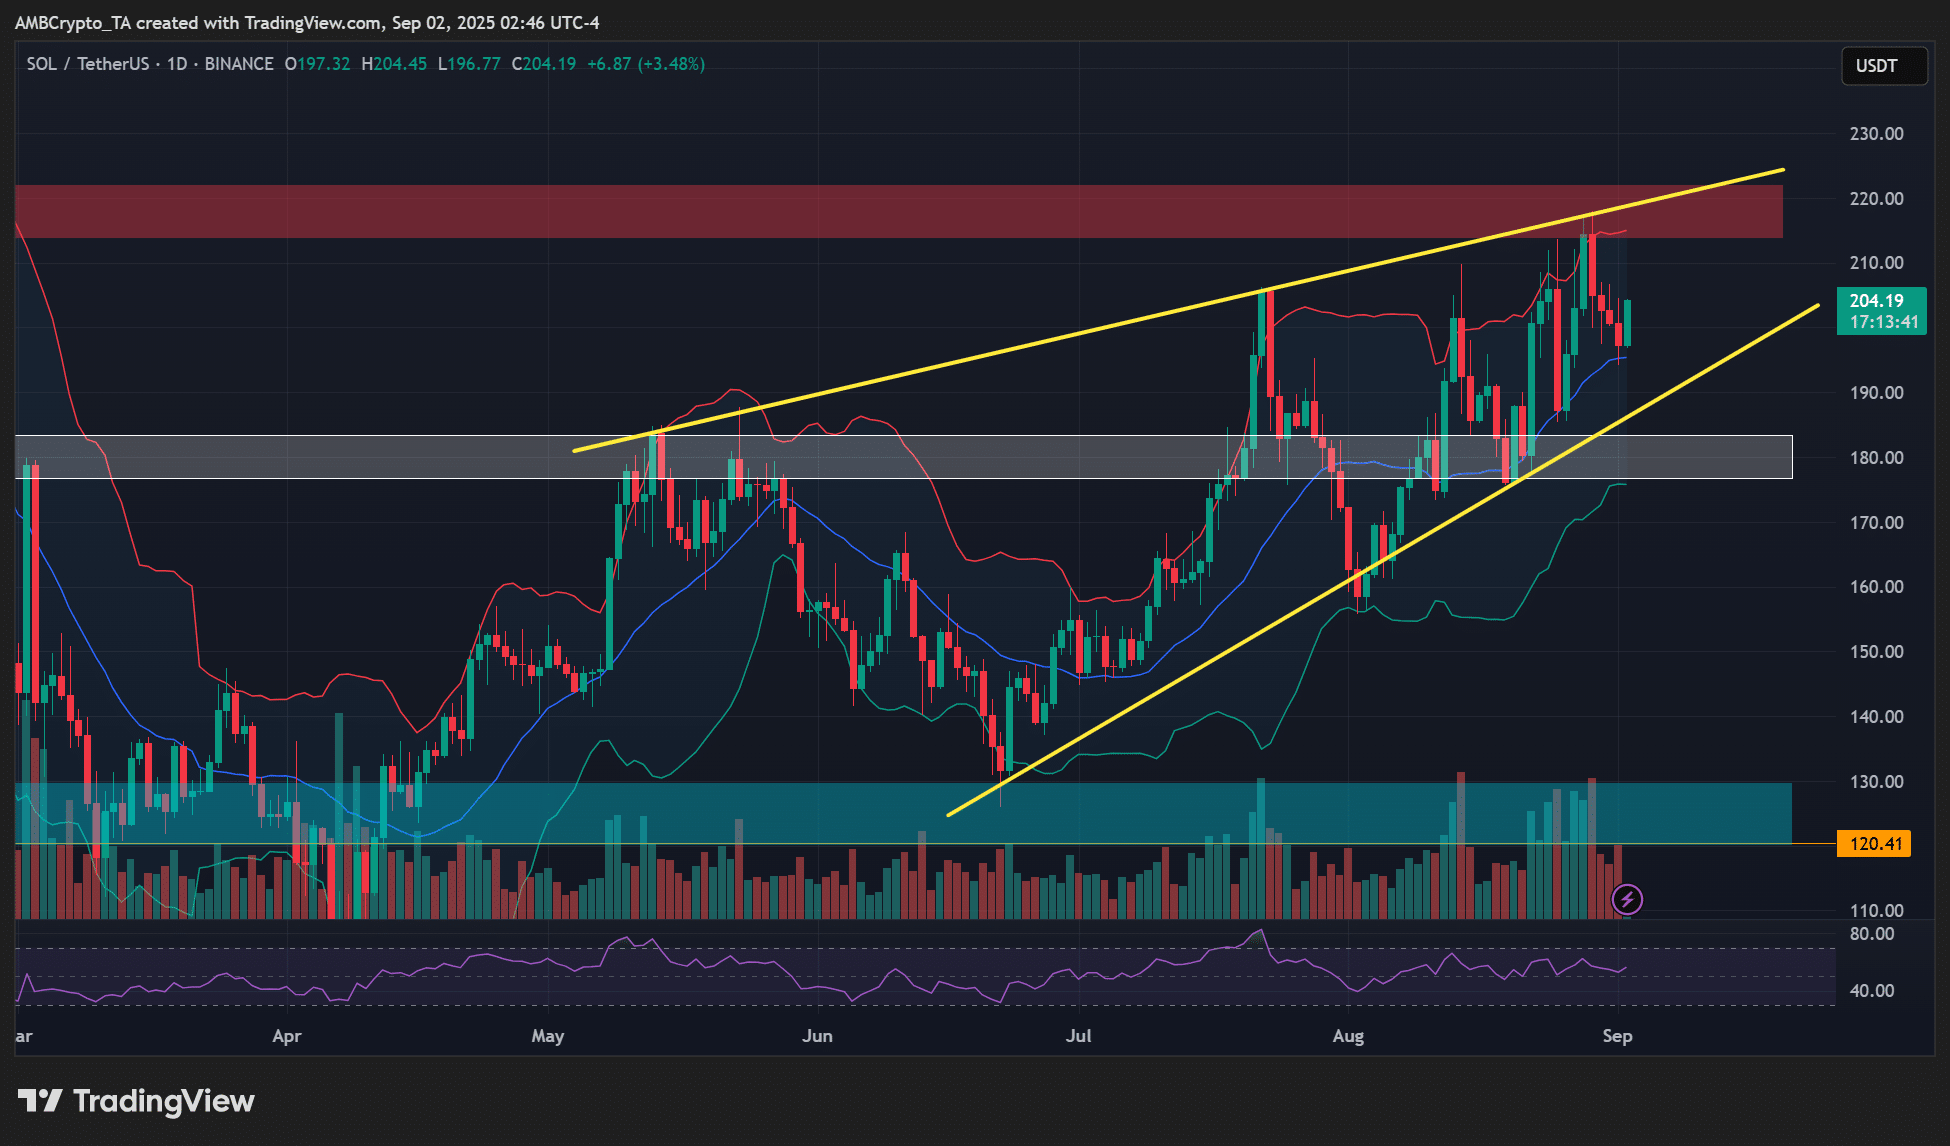
Source: SOL/USDT, TradingView
Historically, the mid and lower ranges of the Bollinger Bands have served as key support levels. These currently align with the $175-$180 level (marked in white), making it a crucial support level to monitor in the event of a significant correction.