

- Bitcoin is considering a revisit to its downward trendline support as significant BTC holders absorb selling activity.
- Ethereum’s price stability continues as interest in futures trading wanes amid reduced retail investor participation.
- XRP is trading within a defined range, held between its 100-day and 50-day Exponential Moving Averages, reflecting continued market caution.
Bitcoin (BTC) is maintaining its position above $110,000 on Thursday after an attempted recovery earlier in the week met resistance around $112,500. Ethereum (ETH) and Ripple (XRP) are hovering near critical support levels, showing signs of consolidation as retail trading interest decreases.
Insight: Bitcoin Reserves Grow Despite Market Swings
The amount of Bitcoin held in treasury balances has consistently risen throughout the year, signifying sustained demand despite price volatility. Currently, Bitcoin treasuries collectively hold approximately 847,330 BTC, with an estimated value of $93.9 billion. Data from SoSoValue indicates a net increase of 1,100 BTC over the past week, equivalent to roughly $122 million.
Bitcoin treasuries | Source: CoinGlass
According to Sentora analysts, “This ongoing accumulation suggests a strong, underlying belief among institutional investors, even amidst fluctuating market conditions.”

Bitcoin treasuries MoM holdings | Source: Sentora
Data from Glassnode suggests that investors are increasingly taking advantage of price dips to increase their holdings, with a support level identified around $104,000 and resistance at $116,000. However, reduced activity in futures markets and lower demand for Exchange Traded Funds (ETFs) could limit potential upward price movement.
A successful breach of the resistance level might reignite the upward trend, raising the possibility of Bitcoin’s price exceeding $120,000. Conversely, a fall below the $104,000 support could signal a potential downturn towards the $93,000 to $95,000 demand zone.
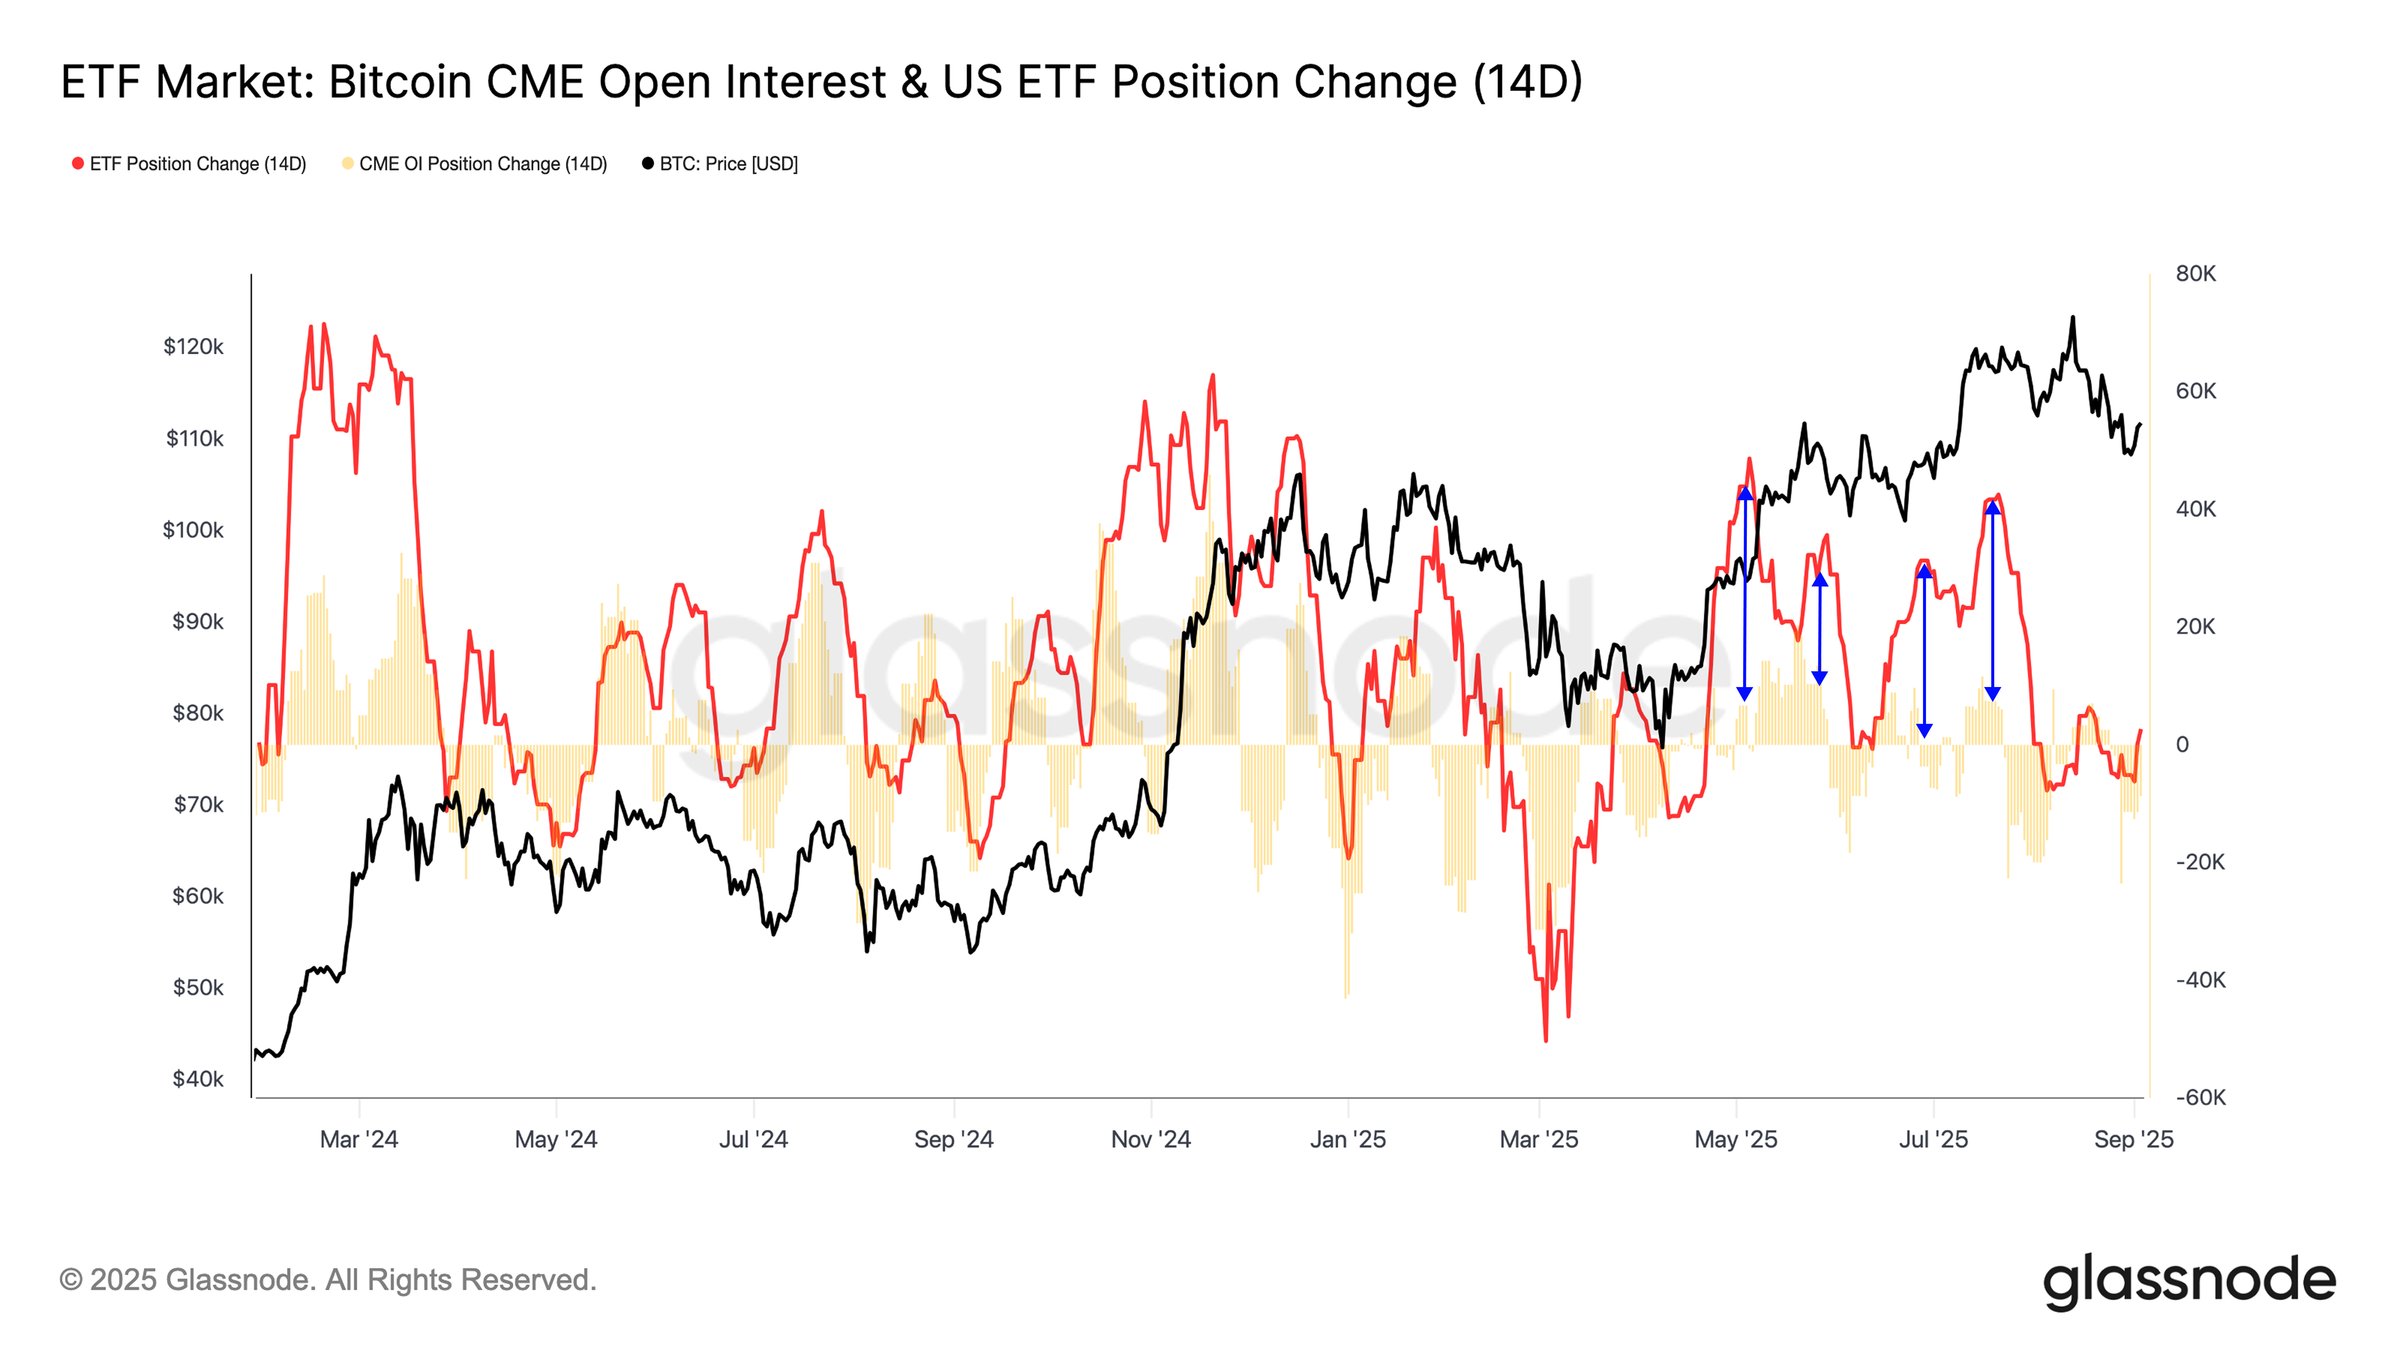
Bitcoin ETF market | Source: Glassnode
Ethereum, meanwhile, is experiencing a notable decline in Open Interest (OI) in futures markets, which, according to data from CoinGlass, is currently at $59 billion after reaching a peak of $70 billion on August 24.
OI represents the total value of outstanding futures contracts. A sustained decrease in OI could indicate weaker retail demand due to a lack of confidence in a potential return to its all-time high of $4,956.

Ethereum futures Open Interest | Source: CoinGlass
XRP is facing a comparable situation, with futures OI dropping to $7.61 billion after peaking at $10.94 billion on July 22. Maintaining a recovery could prove more challenging for XRP amid diminishing retail interest, potentially leading to extended price fluctuations.

XRP futures Open Interest | Source: CoinGlass
Technical Analysis: Bitcoin Chart Points to Potential Trendline Test
Bitcoin’s price recently broke through a key trendline resistance but encountered selling pressure around $112,500 on Wednesday. The price is presently positioned above the 100-day Exponential Moving Average (EMA) support level at $110,736.
A downward correction below this moving average could lead to Bitcoin retesting the aforementioned trendline support, which, if successful, would confirm a potential breakout towards the $116,000 target and the significant $120,000 level.
The Relative Strength Index (RSI) reading of 44 suggests waning buying interest. As the RSI declines, buying pressure weakens, making BTC vulnerable to further price drops. A continued decline could prompt traders to consider the 200-day EMA at $104,314 as a potential support area.

BTC/USDT daily chart
Altcoin Market: Ethereum and XRP in Continued Consolidation
Ethereum is holding above $4,300 after bullish momentum faded below the $4,500 mark on Wednesday. Current technical indicators suggest a higher probability of downward movement, reflecting a risk-averse sentiment in the derivatives market.
The MACD indicator has maintained a sell signal since August 25, encouraging traders to reduce their positions in anticipation of further price declines before a potential recovery towards its record high of $4,956.
Traders should pay close attention to how the ETH price reacts to the ascending trendline visible on the daily chart. The price previously bounced off this trendline in early July, suggesting a possible reversal if tested again. Other important support levels include the 50-day EMA at $4,044 and the 100-day EMA at $3,566.

ETH/USDT daily chart
Regarding XRP, its current position between the 100-day EMA support at $2.77 and the 50-day EMA resistance at $2.91 indicates a potential period of prolonged consolidation before the next significant breakout. A sell signal from the MACD indicator since July 25 hints at the possibility of the downtrend extending towards the 200-day EMA support at $2.51.

XRP/USDT daily chart
However, the RSI’s stability at 44 reflects the ongoing balance between buying and selling pressures. If the RSI climbs above the midline, increased buying activity could raise the likelihood of XRP reclaiming the $3.00 support level.
Bitcoin, altcoins, stablecoins FAQs
Bitcoin, the dominant cryptocurrency by market value, functions as a decentralized digital currency. Its design eliminates the necessity for intermediaries in financial exchanges, ensuring no single entity controls it.
The term ‘altcoins’ refers to all cryptocurrencies other than Bitcoin. Notably, some consider Ethereum separate due to its pivotal role in cryptocurrency forking events. Litecoin, derived from Bitcoin’s protocol, holds distinction as an early, enhanced alternative.
Stablecoins offer price stability by maintaining a value that is linked to a particular asset, such as the US Dollar. This peg is maintained via reserves or algorithmic controls. They facilitate entry and exit points for crypto investors and provide a store of value during periods of market volatility.
Bitcoin dominance is a metric showing Bitcoin’s market cap as a ratio of the total cryptocurrency market. High dominance suggests stronger investor focus and preference for Bitcoin, often seen before or during bull markets. Declining dominance points to capital flow into altcoins, potentially triggering altcoin rallies.
Disclaimer: For informational purposes only. Past performance does not guarantee future results.