

Key Points:
-
For XRP to target $3, its price must successfully surpass the $2.20-$2.30 threshold and the 200-day Simple Moving Average (SMA), currently positioned at $2.36.
-
The XRP/BTC pairing is exhibiting promising signs, breaking free from a prolonged downward trajectory, with the Relative Strength Index (RSI) indicating a potential bullish shift.
The price of XRP, a digital asset, experienced a minor dip, registering a 0.1% decline over the preceding 24 hours, settling at $2.26. Market observers are closely monitoring key resistance levels that XRP needs to overcome to pave the way toward the $3 mark.
Breaking Above 200-day SMA is Crucial for XRP
To sustain upward momentum, XRP needs to firmly establish itself above the $2.20-$2.30 range on the daily chart. Currently, the 50-day SMA sits at $2.22, closely followed by the 100-day SMA at $2.20. Crucially, buyers must conquer the $2.36 hurdle, represented by the 200-day SMA, to fuel aspirations of reaching highs beyond $3.
Worth Reading: A Pattern Emerges: XRP Signal Precedes Significant Price Drops
Historically, XRP’s price has witnessed substantial rallies following a successful transition of the 200-day SMA into a support level. A notable instance occurred in November 2024 when the XRP/USD pair broke above the 200-day SMA, triggering a remarkable 430% surge in price, ultimately reaching a multi-year peak of $2.90 on December 3, 2024.
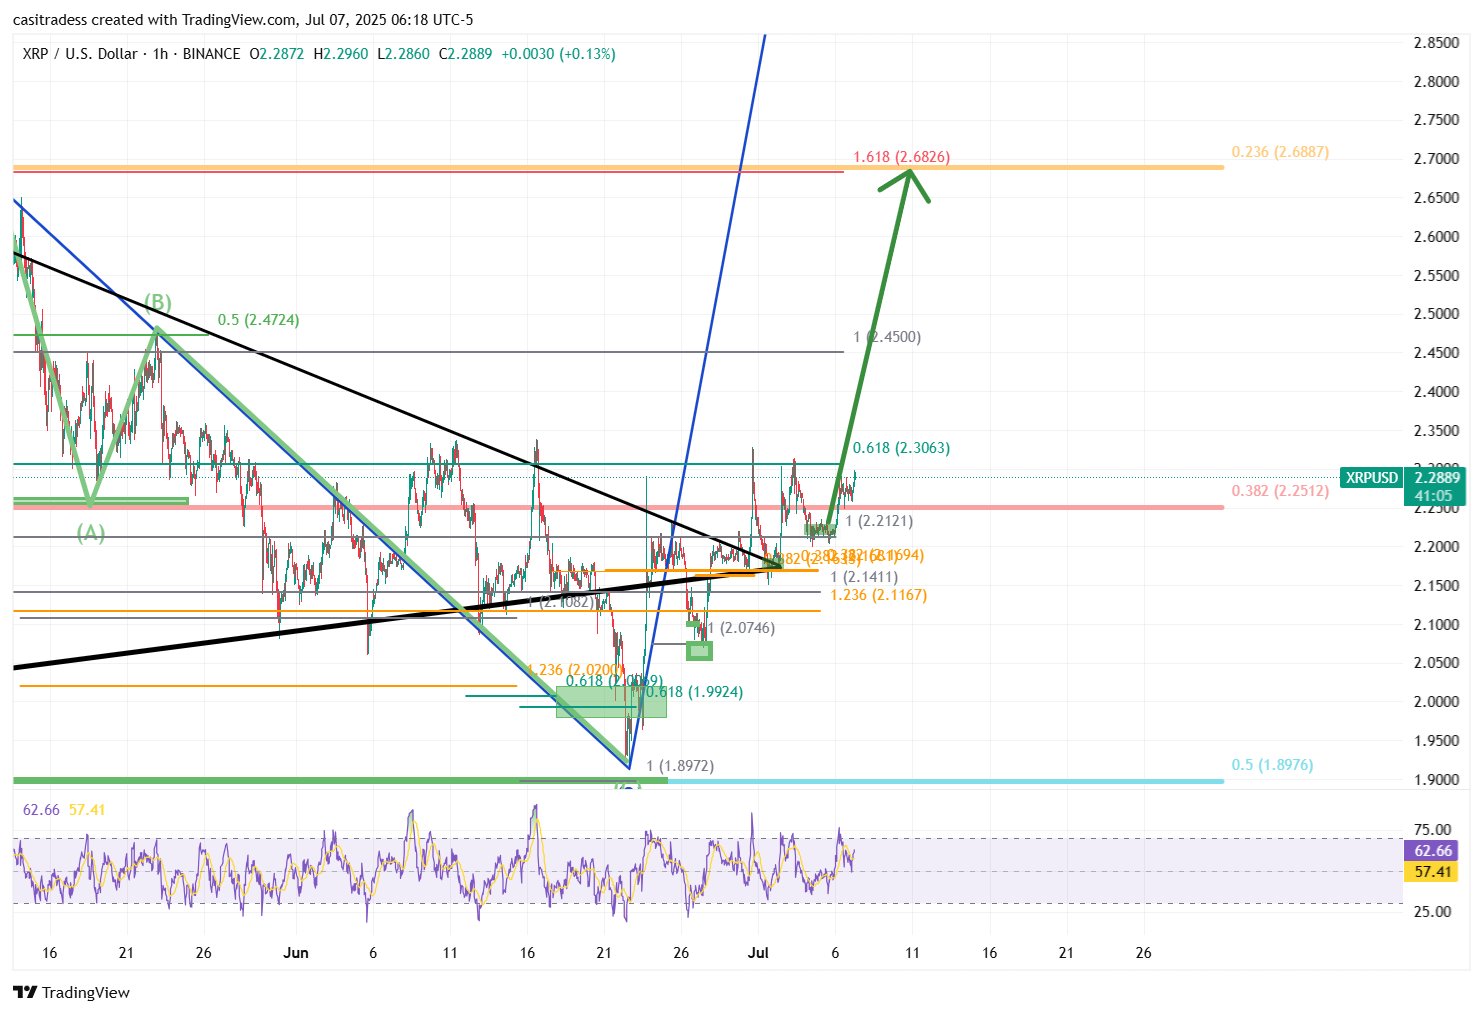
Crypto analyst CasiTrades noted, “Momentum is building; an XRP breakout is imminent!” in a recent commentary.
The analyst further elaborated that consecutive higher lows, coupled with reclaiming the $2.25 support, presented textbook bullish continuation signals. CasiTrades highlighted that the $2.25 level marks the convergence point of a multi-month trendline alongside the 50-day and 100-day SMAs.
“Currently, we’re positioned just beneath the $2.30 local resistance. A break above this level would likely set targets at $2.69 and $3.04.”
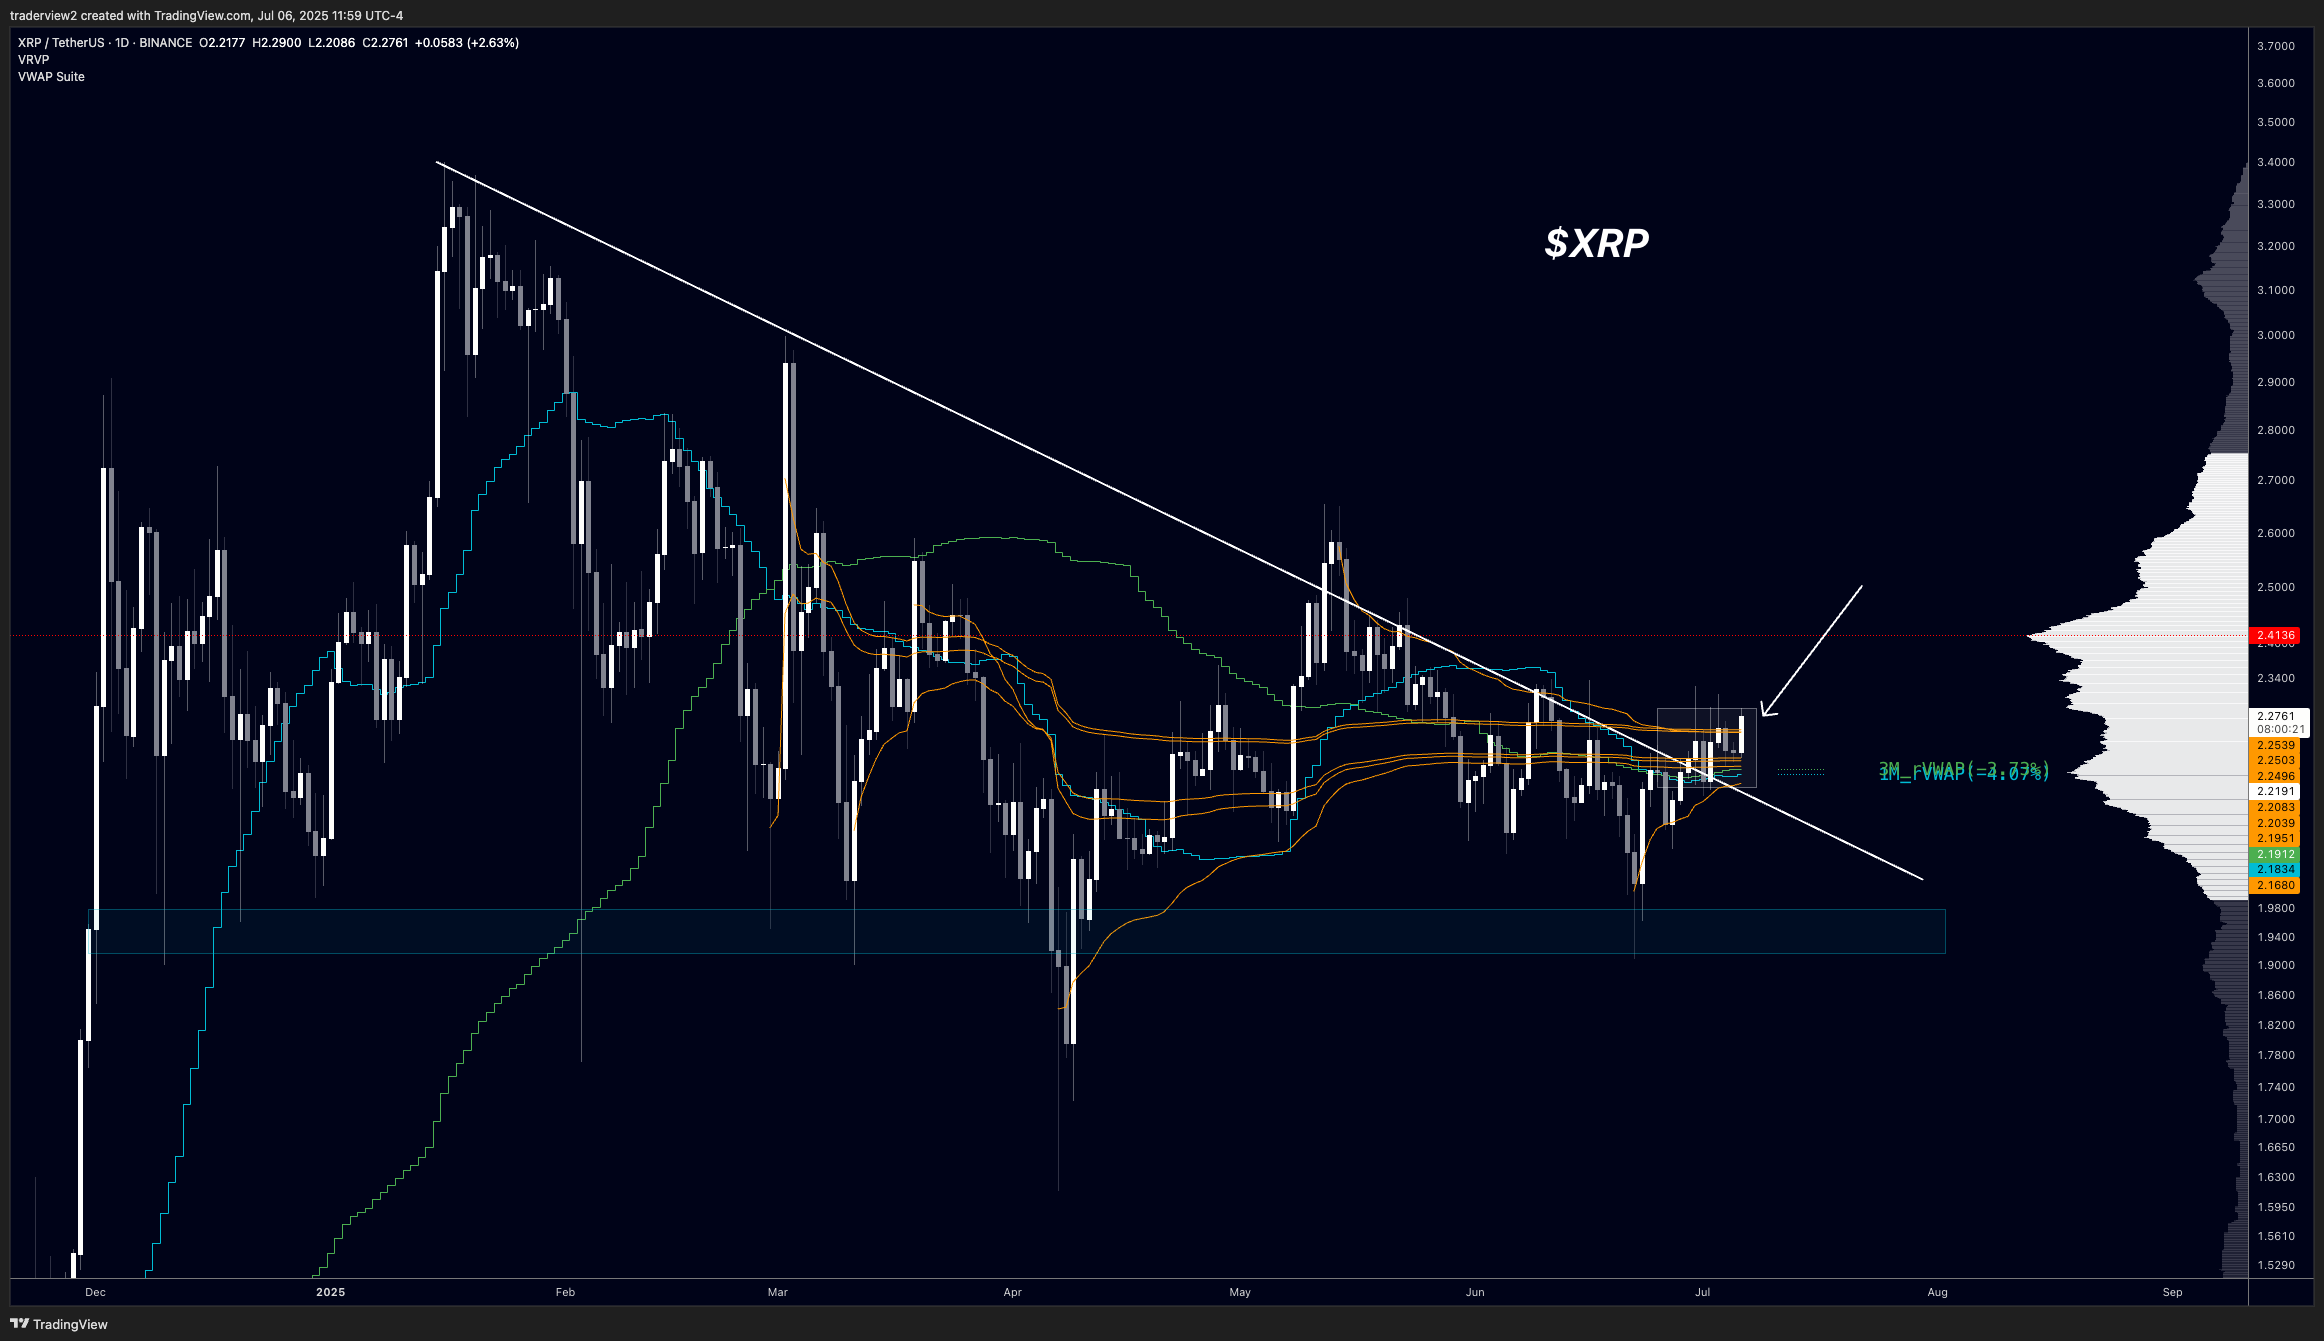
Echoing similar observations, analyst Dom remarked that XRP was trading above a critical “breakout zone” exceeding $2.25, coinciding with the confluence of major Volume Weighted Average Prices (VWAPs) and a 160-day downtrend line.
“This setup provides the impetus for bulls to emerge aggressively, potentially propelling the price towards the $2.40s.”
XRP/BTC Aiming to End Multi-Month Decline
XRP also demonstrates optimistic indicators against Bitcoin. The XRP/BTC pair transcended a multi-month declining trendline at 0.00002065 on Sunday, a resistance barrier since March.
Successfully retesting this trendline would validate the conclusion of the downtrend, setting the stage for the XRP/BTC pair to ascend higher.
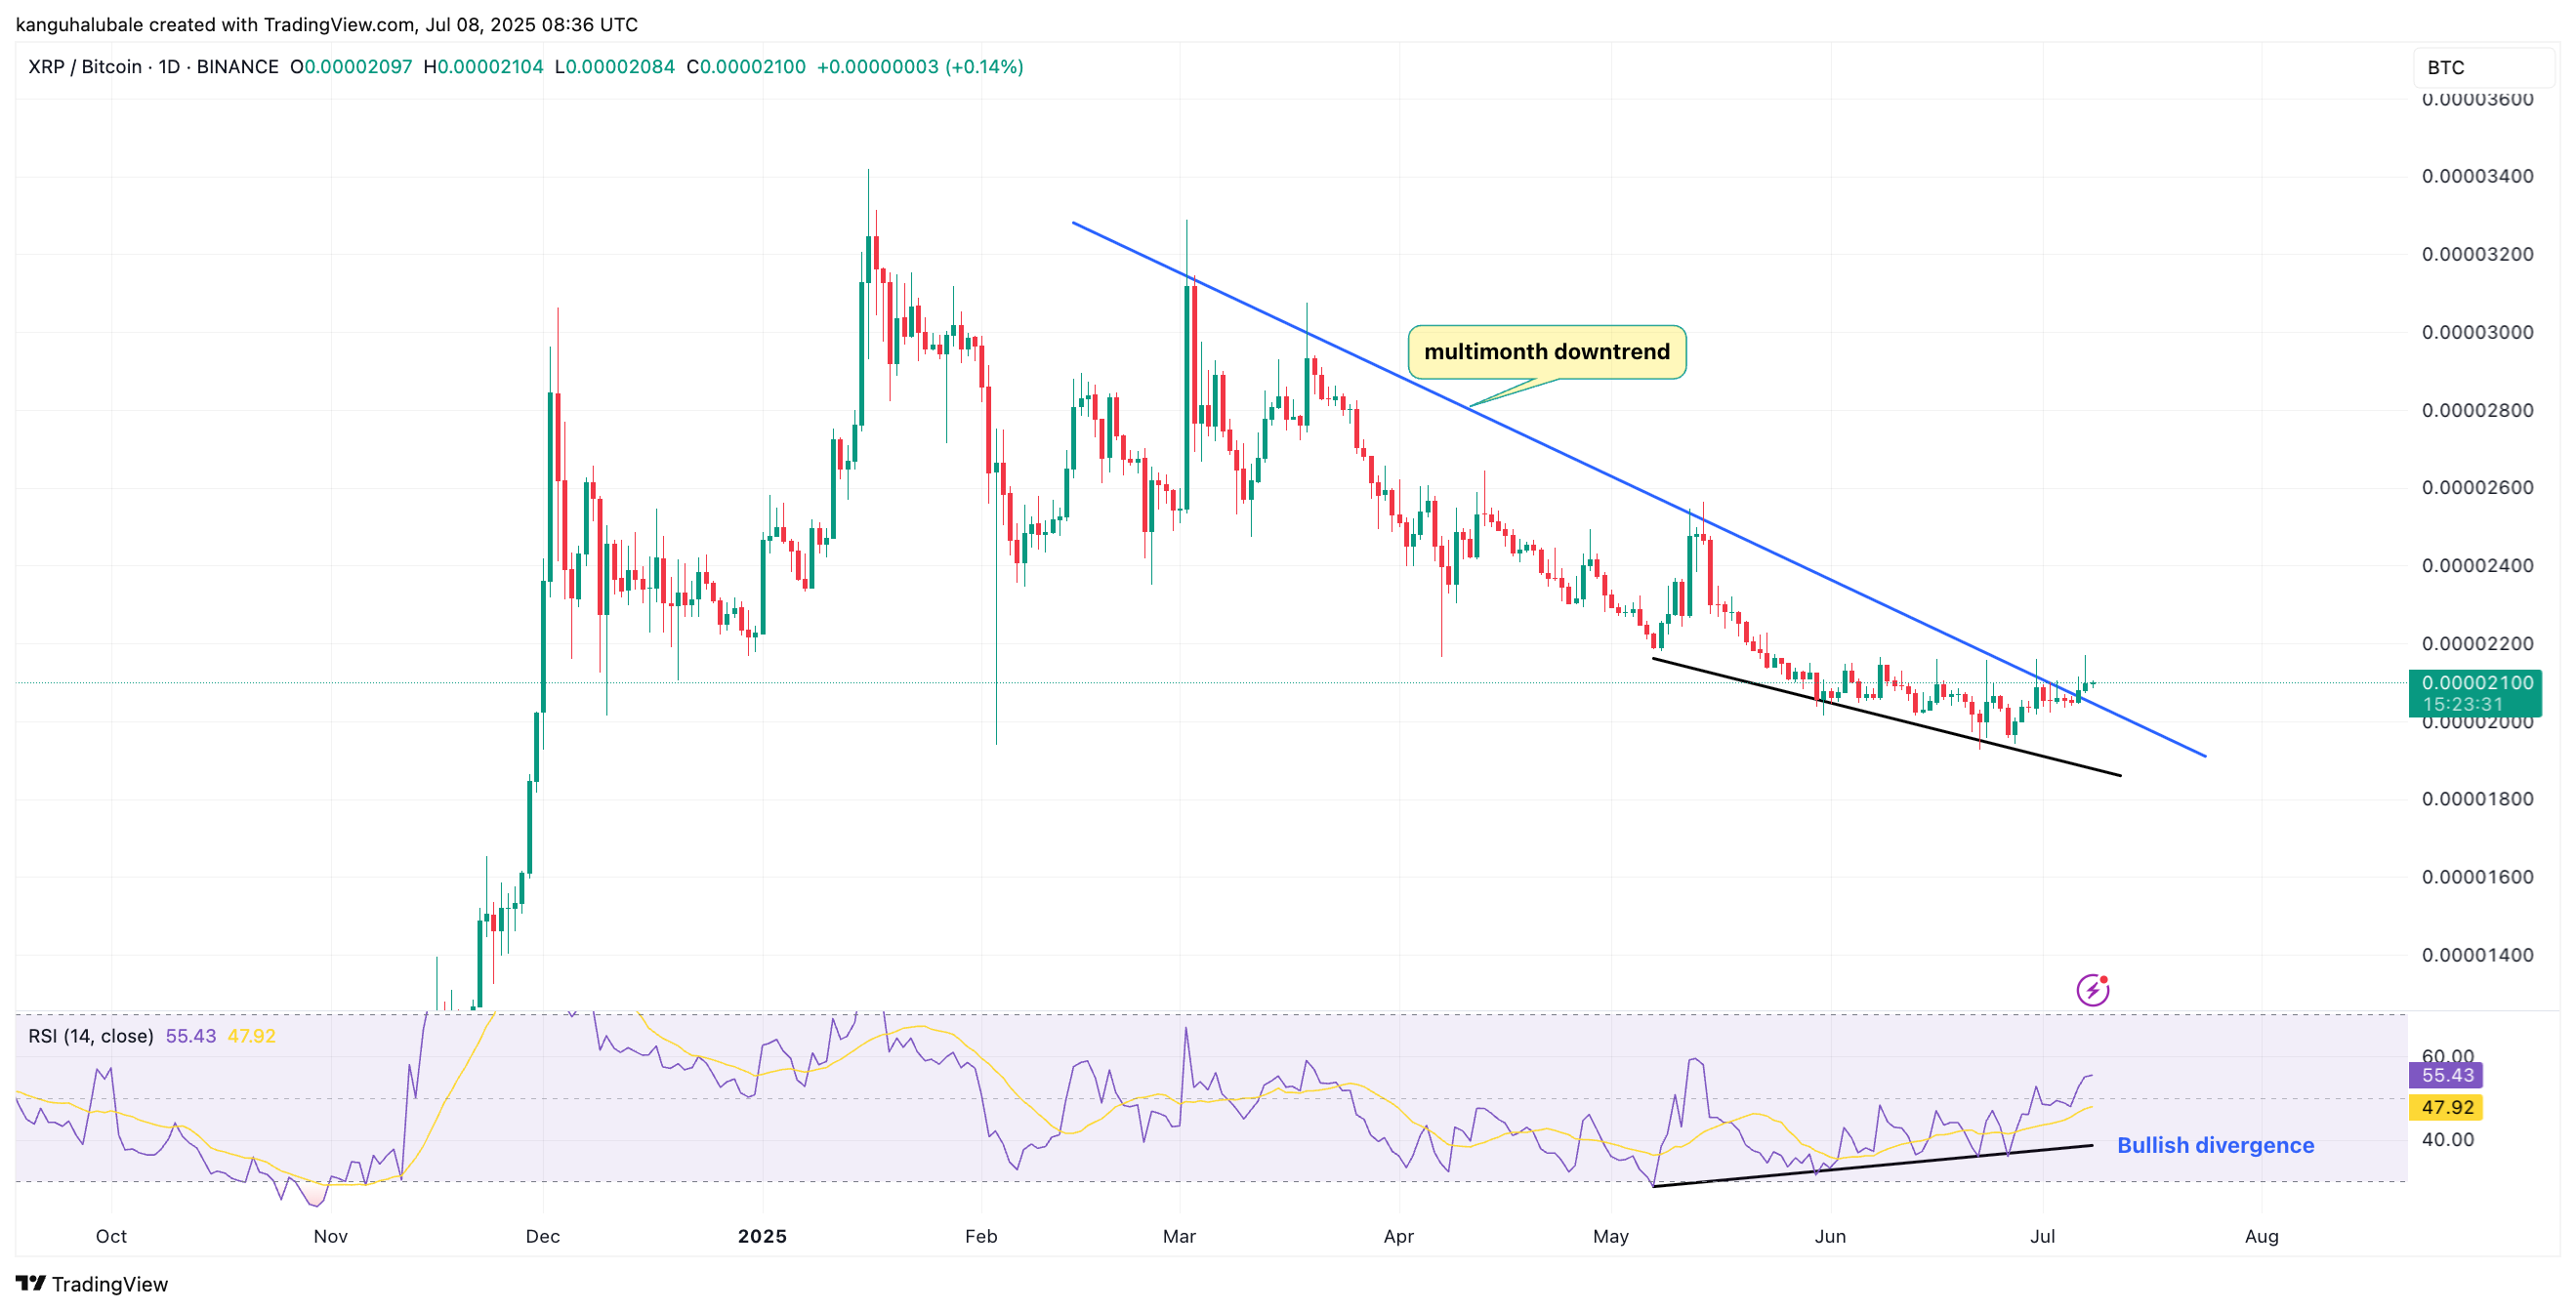
Reinforcing XRP’s potential lies in a growing bullish divergence between its XRP/BTC pair and the Relative Strength Index (RSI). As the chart illustrates, the XRP/BTC pair experienced a downturn between May and July, forging lower lows, while the daily RSI progressively rose from 28 to 55, establishing higher lows.
Typically, a divergence characterized by declining prices alongside a rising RSI hints at a weakening of the prevailing downtrend. This pattern encourages traders to capitalize on dips, as increasing investor engagement converges with diminishing seller pressure.
Analysts anticipate XRP to continue outperforming Bitcoin, with Mikybull Crypto positing that the pair must overcome the 0.000022 resistance to validate further gains.
“Shatter this trendline resistance, and XRP is poised for a significant rally.”
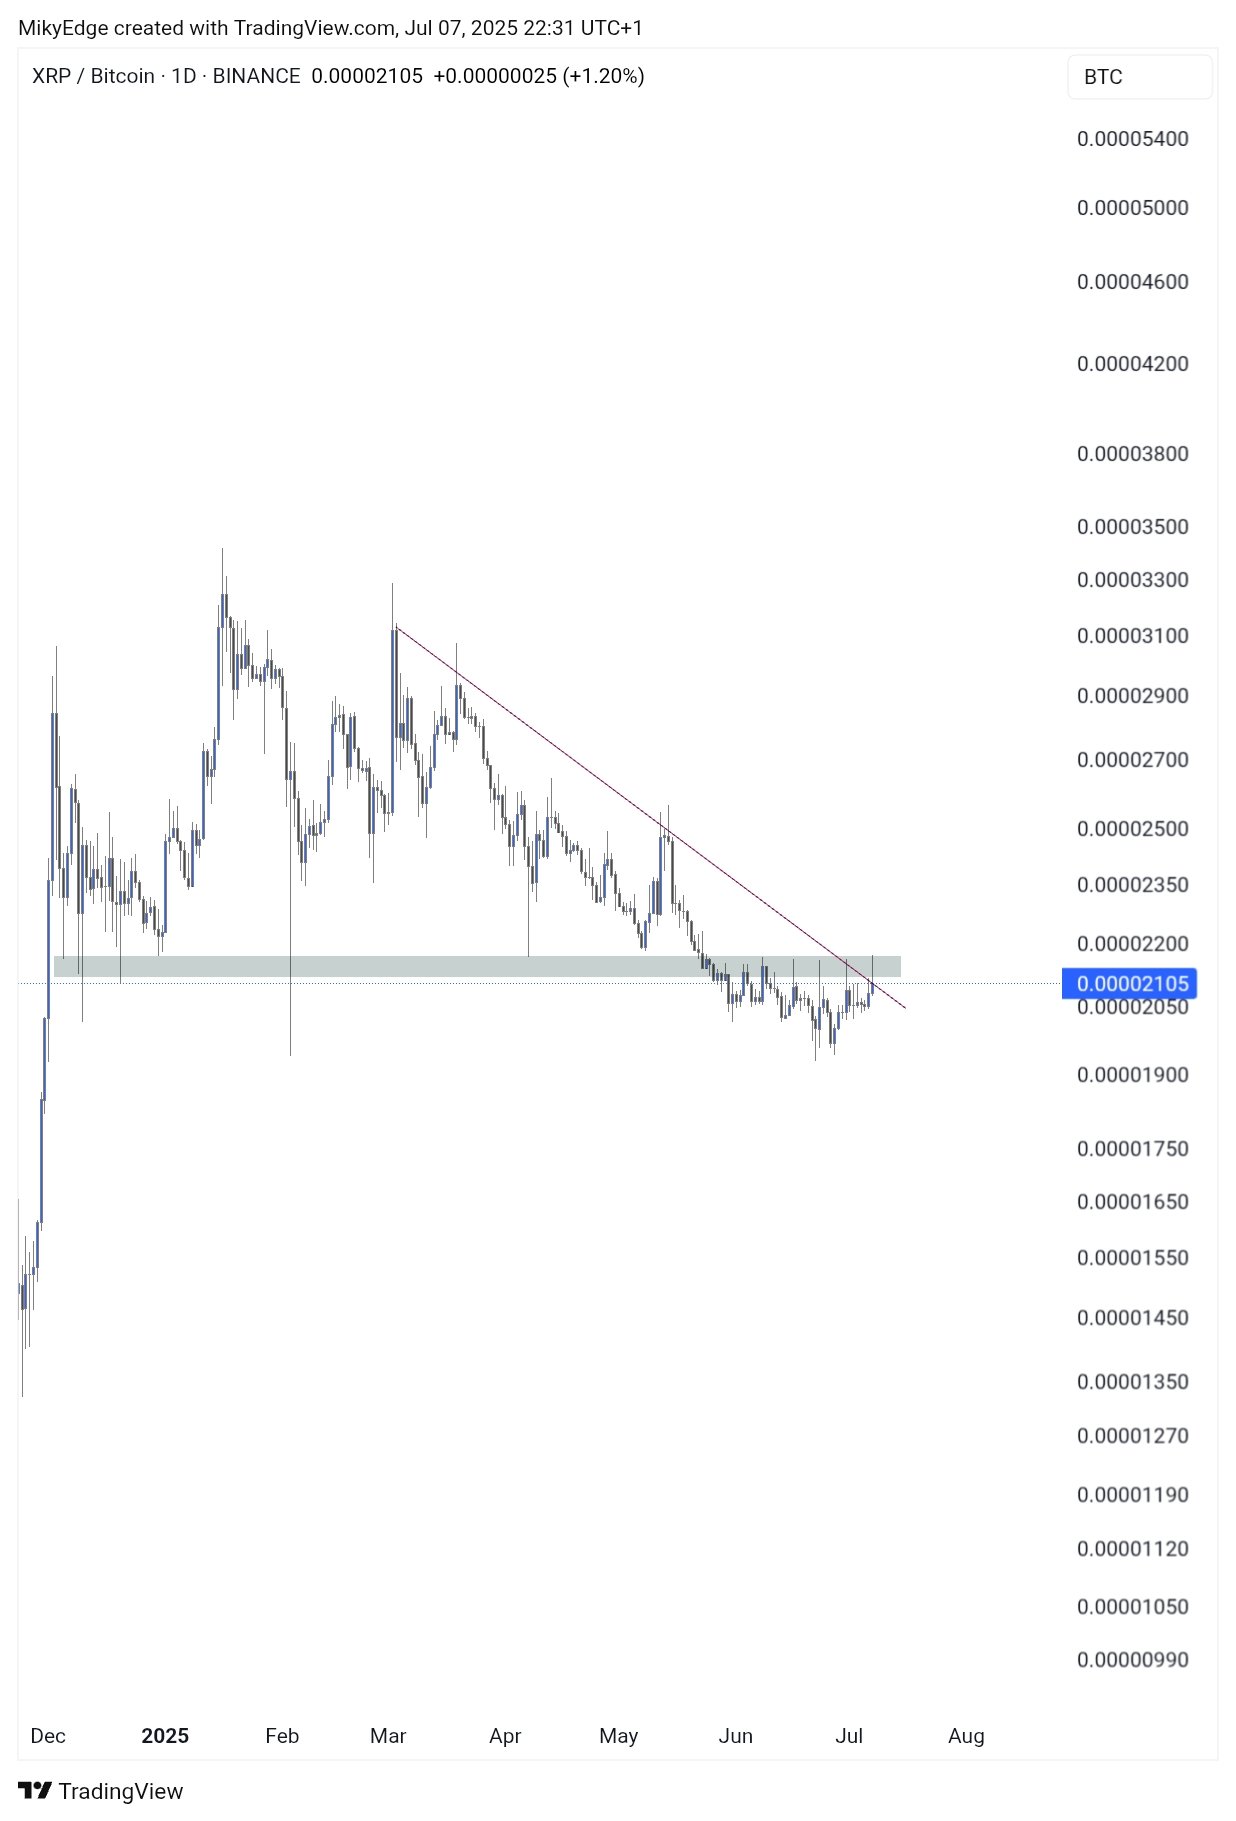
Previous analysis suggested that a breakout by XRP/BTC from a symmetrical triangle could translate to gains upwards of 70%, potentially pushing XRP’s price beyond the $3 threshold.
This content is for informational purposes only and should not be construed as financial advice. Investing and trading entail inherent risks, and individuals should conduct thorough research before making any decisions.