


Data reveals that long-term Bitcoin holders divested approximately 183,000 BTC over the past month. This includes a significant single-day outflow of around 8,000 BTC, according to on-chain analysis examining the movement of older Bitcoin holdings.
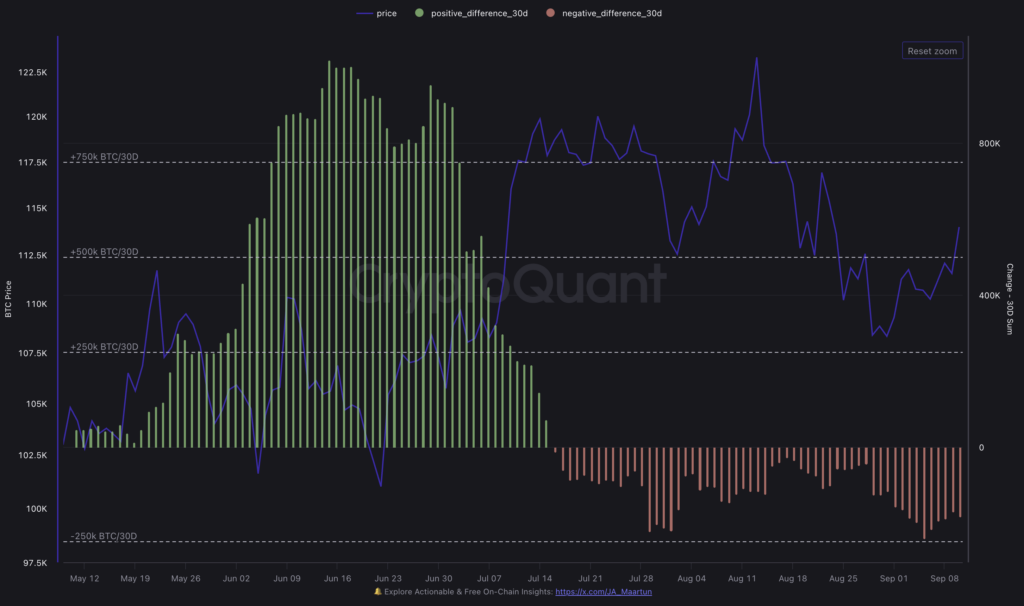
CryptoQuant’s data on the 30-day change in long-term holder positions suggests this monthly decrease is due to a period of distribution. Furthermore, metrics from Glassnode indicate that the substantial movement of BTC held long-term on a single day in early September represented the largest such event since the beginning of the year.
Concurrently, the volume of Bitcoin demonstrating a low historical tendency to be traded, often characterized as illiquid supply, attained a new peak of nearly 14.3 million BTC towards the close of August. Glassnode’s liquidity categorization assigns these coins to entities with minimal past spending activity. This particular category expanded even as Bitcoin prices moderated from their mid-August levels.
In essence, the movement of coins from older digital wallets occurred in parallel with increased accumulation by holders who rarely engage in transactions. This dynamic is crucial in determining the actual amount of Bitcoin available for trading.
The activity of spot Bitcoin ETFs introduces another element to consider. US-based ETF products experienced a notable influx of capital on September 10th, with total net inflows reaching approximately $757 million, as reported by SoSoValue’s aggregated data.
Farside Investors’ tracking table reflects a similar trend when consolidating daily figures across the ETF landscape. An increase in primary market demand coinciding with older coins returning to circulation presents a key test of market absorption: Are buyers stepping in to acquire this supply, or not?
Understanding the Metrics Used
The Long-Term Holder Net Position Change metric measures the 30-day shift in the quantity of Bitcoin held by long-term holders, showing a negative change of around 183,000 BTC over the past month.
CryptoQuant’s daily LTH “spent” metric tracks the quantity of older coins moved on the blockchain each day. This metric showed a spike in early September.
Both datasets define long-term holders as entities holding Bitcoin for at least 155 days and are adjusted to avoid double-counting. However, the first measures a rolling balance change, while the second measures daily transfer volume.
Historical market behavior offers context. During previous bull markets, long-term holders tended to distribute their holdings into periods of strength, with new demand absorbing the supply. This pattern then reversed once selling pressure diminished. Glassnode’s analysis has documented these handoffs, including late-cycle distribution and profit-taking around new highs.
These periods of distribution didn’t automatically end the cycle, but rather coincided with short-term peaks that resolved when new capital entered the market and capitalization increased.


5 Days to Smarter Crypto Moves
Learn how pros avoid bagholding, spot insider front-runs, and capture alpha — before it’s too late.
Brought to you by CryptoSlate
The present situation shares some of these characteristics. The amount of Bitcoin that rarely moves is at an all-time high, suggesting a significant base of long-term holders. However, a specific portion of older supply has recently entered the market.
If ETF allocations continue to generate increased buying pressure, the balance between these factors will quickly become apparent in realized flows, exchange balances, and the positioning of short-term holders. The absorption rate provides a straightforward measure. Given the fixed supply of Bitcoin, the question is whether primary market buyers, OTC desks, and shorter-term holders absorb the supply recently released by long-term holders.
Three key indicators will determine the outcome.
Firstly, a shift in the LTH Net Position Change back towards zero or into positive territory would indicate a decrease in the heavy distribution experienced over the past month. Historically, this has preceded periods where supply once again matured into long-term holdings.
Secondly, breadth and consistency across ETF issuers – for example, inflows into multiple ETFs (IBIT, FBTC, BITB, and ARKB) on the same days, rather than a single fund driving the activity – would suggest more sustainable primary market demand. This can be monitored through Farside’s issuer breakdown or SoSoValue.
Thirdly, profitability metrics for older coins, such as LTH-SOPR, can determine if sellers realized profits and are now inactive, or whether further supply may emerge if prices increase.
Reviewing Past Patterns for Perspective
Analysis of distribution phases suggests that spikes in long-term holder selling often cluster around short-term peaks, then subside as new buyers absorb the supply. The key difference in the current market is the presence of spot ETFs as ongoing buyers, a structural component absent in previous cycles, that can be tracked daily through issuer flow disclosures.
If ETF inflows remain strong while illiquid supply continues to increase, the result is a reduced tradable supply, even after older coins move. If ETF inflows decline while long-term holder distribution persists, the market holds excess supply that must be cleared at lower prices.
For real-time monitoring, use a simple overlay: the LTH 30-day net change from CryptoQuant, daily U.S. spot ETF net flows from SoSoValue or Farside, and the Bitcoin price. Highlight the early-September session with the year’s largest long-term holder selling. Mark the period in late August when illiquid supply neared 14.3 million BTC. Clarity is crucial: the goal is to assess whether the next set of buyers is absorbing the supply recently released by long-term holders.
The immediate outlook hinges on available data. The upcoming daily ETF data and the next monthly long-term holder balance change will reveal whether the 183,000 BTC distribution was absorbed by the market.