

Despite turbulent macroeconomic conditions, Bitcoin’s recent uninspired performance shouldn’t necessarily be seen as a contradiction, but potentially a matter of timing. According to the latest “Weekly Insight” report (Week 160, dated September 20, 2025), the apparent sluggishness may be temporary. Under the headline “Why Is Bitcoin Underperforming?”, @CryptoinsightUK adopts a distinctly optimistic outlook for the near future. “I’m starting this week with a bullish view, which I intend to maintain until I believe we’re nearing the peak of the market,” they stated. They acknowledge the market’s current late-cycle feel and anxious sentiment, adding, “That being said, I do believe we are closer to a high point than a low.” Yet, the writer anticipates that “we are approaching the most exciting, euphoric phase of this bull cycle.”
Why Is Bitcoin Lagging Behind?
The analysis emphasizes the impact of market sentiment, highlighting the constant stream of negative commentary on Crypto-Twitter. This is described as an ongoing cycle that generates views and gives the impression of a market that is more burdened than it actually is. “This delay can be irritating,” the author observes, noting that the Fear & Greed Index hasn’t registered consistently high readings of “extreme greed,” which were evident during the double-top observed in 2021.
Related Reading
Except for a short-lived surge of enthusiasm around late 2024 and early 2025—which coincided with XRP’s surge from $0.50 to $2.70, before finally reaching a high of $3.30 or $3.40—the index has mostly lingered in the neutral zone, falling far short of the peak conditions typically seen during cycle tops. This suggests that, despite the surrounding noise, the market has not yet demonstrated the classic signs of euphoria that usually precede market tops.
The report analyzes macro correlations to explain Bitcoin’s recent lack of movement. Focusing on the M2 money supply, the author highlights a previously established three-month correlation, “Bitcoin and the M2 money supply have tracked each other closely, but M2 has increased substantially in the last few months.” Consequently, observers must consider two possibilities: “Either the correlation no longer holds true, or Bitcoin simply hasn’t caught up yet.”
The same reasoning is extended to gold. While leadership has switched between the two assets, gold’s upward movement means a Bitcoin catch-up would “suggest a rise towards at least $135,000, compared to its current valuation of approximately $115,000.” Equities present a similar narrative: key indices like the Nasdaq, Dow Jones, S&P, and Russell 2000 are either at or approaching new record highs, whereas Bitcoin has mostly trended sideways, “indicating that it might be lagging behind.”
Market microstructure provides an additional perspective. The report emphasizes the relationship between visible liquidity levels and consolidation patterns. The report stated that “Every single time there has been a significant liquidity build up, Bitcoin has eventually run through it.” As the price has increased, the existing liquidity has increased. The author stated “red indicates the deepest liquidity, orange the next, and green the lightest.” A breakout tends to occur when the deepest pockets of liquidity are depleted.
The author gives the example of “the run from $70k to $100k,” as an example where “heavy consolidation was followed by an explosive breakout.” The current liquidity levels suggest that “is pointing to a move toward $140k or higher,” aligning with the projection based on gold’s performance. “I often explain price action like stored energy,” the author said. “The longer it consolidates and charges, the bigger the eventual release.”
What Is the Role of Altcoins?
The report makes a confident statement about altcoins. It suggests that Total2 (crypto excluding BTC) and Total3 (crypto excluding BTC and ETH) have both reached “price discovery” on a daily candle close. Total2, “closed a weekly all time high and is now extremely close to closing a second consecutive weekly high,” and Total3 is, “right on the edge of breaking into new all-time highs.”
From a structural perspective, Total2 looks like it has completed Wyckoff accumulation, as well as a cup and handle. Total3 looks like it has been carving out an ascending triangle for a continuation of the move. The fact that “alts pressing price discovery while Bitcoin is preparing to push to new highs” is exactly what the author believes to be a “mania or euphoria.” They also added that “it is exactly why I am fully positioned in altcoins here.”
Related Reading
The author stated that Bitcoin dominance is poised to decline, and believes “we are heading down to at least the 35.5 percent level, and potentially even into the low 20s.” This prediction is backed up by historical observations. The report highlights that since the 2017 highs, Bitcoin dominance “dropped by 62 percent,” and since the 2021 highs, it “dropped by 46 percent,” accelerating on a monthly decline.
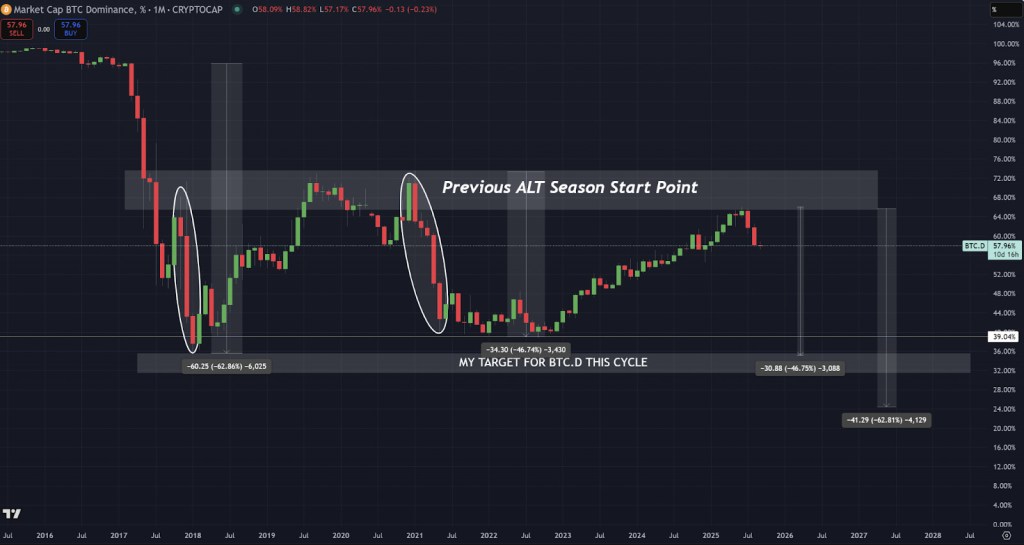
Should such a decline happen while BTC reaches new peaks, then “a face melting altcoin rally that most people cannot even imagine right now,” might take place. Beyond market dynamics, legislative shifts in the leading financial economy and a potential wave of trillions of dollars driven by stablecoins and the Clarity Act, which could be passed by November, could be positive catalysts for the market.
What Is The Future of Bitcoin’s Price Action?
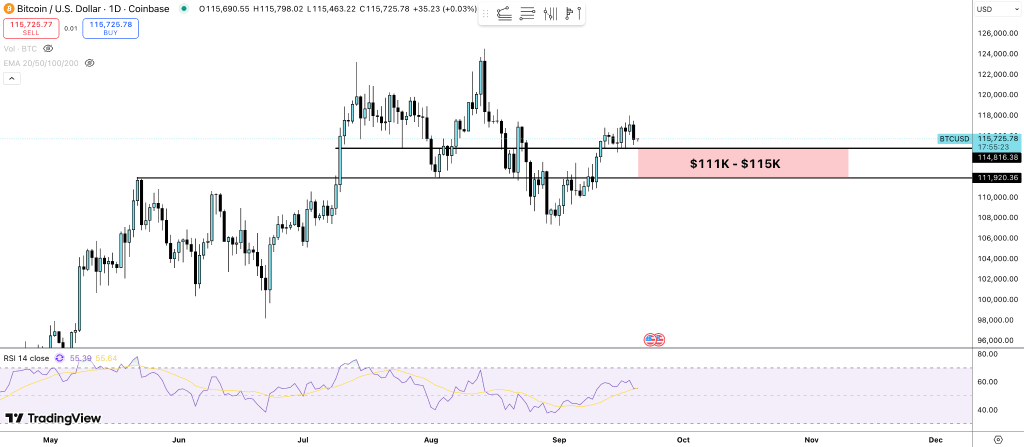
The issue is concluded by an analysis by @thecryptomann1, who examines the short-term risks involved. They state that Bitcoin is, “Decision time… is fast approaching,” adding that the area between $111,000 and $115,000 is, “huge.” Should the $111,000 area be lost, “the liquidity around the $105K range feels inevitable.” Order-book heatmap data shows “a chunk of liquidity sitting here across all exchanges,” which would indicate greater volatility, should those areas be tested. As the analyst states, “I’m unsure which way the market swings,” and labels aggressive speculation, “dangerous” in the current environment.
A second strategy involves USDT dominance (USDT.D), in which the analyst inverts the chart to track risk appetite. The metric has been, “stuck in [a] range for the past 15 months or so,” while “looks like a chart that’s on its way to revisit its highs (which, in reality, are the lows).” The target is 3.76%. They stated that the logic is deliberately simple – range structure, holding the 0.5 retracement, trend persistence, and defending a key “blue box” support – which points towards risk continuing to advance before stablecoin dominance grows again. “The way I’m playing it is swinging long until USDT.D hits 3.76%, then de-risking. That’s not financial advice, just the way I’m approaching it.”
They further stated that a potential outcome may be that “$BTC pushing up to $120,000, everyone panicking and going long, fueling the liquidity below us, and then sweeping the lows.” They cautioned that dropping straight to “low $100,000 range” would be, “too obvious,” but admitted that both downside and upside liquidity are attractors due to a compressed-volatility environment. The mood for traders is simply summed up as “it’s getting squeaky bum time.”
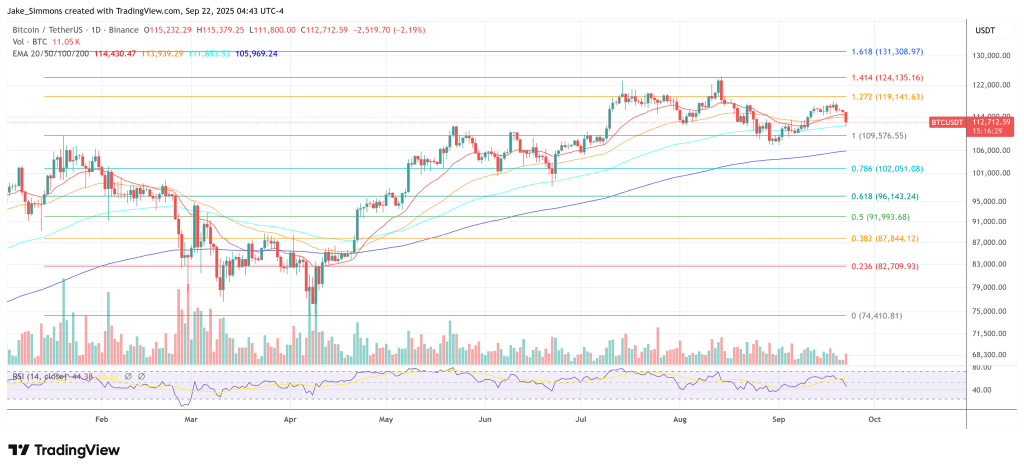
At the time of publishing, Bitcoin was trading at $112,712.
Featured image created with DALL.E, chart from TradingView.com