

The cryptocurrency Bitcoin is facing renewed downside pressure as market participants exhibit increased caution. Following several weeks characterized by significant price swings, analysts are suggesting that Bitcoin might decline below the $110,000 support level in the near term if current market dynamics persist. A move of this magnitude would signal a notable shift in market sentiment, highlighting a considerable weakening of prior bullish momentum.
Related Reading
Conversely, some experts maintain a more positive perspective, asserting that Bitcoin demonstrates resilience at its current price point. These individuals anticipate that the market could stabilize and recover to higher price levels as buying activity resumes, especially if broader economic factors or substantial institutional investments introduce new positive energy.
Prominent analyst Darkfost recently provided valuable insights into current on-chain activity, noting a potentially troubling pattern among holders of Bitcoin for a medium duration. Darkfost pointed out that Bitcoin held for between six and twelve months is consistently being transferred to exchanges, indicating a distinct selling pattern, although confirming that a single entity is responsible remains challenging. More on this topic can be found here.
Long-Term Holders Contribute to Market Headwinds
Darkfost clarifies that long-term holders (LTHs) currently possess the majority of the circulating Bitcoin supply, estimated at approximately 80-85%. This concentration of ownership emphasizes the inherent stability of Bitcoin’s investor base; however, it also implies that selling activities initiated by this group exert a considerable influence on price fluctuations. When LTHs transfer their coins to the market, it usually reflects either profit-taking behavior or an alteration in their market outlook, both factors that can negatively impact short-term price trends.
The Bitcoin Spent Output Age Bands (SOB) indicator supports this observation, indicating that recent on-chain movements correlate with activities of these experienced holders. With coins aged between six months and several years becoming actively circulated, the data suggests renewed selling pressure, which helps explain the downward momentum affecting Bitcoin’s price recently. This trend is in line with the corrective phase Bitcoin has experienced since failing to maintain the $115,000 level, as the market assimilates the distribution of coins from groups that previously maintained their holdings through periods of volatility.
Despite these near-term challenges, fundamental indicators continue to underpin a positive longer-term outlook. Factors such as increased institutional accumulation, declining Bitcoin reserves on exchanges, and the expanding correlation between Bitcoin and broader market liquidity cycles provide a basis for higher prices once selling pressures diminish.
The upcoming weeks are anticipated to be critical. If Bitcoin can sustain its position above vital liquidity zones and overcome the impact of LTH distribution, it could regain the necessary momentum to re-challenge its highest historical price points. Conversely, failure to maintain these critical support levels could prolong the current correction, further testing market confidence. Ultimately, while the actions of LTHs are presently influencing price activity, underlying structural demand for Bitcoin suggests that its long-term trajectory remains favorable.
Related Reading
BTC Maintaining a Key Demand Threshold
Bitcoin (BTC) is currently trading around $112,567, recovering slightly from intraday lows near $111,135. Analysis suggests that Bitcoin remains under pressure after encountering resistance in the $117,000 to $118,000 range earlier in the week. The $123,217 area continues to serve as a key resistance level, limiting upward movement since July, while immediate support is located in the $110,000 to $112,000 range.
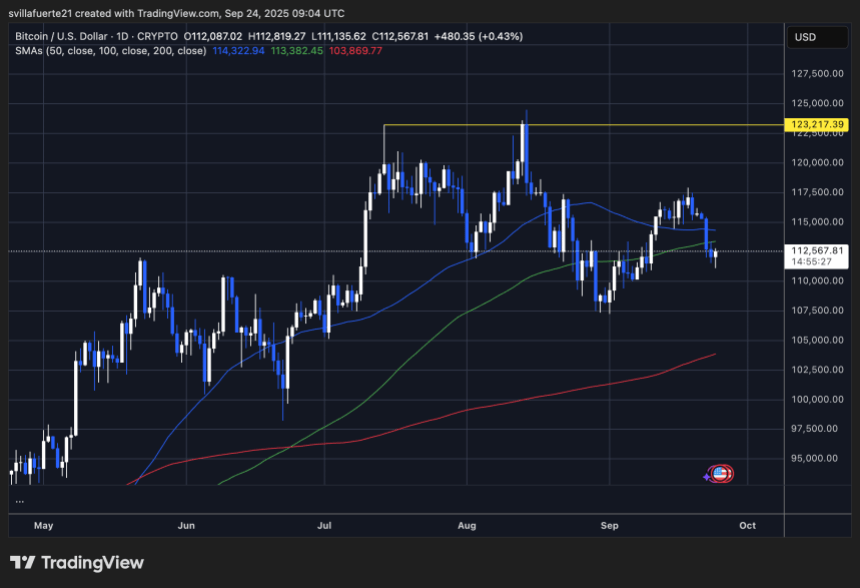
The 50-day Simple Moving Average (SMA) at $114,322 and the 100-day SMA at $113,382 have now transitioned to resistance levels following the recent downturn, which suggests that short-term momentum is weakening. Failure to reclaim these levels soon could lead to a further decline towards the 200-day SMA near $103,869, an area that aligns with long-term support.
Related Reading
Current market activity indicates that buyers are attempting to protect the $112,000 level, which has served as a significant zone of liquidity in recent months. However, repeated tests of this level increase the risk of a breakdown should bullish momentum fail to return.
Featured image from Dall-E, chart from TradingView