

The landscape of Bitcoin price options is displaying a tale of two timelines. In the immediate future, the market appears to be tightly controlled by the hedging activities of dealers. However, looking towards the end of the year, the setup indicates a greater potential for price fluctuations.
Currently, Bitcoin is hovering around $113,500, a decrease from its August peak of approximately $119,000, but still above its early July levels. This places it squarely within the parameters of the short-term option structures expiring this week, where market mechanics dominate and significant effort is required to shift the market in either direction.
October 1st provides a clear example. The gamma curve exhibits a sharp peak between $113,000 and $115,000, while the delta profile experiences a significant shift in the same zone. This signifies that market makers are most sensitive to price variations within this range, and their hedging strategies naturally tend to pull the market back when it attempts to deviate.
Barring substantial buying or selling activity in the spot or perpetual futures markets, the price tends to remain anchored in this range. This explains why options traders often refer to “gravity” levels around major expiration dates. Hedgers are not attempting to predict direction; they are simply maintaining balanced books, resulting in suppressed volatility.
However, the outlook changes considerably further along the timeline. December 26th marks the date with the largest volume of open interest on Deribit. Yet, the gamma for this expiration is relatively flat. A flat gamma surface implies that dealers are less sensitive to minor price movements, and they are not compelled to continuously adjust deltas as the price fluctuates.
This makes the market more dependent on its trajectory. If Bitcoin rallies, there will be less resistance from hedgers to slow it down. Conversely, if it declines, there will be less support from hedgers to cushion the fall. Combined with the substantial notional value expiring at the end of the year, this creates conditions for higher volatility, where directional movements can occur without the constraints of mechanical stabilizers.
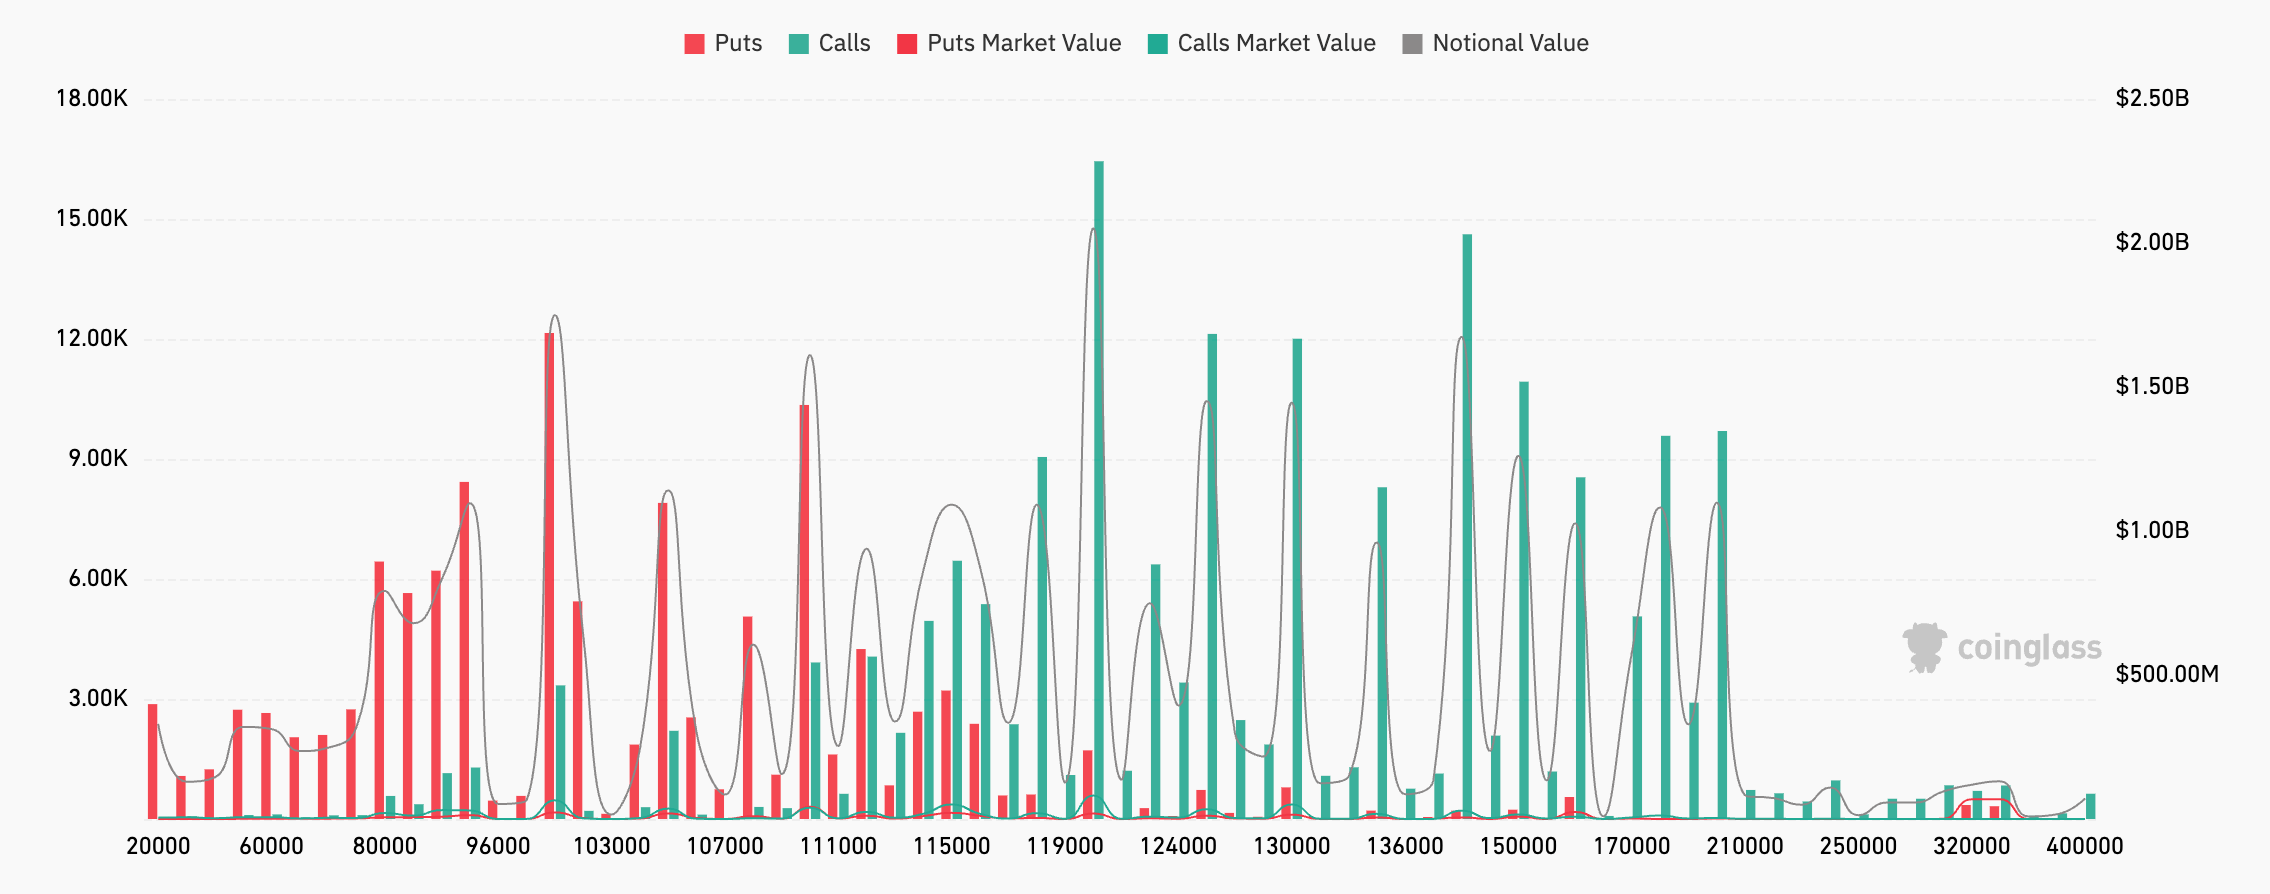
This is also evident in the distribution of strike prices. Call options are concentrated at $119,000, $124,000-$130,000, and again at $150,000 and $170,000. Beyond these levels, there is a speculative tail extending to $320,000-$400,000. Put options are clustered between $80,000 and $111,000, with a significant concentration around $105,000-$111,000. This represents the playing field established by the market.
Currently, the spot price is below the first major call option barrier at $119,000 and above the dense put option zone in the low $100,000s. The put/call open interest ratio is only 0.37, indicating a dominance of upside-oriented structures.
Traders are positioning themselves for breakouts rather than seeking downside protection, suggesting that a break above $119,000 would require hedgers to adjust their deltas upward, potentially pushing the price towards the $124,000-$130,000 range. Conversely, if the spot price declines towards $108,000-$111,000, the put options in that area will lose value, assisting writers in absorbing the flow and mitigating downside pressure, unless new selling emerges.
This asymmetry highlights the significance of the December 26th expiry. Call options are prevalent, and the absence of a prominent gamma peak could allow rallies to progress more freely once resistance levels are breached.
On the downside, support appears weaker. Without a substantial cluster of protective put options further down the line, breaches below the $105,000-$111,000 zone would require fresh risk-off demand to sustain downward momentum. This creates a market dynamic where short-term stability can transform into year-end volatility, with the calendar becoming as influential as the price itself.
Exposure is light in the immediate weekly options after October 1st, followed by significant concentrations at October 31st and December 26th, and a secondary peak in March 2026. These are the dates when liquidity shifts, hedgers reposition, and volatility either contracts or expands. This suggests that October may be a period of relative calm, while the latter half of the fourth quarter could bring significant market activity.