


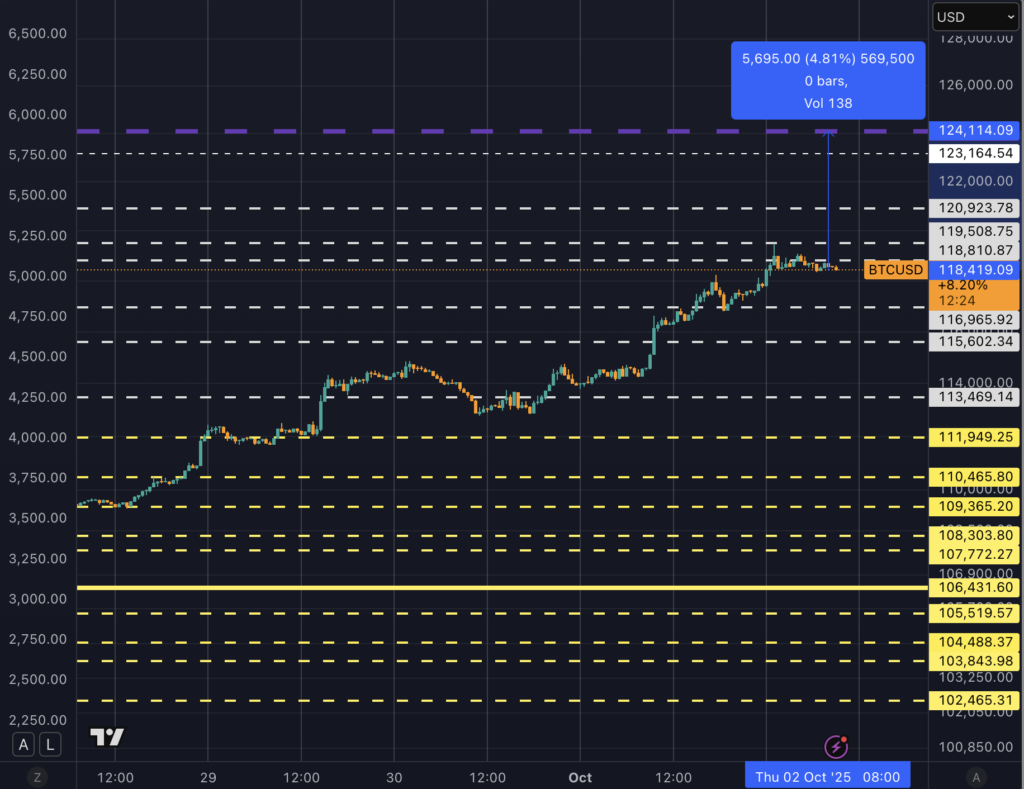
The price of Bitcoin hovered around $118,500 on Thursday. This upward movement coincided with factors such as increased expectations of interest rate cuts due to a potential U.S. government shutdown, a weakening dollar, and a significant short squeeze observed across various derivatives platforms.
The price of gold reached new historical highs, trading at approximately $3,895 per ounce. This rally was supported by growing anticipation of rate reductions and a dollar index holding steady around 97.6. Historically, such circumstances often favor Bitcoin’s performance, especially when real yields decline. Data from the Treasury market indicated that 10-year TIPS yields were near 1.77% to 1.78%, reinforcing a macroeconomic influence that aligned with the price increase.
The day’s surge followed a period of repositioning that reduced leverage throughout late September. This left the market particularly sensitive to macroeconomic news and sudden shifts in capital flow. The previous week witnessed $1.7 billion in liquidations within the cryptocurrency space. This washout is typical to reduce directional conviction until a new market driver arises.
According to data from CoinGlass, liquidation maps pointed to concentrated short positions within the $118,000 to $120,000 range before the breakout. Once those positions were cleared, these levels frequently act as stepping stones for further price increases, assuming demand in the spot market remains strong.
Bitcoin’s current price is just 4.8% below its all-time peak. Should the short squeeze persist, we might observe price discovery later in what is known as ‘Uptober.’
Funding rates for major perpetual swap contracts showed a slightly positive bias leading into the price increase. Specifically, Binance perpetuals registered around +0.0084 percent in late September. This indicates a moderately bullish sentiment, conducive to a sustained uptrend without suggesting immediate overextension.
The spot market continues to be a key driver.
Data provided by Farside Investors indicates a renewed surge in activity for U.S. spot Bitcoin ETFs. Yesterday experienced a net inflow of $645 million, contributing to a multi-day total exceeding $1.6 billion.
Historical observations from 2025 suggest that when daily net inflows consistently surpass $500 million for two consecutive trading sessions, prices tend to increase by an additional 3% to 7% over the following 72 hours. Conversely, two or more consecutive sessions with outflows exceeding $300 million have typically coincided with weaker price action and a negative shift in funding rates.
These capital flows serve as the mechanism connecting macroeconomic narratives with actual trading activity. On days characterized by a weaker dollar and declining real yields, ETF creation activity frequently carries this macroeconomic sentiment through to the market close.
Analysis of on-chain data emphasizes a straightforward metric traders can monitor. According to Glassnode’s recent Week On-Chain report, the realized price for short-term Bitcoin holders is near $111,000. This price level serves as a critical support level for maintaining upward momentum.
Sustained trading above this level historically reinforces the existing uptrend. Conversely, a break below this level could lead to a rapid decline toward previously established support levels between $106,000 and $108,000, where liquidations and buying interest have been more concentrated this quarter.
This technical level is also consistent with the observable liquidation map, where remaining concentrations around $120,500 to $121,000 represent potential targets if capital flows remain strong.
Macroeconomic conditions provide context for timing.
The U.S. government shutdown, which started on October 1st, has complicated the flow of economic data leading up to the Federal Reserve meeting on October 29th. Consequently, traders have increased the likelihood of a 25 basis point rate cut as a protective measure against prolonged uncertainty.
In this environment, the decline in the dollar toward the high-97s and the gradual decrease in real yields has coincided with increased demand for both gold and Bitcoin. This correlation tends to re-emerge when inflation-adjusted interest rates are more influential than positive economic surprises.
The most significant indicator is the trading activity itself, given that Bitcoin’s primary point of access for spot transactions is now through ETFs, which channel macroeconomic shifts into daily creation and redemption activity.
The options market offers another perspective on short-term price movements. Data from Deribit indicates that approximately $8 billion worth of Bitcoin options are scheduled to expire on October 31st, with significant concentration around strike prices of $120,000 and $125,000.
Hedging activity by options dealers can keep prices near these strike prices when flows are relatively balanced. This can explain why post-breakout price action often consolidates around these strike prices before a new surge from ETF flows or macroeconomic events triggers a new movement. Volatility skew and implied volatility (DVOL) leading up to the end of the month are key indicators of whether the current price movement is driven by options premiums or by spot market activity.
Gold prices have reached record highs due to hedging related to the government shutdown, while Bitcoin has mirrored this movement with increased volatility. This relationship typically emerges when the dollar’s direction and real interest rates are the dominant factors.
BlackRock’s IBIT has become the fastest-growing ETF in history. This underscores the continuing relevance of the structural demand narrative when macroeconomic conditions provide the backdrop. The comparison isn’t about abstract principles of sound money but about the tangible effect of lower discount rates meeting a high-volatility asset with readily available creation units.
Near-term scenarios should be based on observable data inputs.
A potential move toward $121,000 to $125,000 is more likely if total U.S. spot ETF inflows exceed $500 million for two more consecutive trading sessions, the dollar index stays below 98, and 10-year TIPS yields move toward 1.7 percent, while funding rates remain moderately positive and liquidation points above $118,000 continue to be cleared.
A high-volatility range between $112,000 and $121,000 is likely if ETF activity fluctuates between plus or minus $200 million, government shutdown developments cause the dollar to move back and forth, and options positions around $120,000 exert downward pressure until the Oct. 31st expiry date, based on Deribit data and historical patterns.
A pullback toward $106,000 to $111,000 could occur if there are two or more days of ETF outflows exceeding $300 million, the dollar index rebounds above 99, real yields rise back toward or above 1.9 percent, and the $111,000 level for short-term holder’s realized price is decisively broken.
To ensure the analysis remains relevant, these key indicators can be monitored throughout the day and used to guide trading decisions.
| Signpost | Current/Reference | Bullish if | Bearish if |
|---|---|---|---|
| Aggregate US spot ETF net flow | See Farside, SoSoValue | ≥ +$500M for ≥2 days | ≤ -$300M for ≥2 days |
| Dollar Index (DXY) | ~97.6 (Reuters) | < 98 sustained | ≥ 99 sustained |
| 10-yr TIPS yield | ~1.77–1.78% | Drift toward 1.6–1.7% | ≥ 1.9% |
| STH realized price | ~$111,000 (Glassnode) | Daily close above | Daily close below |
| Liquidation pockets | $118K–$121K (CoinGlass) | Cleared with steady funding | Refill with negative funding |
| Options OI concentration | $120K/$125K (Deribit) | Pin breaks on flow impulse | Pin holds into Oct 31 |
The core driver is the mechanics of market action, not subjective commentary.
ETF creation activity converts macroeconomic factors into traded volume, the concentration of liquidations translates volume into momentum, and the on-chain cost basis provides a clear benchmark for risk assessment. This is consistent with how many institutional funds monitor trends.
The upcoming reports of U.S. ETF inflows will determine whether the resurgence observed in the past month is continuing alongside a weaker dollar.
The $111,000 level for short-term holders remains the boundary separating a further expansion from a period of consolidation. The remaining liquidation clusters above $120,000 are now near enough to be significant if flows persist before options hedging re-establishes control.
The market’s near-term direction will be determined by these factors, rather than by speculative opinions. The final balance of ETF creations and redemptions will show whether the upward pressure is strengthening or fading.
Bitcoin Market Data
At the time of press 10:34 am UTC on Oct. 2, 2025, Bitcoin is ranked #1 by market cap and the price is up 2.1% over the past 24 hours. Bitcoin has a market capitalization of $2.37 trillion with a 24-hour trading volume of $69.58 billion. Learn more about Bitcoin ›
Crypto Market Summary
At the time of press 10:34 am UTC on Oct. 2, 2025, the total crypto market is valued at at $4.08 trillion with a 24-hour volume of $193.23 billion. Bitcoin dominance is currently at 58.05%. Learn more about the crypto market ›