

Key Takeaways:
-
Strong inflows into Bitcoin spot ETFs indicate renewed bullish sentiment, potentially leading to a new peak price.
-
Binance Coin (BNB) shows strong recovery momentum, and numerous other altcoins are close to surpassing key resistance levels.
Bitcoin (BTC) approached $123,900 on Friday, continuing its push toward its historic high of $124,474. This resurgence is fueled by robust buyer demand, with U.S.-based spot Bitcoin exchange-traded funds witnessing significant inflows of approximately $2.25 billion since the start of the week, according to data from Farside Investors.
Market observers predict Bitcoin could soon reach a new record high. Charles Edwards, founder of Capriole Investments, mentioned in an interview with Cointelegraph that Bitcoin could potentially surge to $150,000 by year’s end, as investors increasingly seek out Bitcoin as a safe-haven asset, similar to gold.
Despite the largely positive outlook, some analysts advise caution. A trader known as Roman pointed out on X (formerly Twitter) that the Relative Strength Index (RSI) on Bitcoin’s price chart is displaying a bearish divergence on both weekly and monthly time scales. Roman urged traders to exercise caution in the current market environment.
Will Bitcoin break through to a new all-time high, potentially sparking a broader rally in the altcoin market? We examine the charts of the top 10 cryptocurrencies to gain insights.
Bitcoin Price Forecast
Bitcoin overcame resistance at $117,500 on Wednesday, indicating renewed strength from buyers.
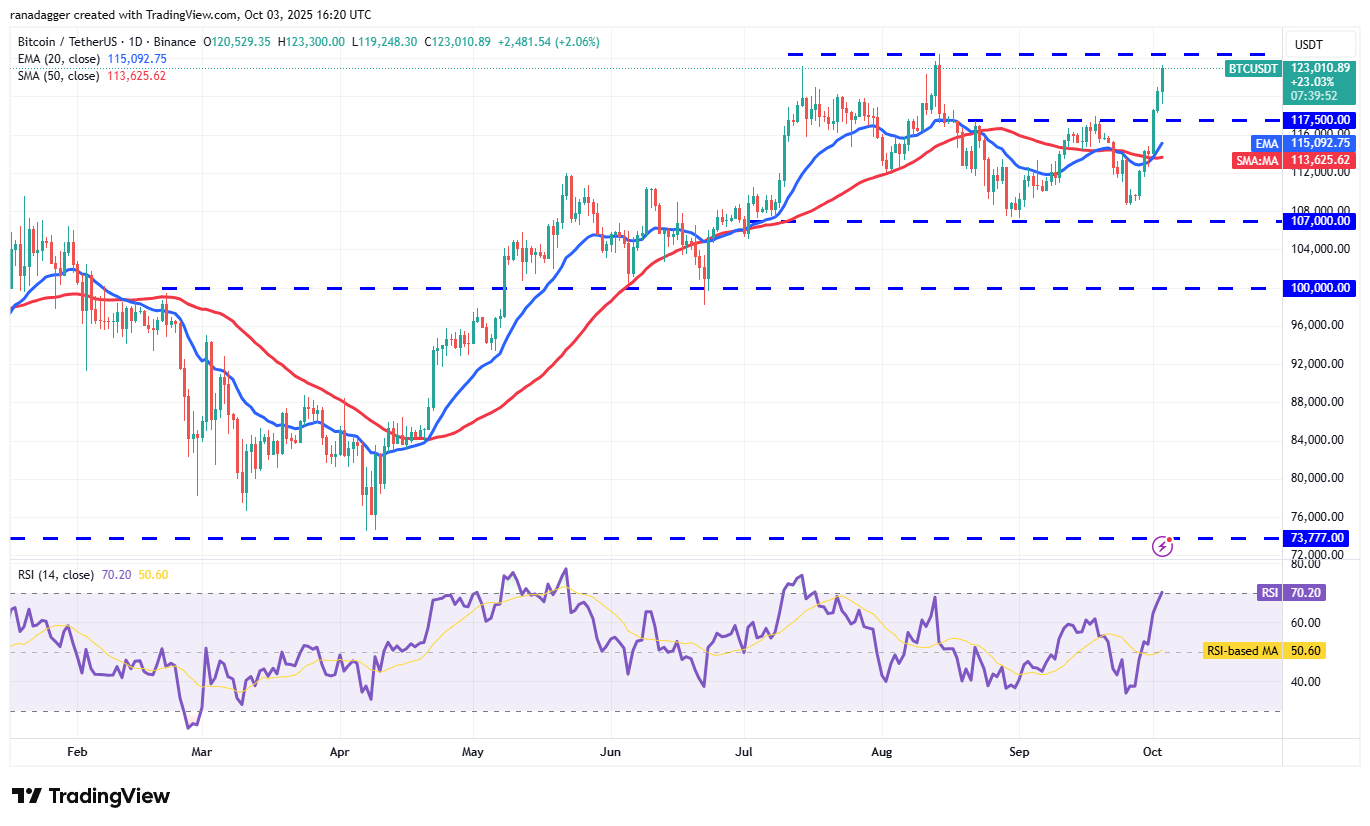
The BTC/USDT pair is approaching its all-time peak of $124,474, where sellers are anticipated to put up considerable resistance. A sharp reversal from this level, breaking below $117,500, would suggest that sellers are active. Bitcoin’s price could then fluctuate between $107,000 and $124,474 for a period.
However, if buyers manage to push the price above $124,474, this would signal a continuation of the upward trend, potentially leading to a rally toward $141,948.
Ether Price Forecast
Ether (ETH) closed above its 20-day exponential moving average ($4,309) on Wednesday and reached a key resistance line on Friday.
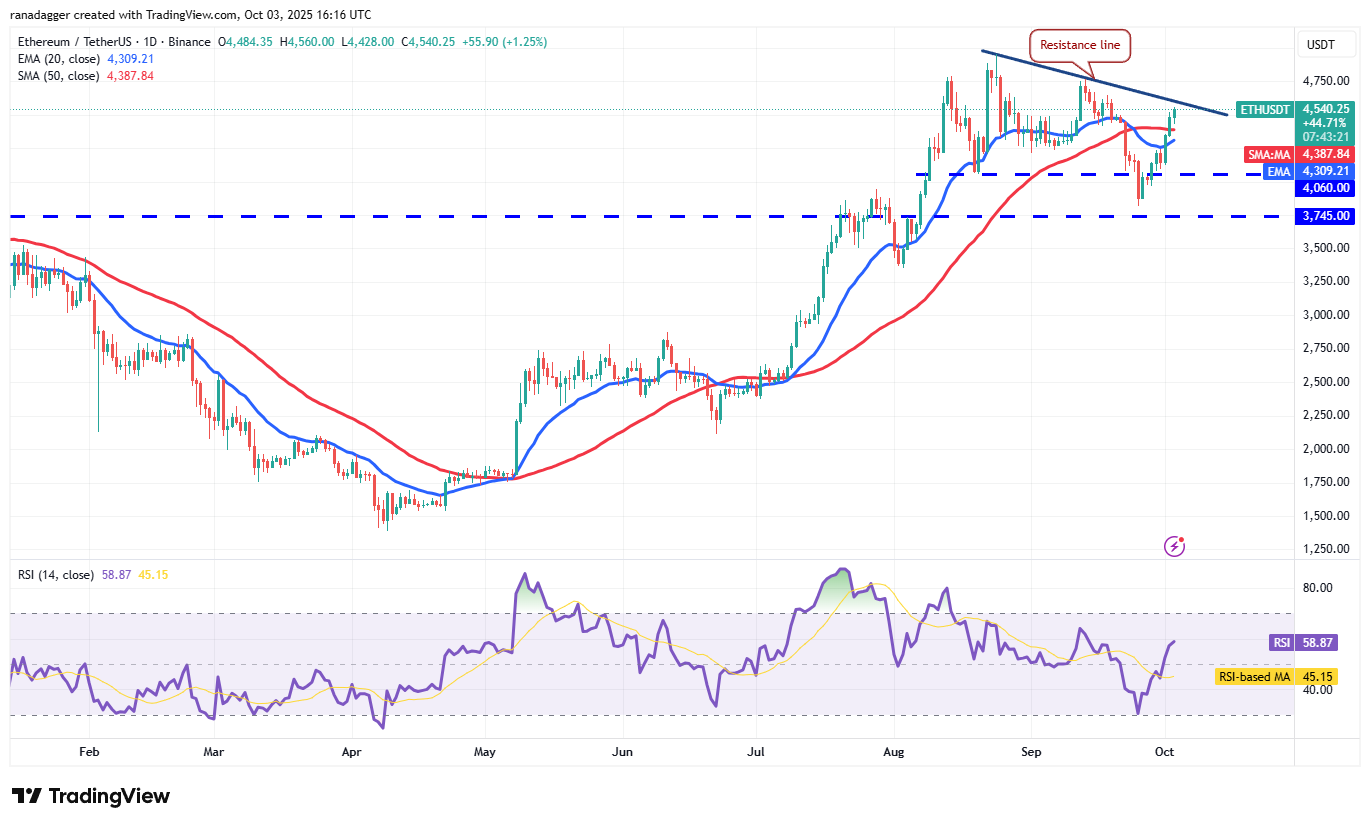
The gradual upward turn of the 20-day EMA and the RSI entering positive territory hint at a slight advantage for buyers. Sellers are expected to challenge the recovery at the resistance line. If buyers overcome this, the ETH/USDT pair might retest its all-time high of $4,957.
To counter the bullish momentum, sellers must push the price below the 20-day EMA, potentially triggering a drop toward $4,060.
XRP Price Forecast
On Thursday, buyers propelled XRP above the downtrend line, but couldn’t sustain a close above it.
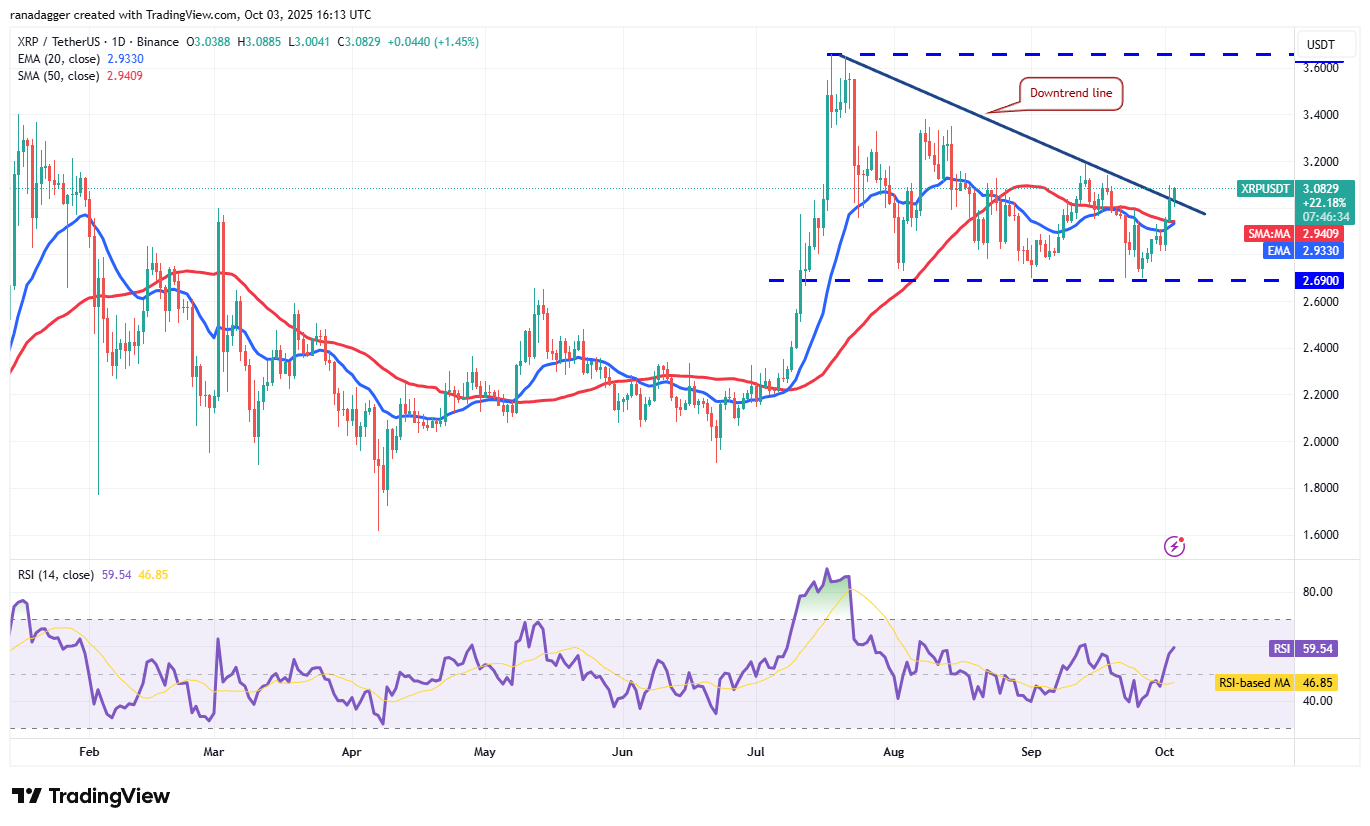
Buyers are again attempting to maintain XRP’s price above the downtrend line. Success would invalidate the bearish descending triangle pattern, potentially opening the way for a climb to $3.20, followed by $3.38.
This positive outlook would be undermined if the price reverses and falls below the moving averages, suggesting that the breakout above the downtrend line may have been a false signal.
BNB Price Forecast
BNB soared to a new all-time high above $1,084 on Thursday, extending its gains into Friday.
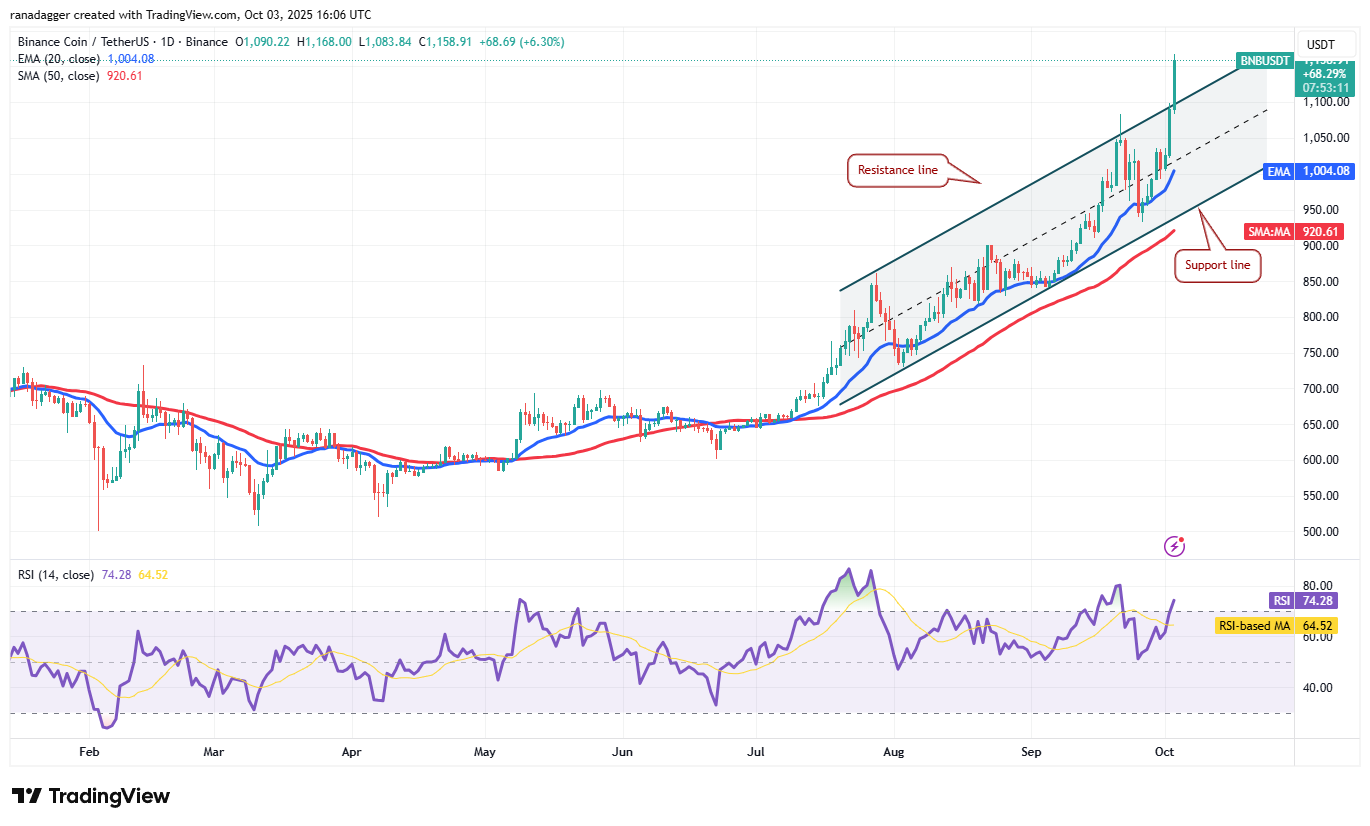
The BNB/USDT pair’s breakout above the ascending channel suggests increasing bullish strength. While there’s minor resistance around $1,173, surpassing this level could extend the rally toward $1,252.
The channel breakout level and the 20-day EMA ($1,004) are likely to serve as strong support. Sellers would need to push BNB’s price below $930 to indicate a potential short-term peak.
Solana Price Forecast
Buyers regained control of Solana, pushing it back above the uptrend line on Wednesday, suggesting a possible end to the corrective phase.
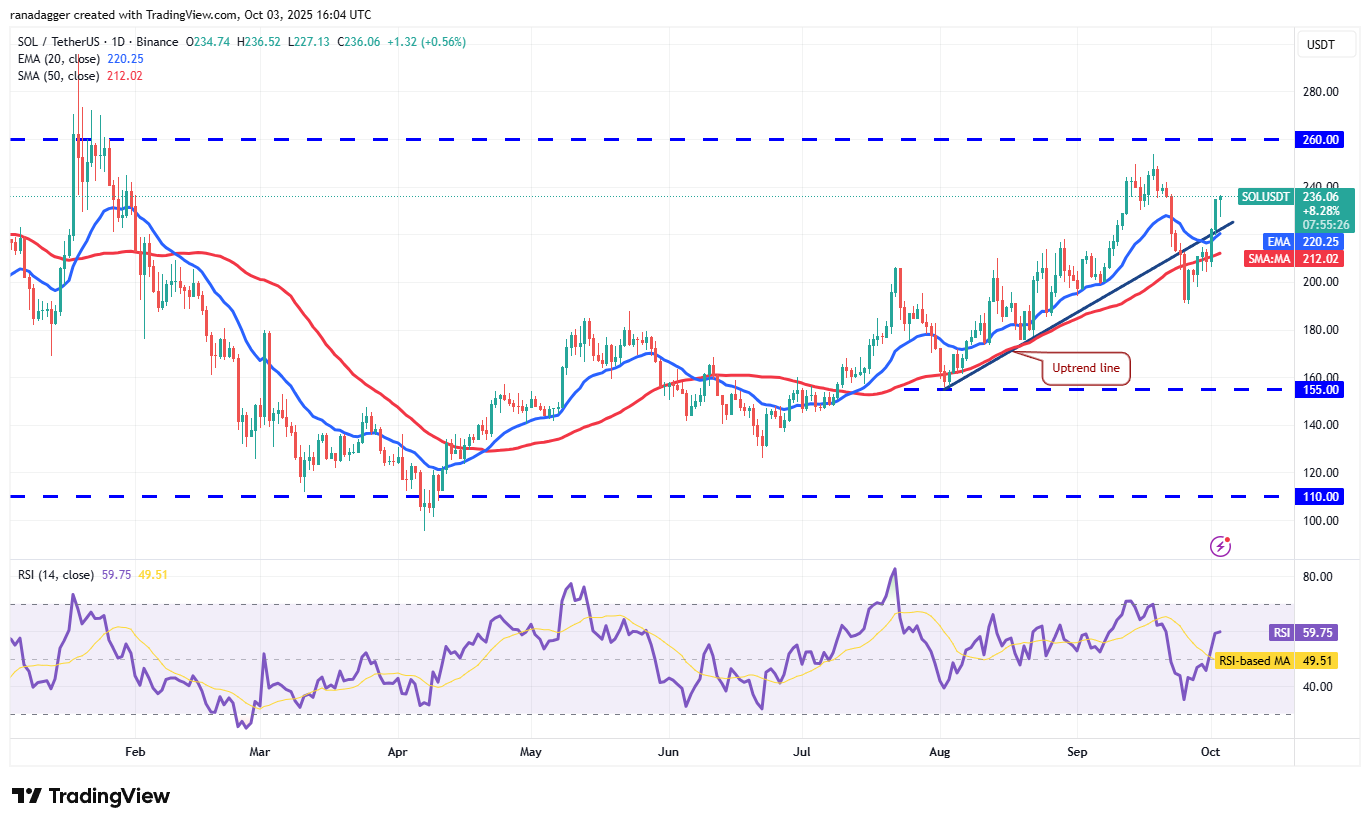
Any retracement from the current level is expected to find support at the 20-day EMA ($220). If it holds, the SOL/USDT pair could rally to the overhead resistance at $260, a level where sellers are expected to mount a strong defense. A sustained break above $260 could propel Solana to $295.
Sellers need to push the price below the 50-day simple moving average ($212) to regain control.
Dogecoin Price Forecast
Dogecoin (DOGE) closed above the 20-day EMA ($0.24) on Wednesday, indicating a slight advantage to the bulls.
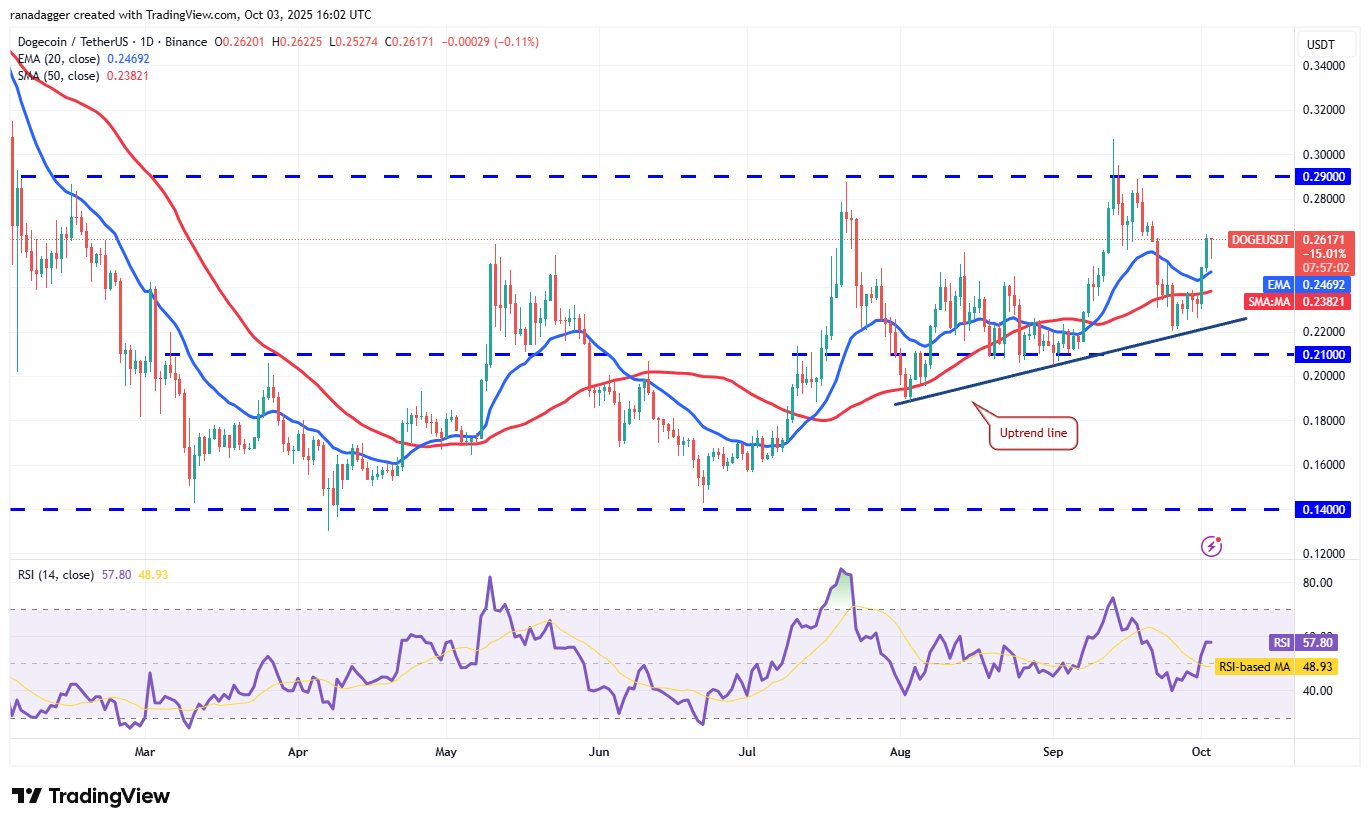
While the DOGE/USDT pair remains within a broad range of $0.14 to $0.29, the price action is forming an ascending triangle pattern. Buyers need to achieve a close above $0.29 to complete this bullish setup, potentially leading to a rally toward the pattern target of $0.39.
The bullish pattern will be invalidated if the bears pull the price below the uptrend line, suggesting that the pair may extend its consolidation phase.
Cardano Price Forecast
Cardano’s (ADA) recovery rose above the 50-day SMA ($0.86) on Thursday, indicating a reduction in selling pressure.
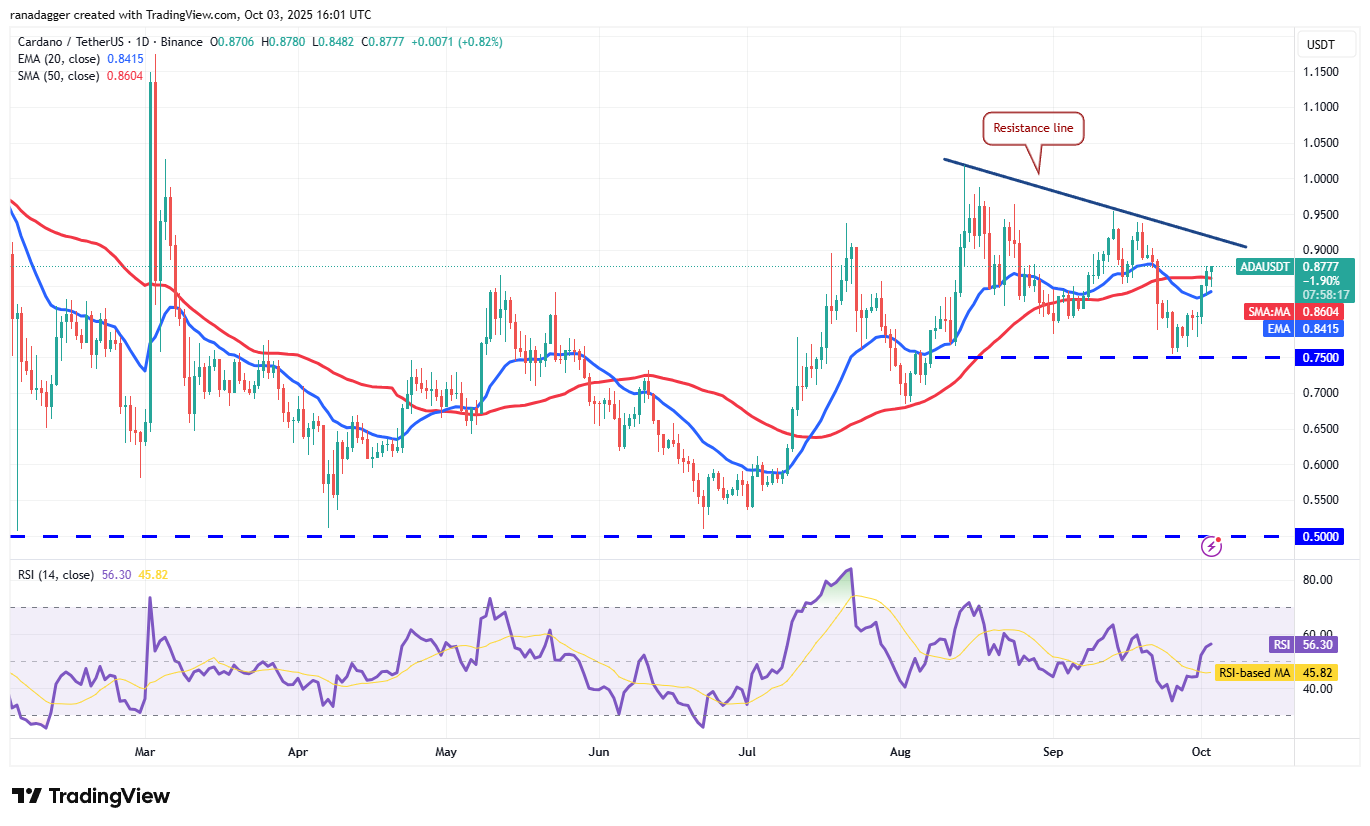
Buyers must push Cardano’s price above the resistance line to signal a potential end to the correction. The ADA/USDT pair could then attempt a rally to $1.02, where sellers are expected to offer resistance.
Conversely, a price reversal from the current level or the resistance line, breaking below the 20-day EMA ($0.84), would suggest that sellers are capitalizing on rallies. The pair may then decline toward the $0.75 support.
Related: XRP price targets $3, potentially opening the way for a 40% October rally
Hyperliquid Price Forecast
Hyperliquid (HYPE) surged above the moving averages on Thursday, indicating strong buying interest at lower levels.
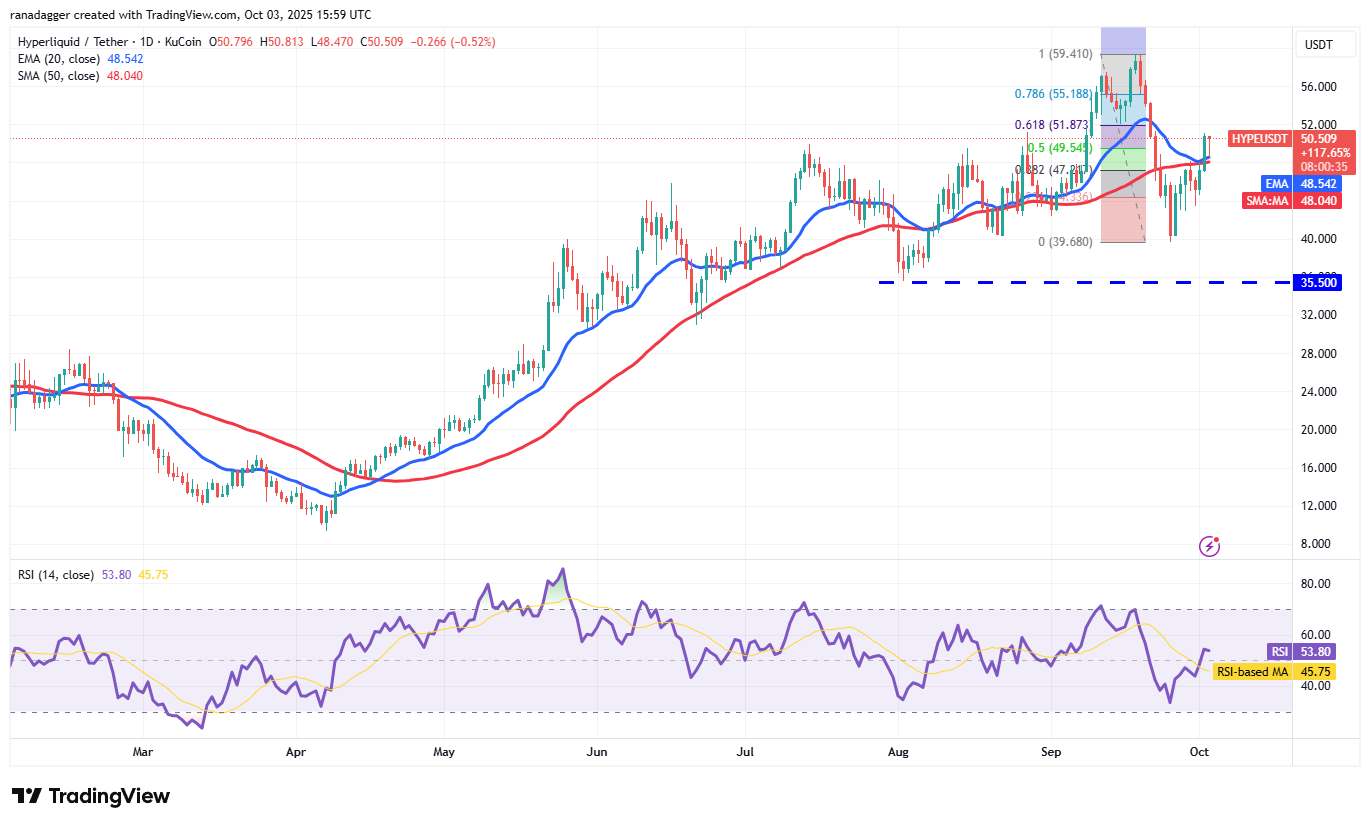
The relief rally is likely to encounter selling pressure at the 61.8% Fibonacci retracement level of $51.87. A price reversal from $51.87 that finds support at the moving averages would indicate a shift in sentiment to bullish. The HYPE/USDT pair could then rise to $59.41.
Conversely, a breakdown below the moving averages would signal that sellers are active at higher prices. Hyperliquid’s price could then fall to $43 and subsequently to $39.68.
Chainlink Price Forecast
Chainlink (LINK) rose above the 20-day EMA ($22.35) on Wednesday, but buyers face resistance near the downtrend line.
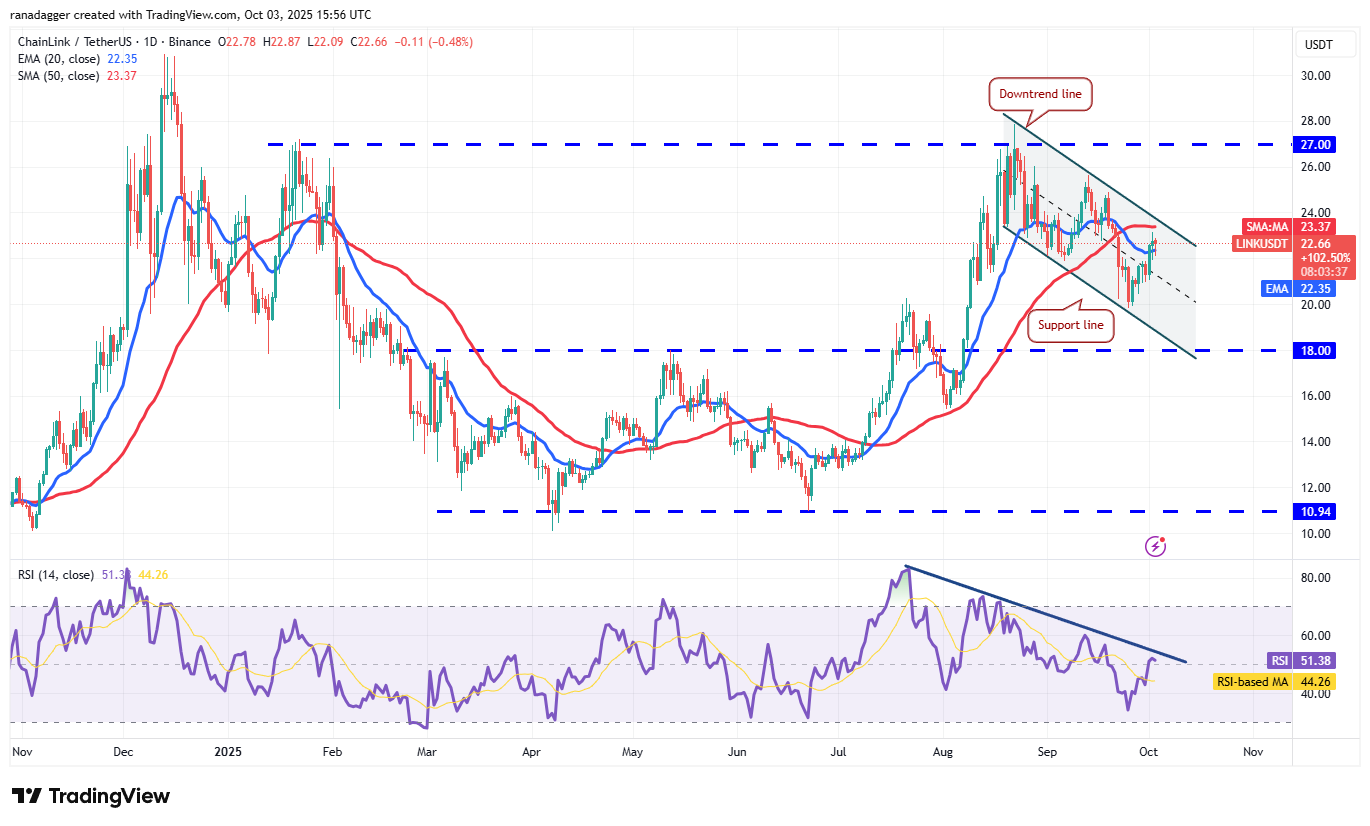
If the price declines and remains below the 20-day EMA, the LINK/USDT pair could remain confined within the descending channel for a few more days.
The first sign of strength would be a break and close above the downtrend line. If that happens, Chainlink’s price could rally to $26 and then to $27. Sellers will attempt to halt the advance at $27, but if buyers prevail, the rally could reach $30.94.
Sui Price Forecast
Sui (SUI) climbed above the moving averages on Wednesday, suggesting a reduction in selling pressure.
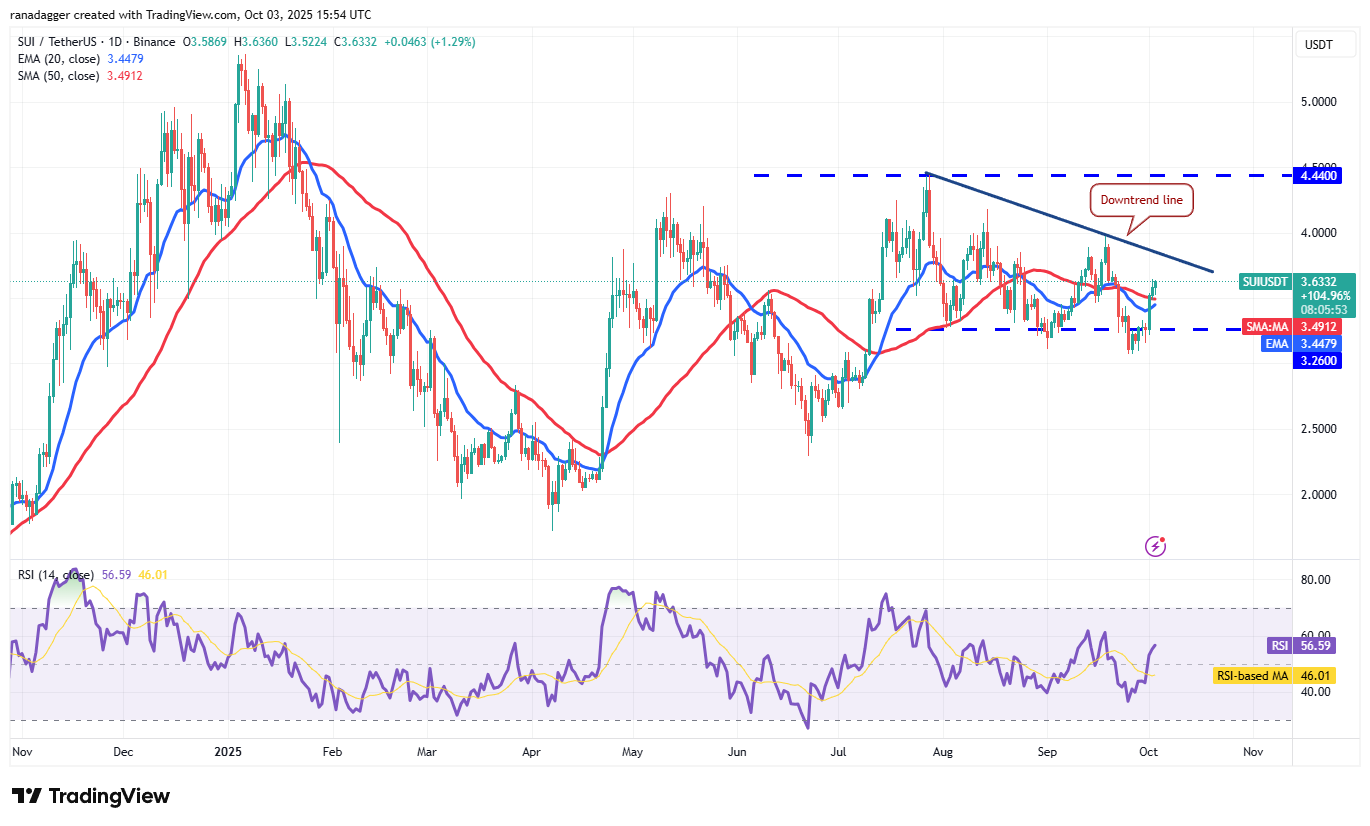
If buyers sustain the price above the moving averages, the SUI/USDT pair could climb to the downtrend line. Sellers are expected to defend this line aggressively, as a break above it could propel Sui’s price to $4.20 and subsequently to $4.44.
Conversely, a price reversal below the moving averages would suggest that sellers have not given up. The pair may then fall to the $3.26 to $3.06 support zone.
This analysis is for informational purposes only and should not be considered investment advice. Trading and investing in cryptocurrencies involve substantial risk; conduct thorough research before making any decisions.