

Key Points
- The total cryptocurrency market capitalization (TOTALCAP) has broken free from a downward trending wedge pattern.
- The market capitalization of altcoins (ALTCAP) is on the verge of reaching a new peak.
- What is the expected trajectory for the crypto market for the remainder of September?
After a correction period lasting two weeks, the crypto market has reversed course and experienced a notable surge today.
With the overall market cap, or TOTALCAP, overcoming significant resistance levels and the altcoin market cap, ALTCAP, approaching a record high, bullish sentiment is returning to the market.
Adding to the positive outlook, smaller altcoins are taking center stage, potentially indicating the next substantial upswing in this rally.
What’s Driving the Crypto Market Upward Today?
The primary reason for the increase in crypto values today is the breakout from a declining wedge pattern that has been in place since August 14th.
Following a two-week period of price adjustments concluding on September 1st, the total crypto market cap successfully breached its descending wedge formation, suggesting a potential end to the prior downtrend.
Get These Top Crypto Casino Offers Now!
Sponsored
Disclosure
We sometimes use affiliate links in our content, when clicking on those we might receive a commission at no extra cost to you. By using this website you agree to our terms and conditions and privacy policy.


The overall crypto market valuation has now surpassed the $3.84 trillion ceiling, established by the 0.382 Fibonacci retracement level.
Coupled with the wedge breakout, this move above $3.84 trillion strengthens the case for the correction’s conclusion.
The next major challenge lies at $3.96 trillion, coinciding with the 0.618 Fibonacci retracement and a significant horizontal resistance zone.
Corrections often find their end around the 0.618 Fibonacci level. Consequently, if TOTALCAP can break through this barrier, it will substantially confirm the end of the recent downward trend.
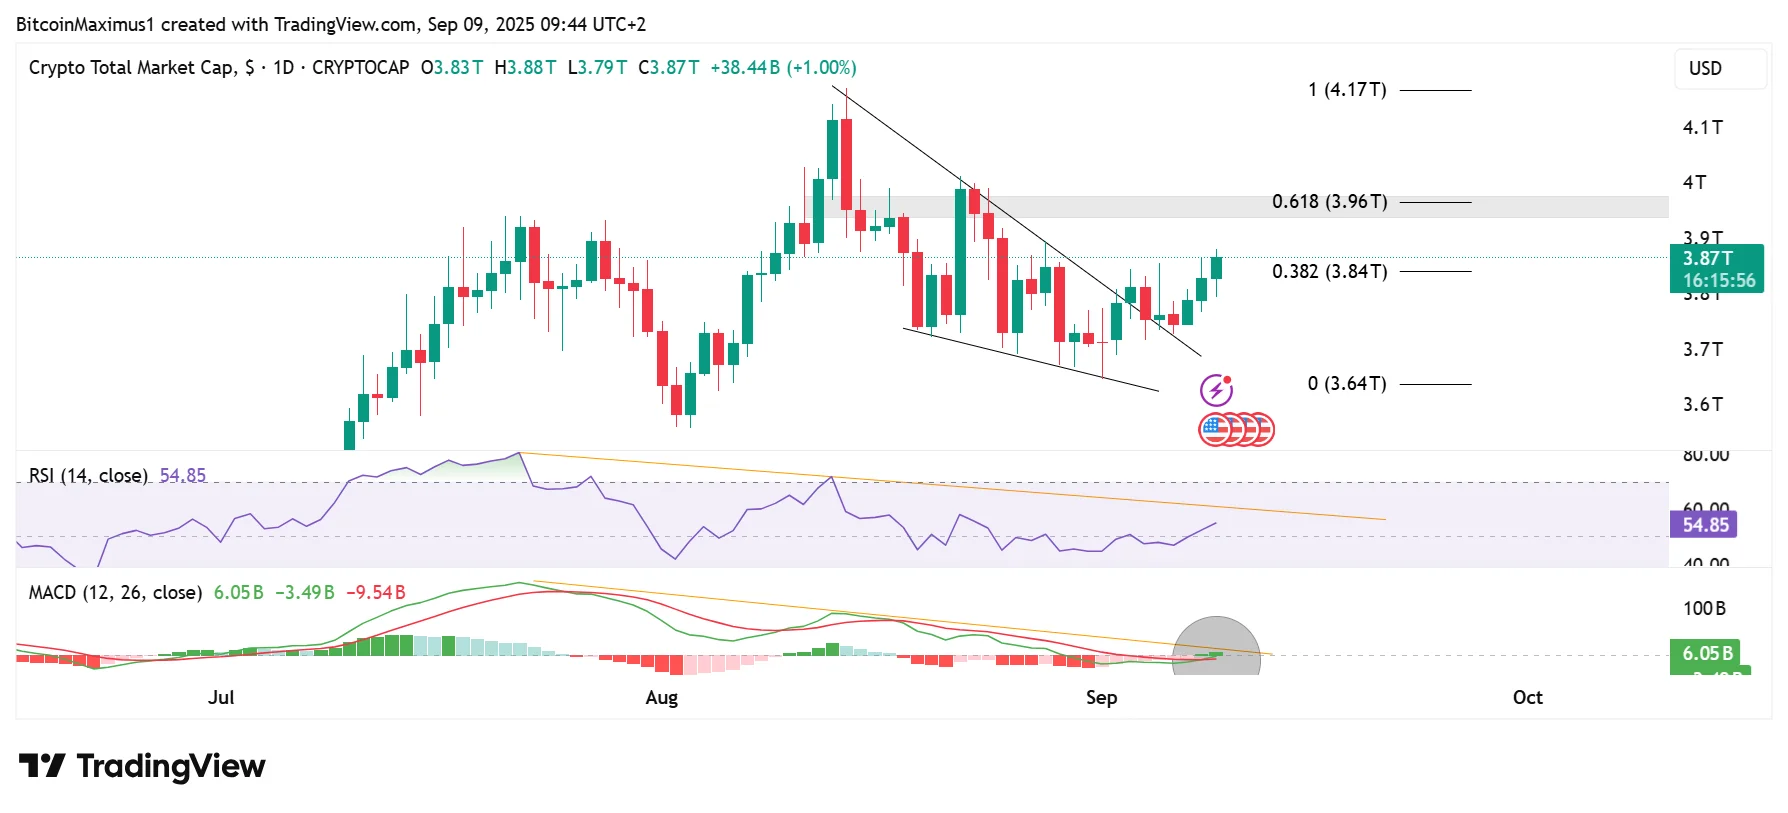
Furthermore, both the Relative Strength Index (RSI) and the Moving Average Convergence/Divergence (MACD) are closing in on their respective bearish divergence trendlines.
A breakthrough of the $3.96 trillion level would likely trigger resistance breakouts in these indicators as well, reinforcing the idea that the correction phase is complete.
What Are the Potential Future Market Developments?
Looking at a broader, multi-month perspective, the crypto market seems to be completing the final stage of its upward trend that began in April.
Assuming this analysis holds true, TOTALCAP has just completed wave four and has started the anticipated fifth and last upward wave, with a target of $4.6 trillion.
This longer-term view, in conjunction with short term movement, suggests the correction’s conclusion. This assertion is based on several factors.
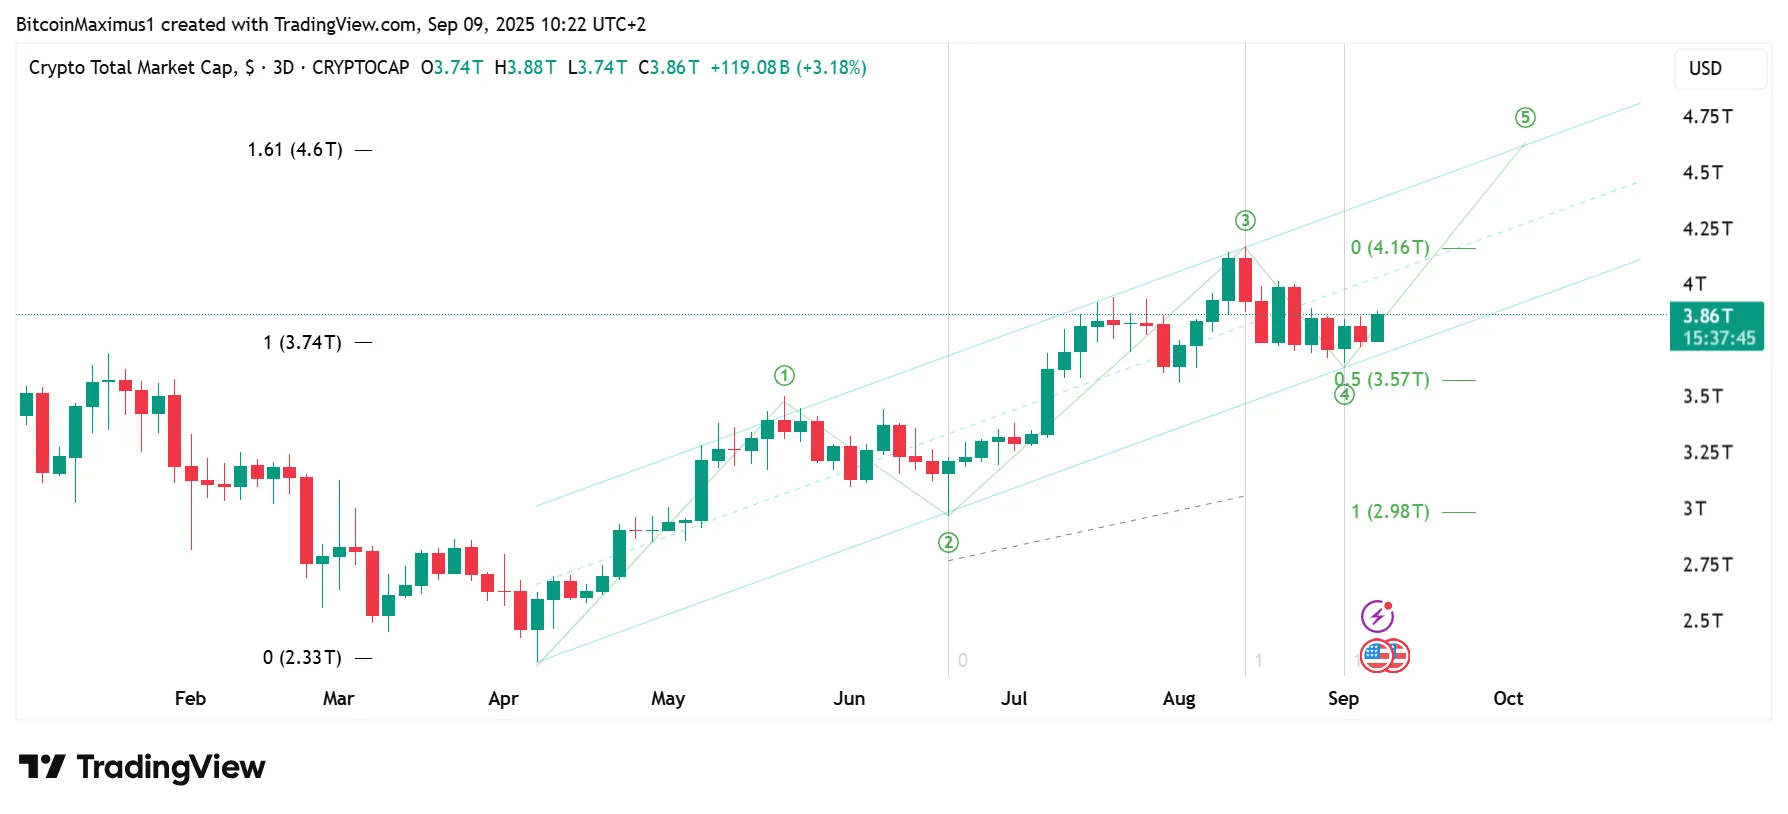
Firstly, the entire movement is contained within an ascending parallel channel, where TOTALCAP has just bounced from the support level.
Secondly, wave fours are known to be shallower and shorter in duration compared to waves two and three. This recent correction aligns with these qualities in terms of magnitude and timeframe, supporting the completion of wave four.
Considering all the above points, there’s a good chance that the crypto market has reached a bottom and will likely continue its upward trajectory throughout the remainder of September.
Who Will Lead the Next Market Push?
Having established a positive market outlook, the next step is to identify whether altcoins will outperform Bitcoin, and if so, which altcoins will be at the forefront.
As Ethereum faces some challenges relative to Bitcoin, the opportunity arises for smaller cryptocurrencies to gain momentum.
This shift is already observable through the decreasing Bitcoin Dominance Rate.
Furthermore, the ALTCAP chart presents a noticeably more bullish picture compared to the TOTALCAP chart.
Similarly to TOTALCAP, ALTCAP appears to be in the final fifth wave of its upward movement.
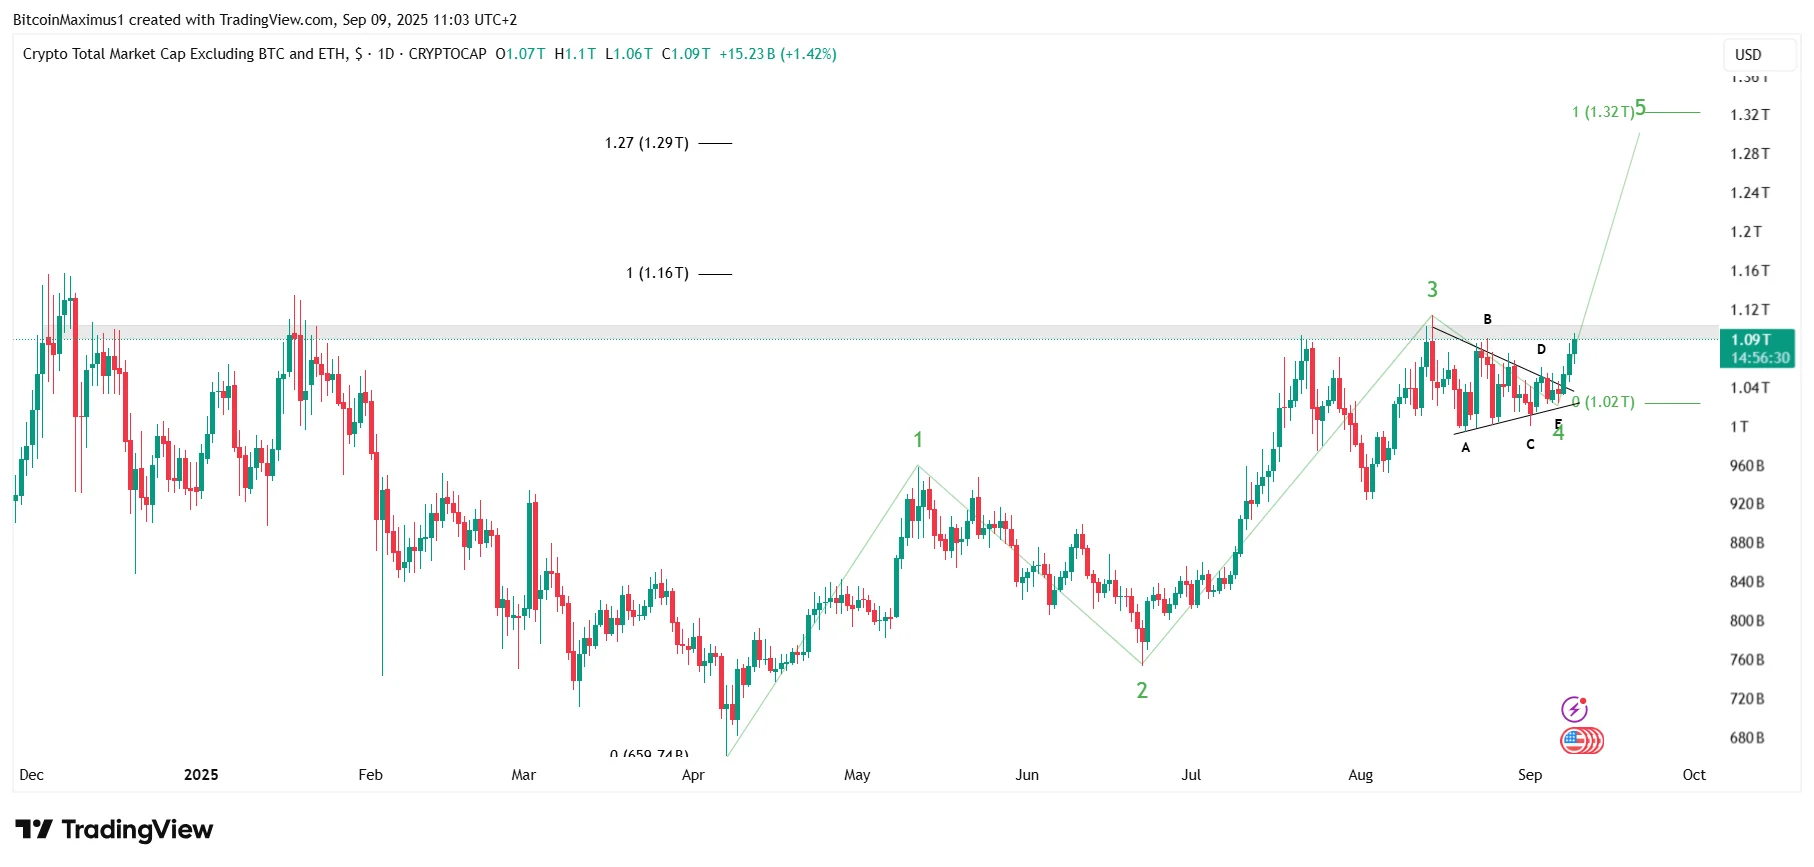
The ALTCAP chart demonstrates a symmetrical triangle forming in wave four, further confirming the accuracy of this wave count analysis.
Currently, the altcoin market cap is attempting to break past the $1.10 trillion resistance area, which represents the final hurdle before reaching all-time highs.
Should this breakout be successful, ALTCAP has the potential to surge towards $1.32 trillion, achieving a new peak within the $1.29 to $1.32 trillion range.
Considering that neither wave three nor wave five has yet extended, it is possible that wave five will be the one to extend, setting the higher bound for the expected target.
The Rise of Small-Cap Altcoins
The chart that potentially provides the clearest view of the crypto market’s immediate future is the dominance of coins outside the top 10, also known as small-cap altcoins.
Small-cap altcoin dominance recently broke through the 8% resistance level, reaching its highest point since May.
Not only has it surpassed its horizontal resistance, but it is also challenging a diagonal resistance trendline that has been in place since the start of 2025.
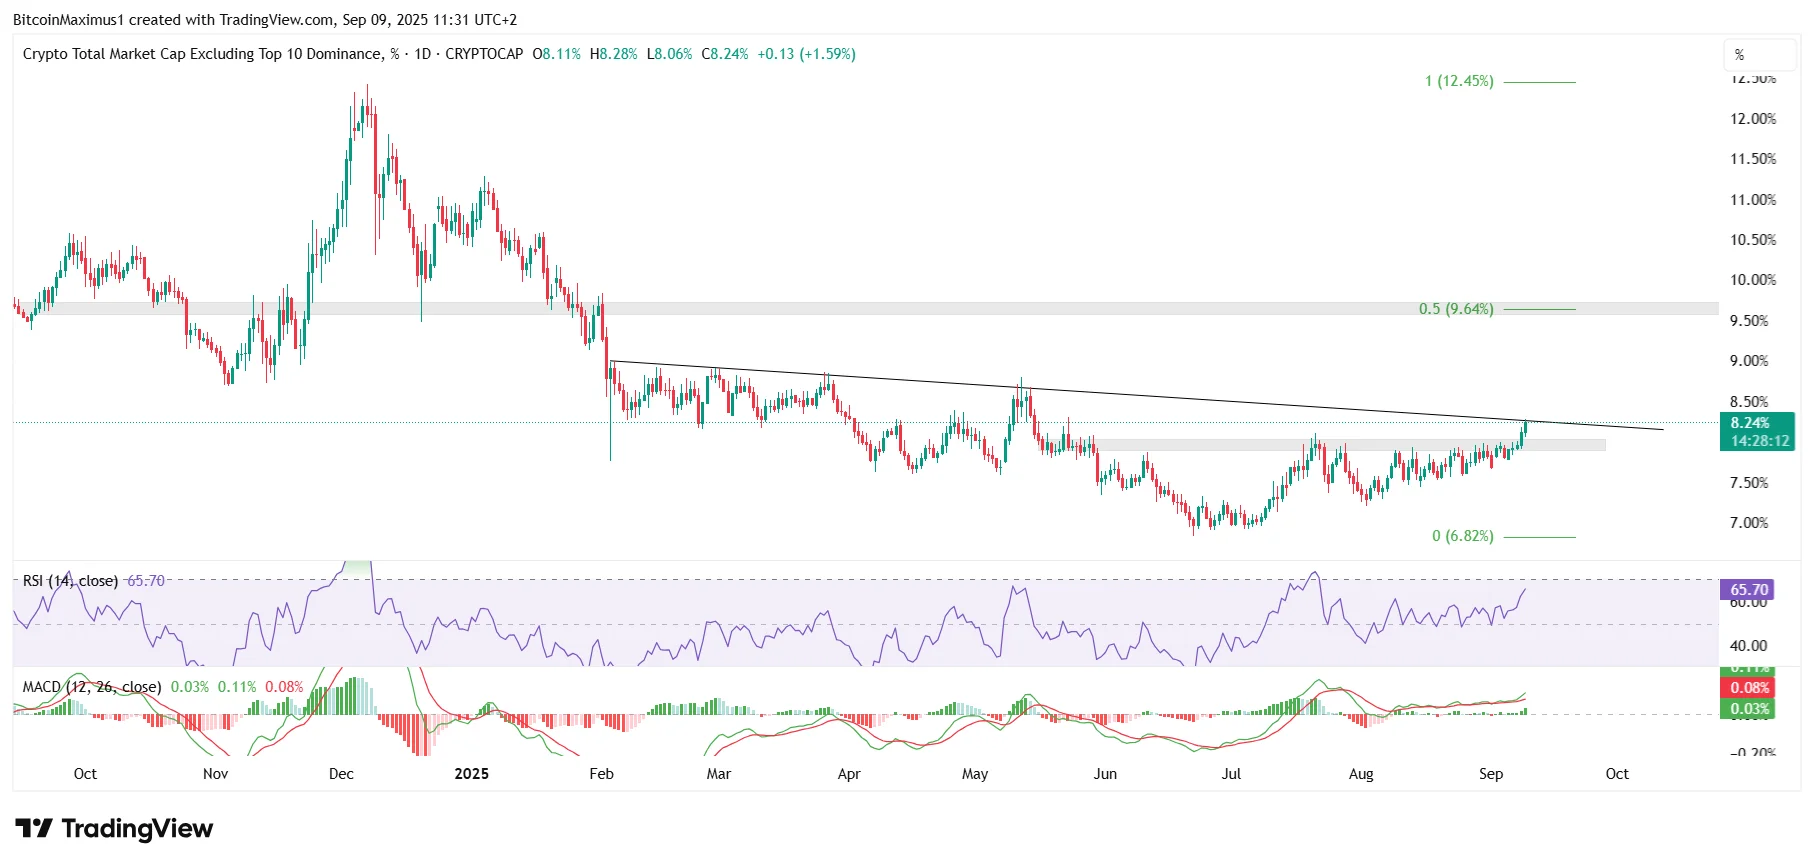
A successful move above this trendline would dispel any lingering doubts about the end of the correction and signify the start of a new bullish cycle.
When combined with the other market analyses and the positive RSI and MACD readings, the likelihood of a breakout becomes highly probable.
Therefore, it is expected that small-cap altcoins will spearhead the final phase of this market rally.
Bitcoin Dominance Declines
Finally, the Bitcoin Dominance rate chart shows a prolonged decrease since June, potentially signaling the commencement of altcoin season.
Since the start of this downtrend, Bitcoin’s dominance has decreased by 12%, reaching levels not seen since the beginning of the year.
While the decline might be approaching its end, it appears it’s not quite over yet.
In the most probable scenario, BTCD is finishing wave C within an A-B-C correction pattern, to be followed by a substantial market recovery.
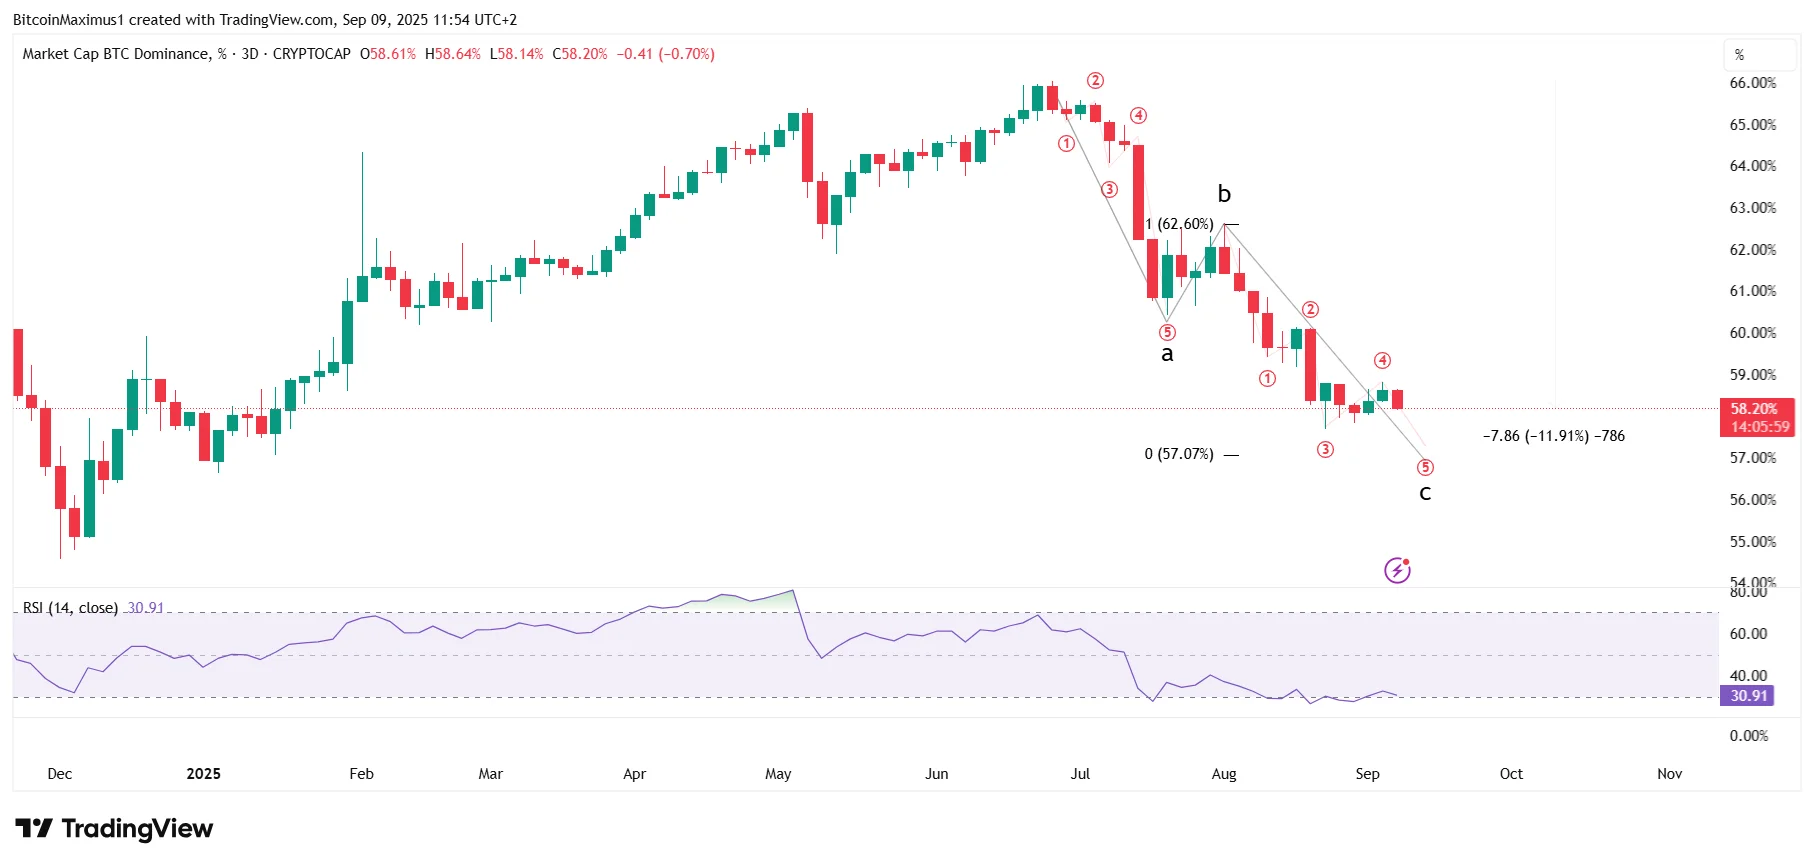
However, the sub-wave analysis indicates a further decline before the completion of the full correction pattern.
Supporting this view, the RSI indicates an oversold condition but hasn’t yet produced a bearish divergence signal.
In summary, market analyses indicate that September could bring an increase in the overall crypto market, driven primarily by altcoins, with a particular focus on small-cap projects.
Before a recovery, the Bitcoin Dominance Rate is expected to experience at least one more decline.
Altcoin Season is Here
All indications point towards the official end of the crypto market correction, with both TOTALCAP and ALTCAP poised for considerable gains.
If small-cap altcoins continue to increase in dominance, the final push of this bull run could very well be led by coins outside the top 10 cryptocurrencies.
September is shaping up to be a significant month for the crypto market, especially if the Federal Reserve reduces interest rates on Sept. 17.
Disclaimer:
The information provided in this article is for informational purposes only. It is not intended to be, nor should it be construed as, financial advice. We do not make any warranties regarding the completeness, reliability, or accuracy of this information. All investments involve risk, and past performance does not guarantee future results. We recommend consulting a financial advisor before making any investment decisions.