

Tron (TRX) demonstrates notable strength as the cryptocurrency market experiences a broad upturn, with Bitcoin approaching new record highs and other altcoins following suit. Amid this revived market energy, leading market observer Darkfost has shared insights emphasizing that TRX’s fundamental upward trajectory is firmly established. The digital asset has maintained a consistent bullish pattern even throughout periods of price stabilization, indicating a solid groundwork for future advances.
Related Reading
Darkfost also highlighted a compelling indicator that has historically preceded periods of increased upward momentum for TRX. This signal, derived from trading volume patterns, suggests a period of reduced activity often observed before significant upward price movements. Similar patterns in the past have correlated with considerable price increases, bolstering optimism among investors.
As the broader market regains vigor, TRX is distinguished by its consistent resilience and steady performance. The combination of an established long-term upward trend and favorable on-chain metrics are fueling expectations for a potential surge in value in the coming days. With Bitcoin driving market sentiment and altcoins experiencing increased interest, TRX may be positioning itself to be a leading performer during this phase of the cryptocurrency market.
TRX Market Structure: Declining Volume Suggests Impending Breakout
According to insights from Darkfost, the “Spot Volume Bubble Map” – a tool used to visually represent periods of expanding and contracting trading volume – currently indicates a notable cooling-off period for TRX. The indicator reveals that spot trading volumes have decreased considerably in recent sessions, a pattern frequently seen before renewed market volatility. While reduced activity might appear to signal a lack of interest, historical data suggests a different interpretation for TRX.
Darkfost points out that similar conditions have frequently preceded significant bullish movements. As an example, in July 2021, after TRX’s trading volumes declined significantly, its price quickly jumped from $0.05 to $0.12. Another similar situation occurred in October 2024, which was followed by a remarkable rally from $0.15 to $0.43. In both instances, decreased trading activity did not signify weakness but rather a preparatory phase as long-term investors built positions in anticipation of the next surge.
The current cooling-off period may thus represent a period of consolidation rather than a loss of momentum. As prices stabilize and volatility decreases, TRX appears to be forming a strong base of support, allowing experienced investors to quietly accumulate positions. If market liquidity improves alongside gains in Bitcoin and altcoins, this structure could act as a launchpad for a short-term rebound or potentially the start of a new accelerated growth phase for TRX.
Related Reading
TRX Price Analysis: Consolidation Pattern Suggests Potential Gains
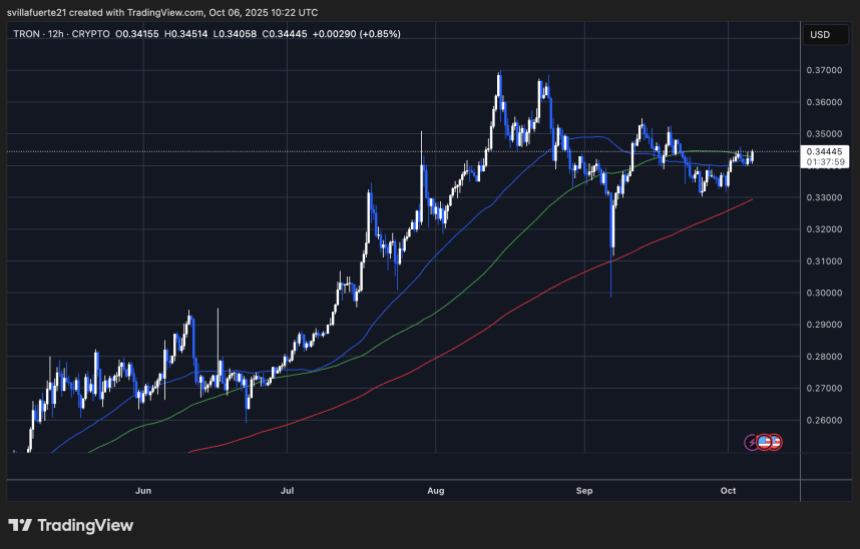
TRX is currently trading around $0.344, displaying resilience as it consolidates near short-term price resistance. Chart analysis indicates a steady recovery from lows near $0.32 in late September, with the price now holding above both the 50-day and 200-day moving averages, signaling a positive medium-term market structure.
The 50-day MA (represented in blue) is beginning to trend upwards, suggesting renewed upward momentum, while the 200-day MA (in red) continues to provide a robust foundation of long-term support. This pattern reflects previous consolidation phases in which TRX gained strength before breaking out to higher price levels. The 100-day MA (shown in green) also aligns closely with current price action, forming a convergence area that often precedes greater volatility.
Related Reading
Resistance is observed in the $0.35–$0.36 range, a significant level that has repeatedly limited upward movement since early September. A confirmed breakout beyond this zone could pave the way towards $0.38–$0.40, resuming the broader bullish trend observed earlier in the year. Conversely, immediate support can be found near $0.33, followed by $0.32, which has consistently held throughout multiple tests.
Featured image from ChatGPT, chart from TradingView.com