


A significant portion, exceeding 50%, of the total Bitcoin currently available has remained untouched for at least a year. This inherent characteristic of Bitcoin’s distribution is expected to play a crucial role in influencing how the market absorbs new demand as the year progresses.
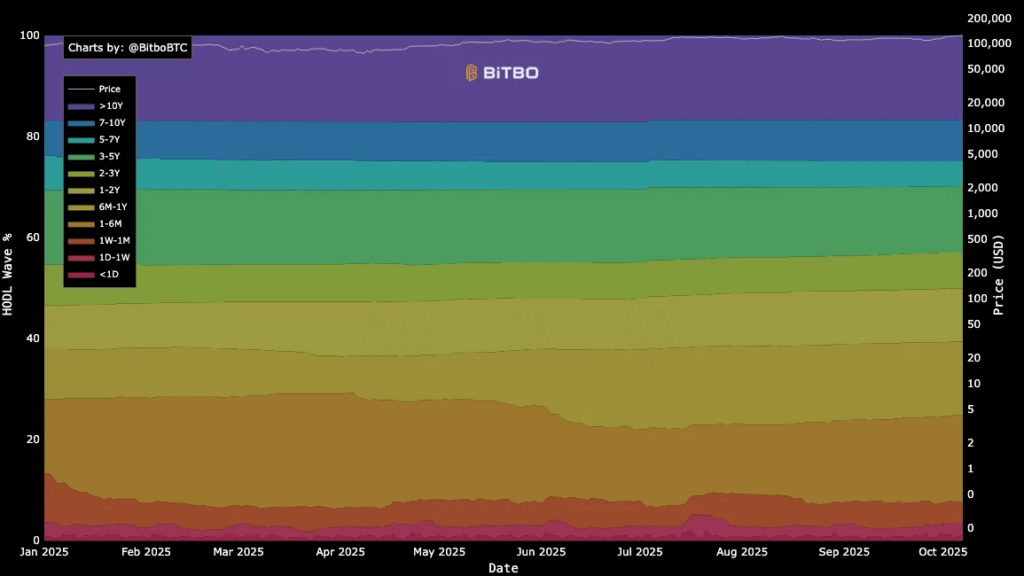
Data from Bitbo indicates that approximately 61% of all Bitcoin in circulation hasn’t been moved on the blockchain in over a year. Notably, a substantial 17% of the total supply has been dormant for more than a decade.
An analysis of the latest HODL Waves breakdown reveals the following distribution: roughly 8% of Bitcoin hasn’t moved in 7-10 years, about 5% in 5-7 years, approximately 13% in 3-5 years, around 7% in 2-3 years, roughly 11.5% in 1-2 years, about 13% in 6-12 months, approximately 7.5% in 3-6 months, around 9.5% in 1-3 months, and roughly 5% in under one month.
It’s important to note that these HODL wave measurements reflect the time since the last on-chain movement of Bitcoin and don’t indicate any changes in the total supply. These figures can be affected by how different data providers group transactions and tag exchange wallets.
Examining Realized-Cap HODL Waves, which weigh the bands based on the cost basis instead of the number of coins, provides insights into the financial strength of Bitcoin holders. This is useful for determining if price increases are supported by short-term speculation or long-term investment.
The demand for Bitcoin is being influenced by the emergence of regulated investment funds and current macroeconomic policies. During the week ending October 4th, crypto exchange-traded products (ETPs) experienced net inflows of approximately $5.95 billion, primarily driven by spot Bitcoin products in the United States.
Assuming a Bitcoin price of $125,000, a weekly inflow of $5.95 billion translates to the absorption of roughly 47,600 BTC. This represents about 0.24% of the circulating supply, assuming this rate continues for an entire week.
This analysis doesn’t predict constant inflows but establishes a benchmark. This benchmark is useful for comparing against the behavior of Bitcoin held for shorter periods, as these shorter-term holdings have historically been the source of most selling activity.
Significant Short-Term Bitcoin Supply
Approximately 30% to 35% of the Bitcoin supply is held for periods of 1-3 months, 3-6 months, or 6-12 months. This portion of the supply is generally the most sensitive to changes in price and overall economic conditions over the course of a financial quarter.
Holders of these coins tend to sell for a profit as prices increase, while those holding for two years or more typically make changes more slowly. Coin-Days Destroyed (CDD) is a useful metric for tracking whether long-term holders are becoming active again.
According to Bitbo, monitoring the 90-day moving average of CDD alongside the Bitcoin price can help identify periods when long-held coins are being moved, as opposed to periods of accumulation where the age of the coins continues to increase.
A stable or decreasing CDD trend during price increases suggests that long-term holders are not actively selling. A sharp increase in CDD alongside market volatility often signifies that older coins are entering the market.
Macroeconomic policy is likely to influence the flow of funds and the behavior of mid-term Bitcoin holders as the year ends. The Federal Reserve reduced the benchmark interest rate by 25 basis points in September. Economic projections suggest further reductions in 2025, dependent on inflation data.
Anticipated Lower Interest Rates
Data indicates that U.S. consumer prices increased by 2.9% year-over-year in August.
The trend of decreasing inflation is ongoing, although uneven. Moderating inflation and gradual interest rate reductions could lead to lower real yields, potentially increasing risk appetite and driving flows into Bitcoin-related investment products. However, it is important to remember that this relationship is not guaranteed.
The interplay of supply and demand can be analyzed using scenarios that estimate fund flows against the available supply of Bitcoin from younger age bands. Using the same price point for consistency, each $1 billion in net inflows, at a Bitcoin price of $125,000, results in the absorption of roughly 8,000 BTC.
A weekly inflow range of $0.5 to $2.0 billion equates to the absorption of 4,000 to 16,000 BTC per week. This can be compared to estimated monthly release rates from the 1-12 month cohorts.
If 30% of the total supply is within these cohorts, a monthly rotation of 5% would release approximately 0.05 × 0.30 × 19.7 million BTC, which is roughly 295,500 BTC per month, or 73,900 BTC per week on average.
That figure would greatly outweigh a $0.5 to $2.0 billion inflow rate. However, rotation is not constant and often clusters around price fluctuations and derivatives trading activity.
If rotation decreases to 1% per month, the weekly release would be approximately 14,800 BTC. A $2 billion inflow week could completely offset this release.
The purpose of this modeling is not to generate a precise forecast, but to establish the levels at which demand absorbs or is absorbed by the available supply of Bitcoin held for shorter timeframes.
| HODL band | Approx. share |
|---|---|
| >10 years | ~17% |
| 7–10 years | ~8% |
| 5–7 years | ~5% |
| 3–5 years | ~13% |
| 2–3 years | ~7% |
| 1–2 years | ~11.5% |
| 6–12 months | ~13% |
| 3–6 months | ~7.5% |
| 1–3 months | ~9.5% |
| <1 month | ~5% |
Another perspective involves examining Realized-Cap HODL Waves, which track the share of realized value held by each age band. An increasing share of realized value held by older bands indicates a growing economic influence from long-term holders.
Looking ahead to the end of the year, if CDD remains stable and Realized-Cap HODL Waves continue to emphasize older holdings, price increases may rely less on new investment and more on a limited supply being offered by holders who bought at higher prices and are less willing to sell.
Conversely, if CDD increases while ETP inflows slow, mid-age bands would expand as previously dormant coins are moved, resetting their age. This pattern is frequently seen after all-time highs, as the market adjusts to price gains.
| Scenario | Assumed net ETP flow, weekly | Implied BTC absorbed, weekly | Short-age rotation, monthly | Implied BTC released, weekly |
|---|---|---|---|---|
| Low demand | $0.5B | ~4,000 | 5% | ~73,900 |
| Base | $1.5B | ~12,000 | 2% | ~29,600 |
| High demand | $4.0B | ~32,000 | 1% | ~14,800 |
Exchange Bitcoin Balances Under Scrutiny
Data from various public sources shows that the amount of Bitcoin held on centralized exchanges is near its lowest level in years. However, this metric requires careful interpretation. Changes in wallet practices, off-exchange settlements, and internal transfers can reduce on-exchange balances without necessarily impacting the available supply.
Exchange tagging is not perfect and should be considered alongside other indicators, such as order book depth, futures market activity, and on-chain age flows, before drawing conclusions about a supply shortage.
The Bitcoin price provides context for understanding these flows and holdings, but it does not alter the underlying measurements.
Bitcoin reached new all-time highs this week, coinciding with substantial inflows into investment funds. Whether these inflows persist will depend on investor risk tolerance and expectations regarding economic policy.
If inflation remains near the recent rate of 2.9% annually and economic policy continues toward gradual easing, additional allocations from investment vehicles that previously did not hold Bitcoin are likely. This is also relevant for those entities which were previously on the sidelines.
However, if inflation accelerates or economic policy becomes more restrictive, shorter-term Bitcoin holders may reduce their holdings, leading to increased supply. This shift would initially be reflected in CDD and the proportion of supply held for 1-3 months.
Over the coming weeks, it will be crucial to track three factors in tandem:
First, the weekly net flows into ETPs relative to the benchmark of 8,000 BTC absorbed per billion dollars of inflow, using CoinShares data as a starting point.
Second, the 90-day trend of CDD and any sudden spikes in CDD relative to the Bitcoin price.
Third, the composition of HODL Waves, considering both the number of coins and the realized value of those coins.
Together, these indicators provide insight into whether the market is drawing from a large base of long-term holders or from a smaller pool of more active, short-term holders. This will determine how future demand interacts with the Bitcoin supply, which has aged significantly in recent months.