
Bitcoin Market Recap: Iran Ceasefire Collapse Drags BTC to $62K on Heavy Risk-Off
Wednesday’s NY session close handed Bitcoin a sharp 2.3% loss, with price settling at $62,240 after tagging a session high of $63,847 in the early hours before geopolitical headlines overwhelmed the tape. This bitcoin market recap breaks down exactly why the selloff happened, where leveraged positions are stacked, and what traders should be watching heading into the Asia open.
The broader crypto market shed roughly 2.1% in total market cap, which now sits at $2.23 trillion. The damage was not evenly distributed — altcoins absorbed the worst of it while Bitcoin dominance held firm at 56%, a dynamic that historically signals capital contraction rather than healthy rotation.
What Moved Markets Today
Iran ceasefire collapse and Hormuz blockade threats were the primary catalyst. News that ceasefire talks broke down sent energy markets into risk-off mode, with oil pushing toward $75 on the threat of a Strait of Hormuz blockade. That single geopolitical development is significant because Hormuz carries roughly 20% of global oil supply — any credible blockade threat reprices energy risk globally, which immediately pressures risk assets from equities to crypto.
U.S. 10-year Treasury yields climbed to 4.57%, up 0.88% on the session, reinforcing the macro headwind. Elevated yields compress the relative appeal of speculative assets by raising the opportunity cost of holding them. Futures traders responded by cutting leveraged long positions, and that deleveraging showed up in the Bitcoin ETF complex, where cumulative outflow pressure has now reached a reported $8 billion. When institutional money is pulling from spot ETF vehicles, the bid thins out and price becomes more vulnerable to macro shocks like today’s oil spike.
EU officials are reportedly moving to revise MiCA to capture non-EU stablecoin issuers. The proposal would extend the regulatory perimeter to offshore USD stablecoin operations serving European users — a meaningful shift that could affect issuers currently operating outside Brussels’ jurisdiction. With London open approaching, this added a layer of regulatory uncertainty that traders weren’t positioned for, contributing to the general risk-reduction mood through the session close.
BTC ETF outflow narrative remains a structural drag even as some analysts suggest the bleed may be “turning a corner.” The $8 billion cumulative outflow figure is large enough to matter for price discovery. Until that flow dynamic reverses sustainably, rallies remain candidates for distribution rather than accumulation at scale.
Altcoin Action
Solana was the headline loser among majors, falling 4.86% to $77.35 after printing a session high of $81.38. That’s a nearly $5 rejection from intraday highs in a single session — aggressive for a large-cap asset. Ethereum dropped 2.7% to $1,738 with a session low of $1,712, and analysts flagged what’s being described as Ethereum’s worst weekly signal in years. DOGE shed 2.68% to $0.0725.
In the deeper altcoin tier, JUP cratered 11.3%, PI dropped 8.6%, and LIT fell 7.4% — all meaningful single-session moves that reflect genuine risk-off positioning rather than isolated project news. On the green side, VVV gained 4.8%, SKY added 3.1%, and JST ticked up 3.0%, but these were isolated pockets of strength in an otherwise red session.
BTC dominance holding at 56% while alts bleed harder than Bitcoin is a classic flight-to-quality pattern within crypto. It does not mean money is flowing into Bitcoin — it means money is leaving alts faster than it’s leaving BTC, and some of it is simply leaving the asset class entirely.
Positioning and the Liquidation Map
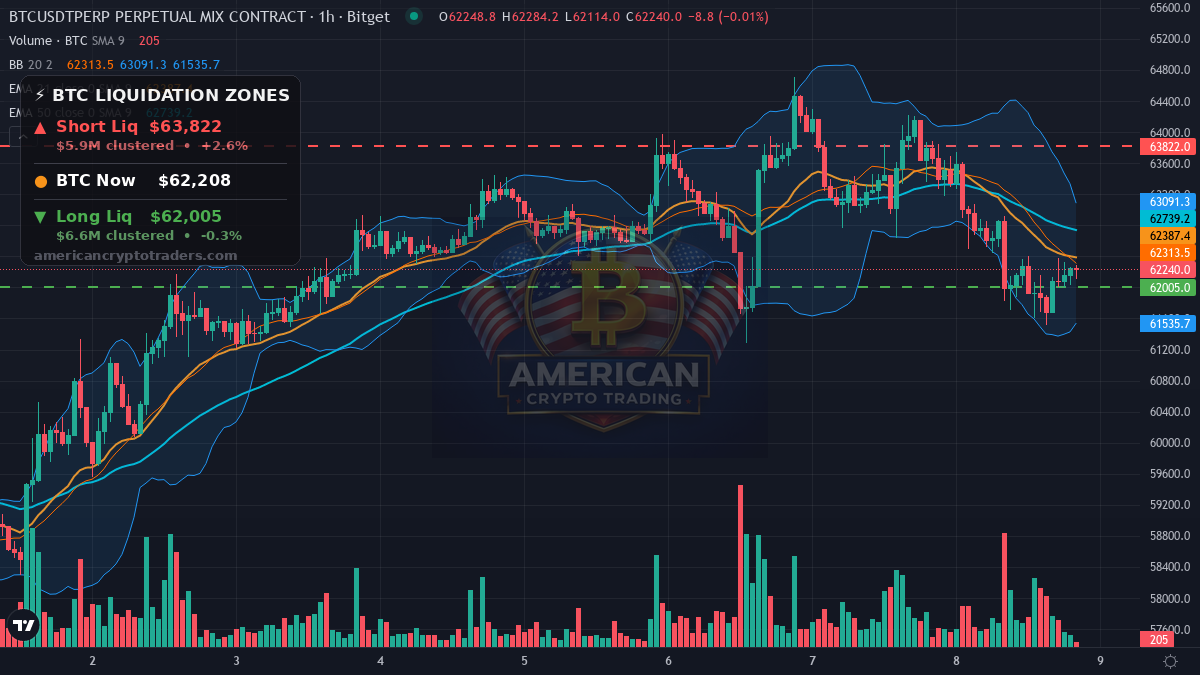
With Bitcoin trading around $62,208 at the time of the liquidation data pull, the positioning setup is tight on both sides. Short liquidations cluster at $63,822 — a move of roughly 2.6% to the upside would run those stops and likely trigger a short-squeeze acceleration through that level. Any catalyst that cools geopolitical fear even temporarily could ignite that move.
Long liquidations sit at $62,005, just 0.3% below current price. That proximity is the more urgent risk. A modest continuation of selling pressure — particularly if Asia opens on negative geopolitical headlines — could cascade through those long stops and push price toward the session low of $61,512. A clean break below $62,005 would likely see forced selling compound the move.
Funding rates remain modestly positive: BTC at 0.0074% and ETH at 0.0057%. Neither is extreme, which means the market hasn’t been structurally overleveraged to the long side heading into this — the selloff has been more spot-driven and macro-driven than a pure leverage flush.
The Macro Picture
The DXY softened slightly to 101.01, down 0.13%, which would normally provide a mild tailwind for crypto. The fact that BTC still sold off against a weakening dollar underscores how dominant the geopolitical and yield story was today. Gold also retreated 1.43% to $4,085.90 — a notable data point, as gold and crypto occasionally fall together when forced liquidation or broad risk-off hits multiple asset classes simultaneously.
The S&P 500 closed down 0.28% at 7,482.71, a relatively contained equity loss compared to crypto’s session decline. That divergence suggests crypto is currently absorbing a geopolitical and regulatory premium of risk that equities are not pricing in to the same degree.
Levels to Watch
On the downside, $62,005 is the immediate line — that’s where long liquidations pool and a breach there opens the door to the session low of $61,512. Below that, there’s limited structural support until the $60,000 psychological level. On the upside, $63,822 is where shorts get squeezed, and a reclaim of the session high at $63,847 would flip the short-term narrative back to constructive.
Upcoming Catalysts
The macro calendar does not currently show scheduled high-impact events beyond the ongoing geopolitical situation in the Middle East. Traders should monitor oil markets and any developments around Hormuz blockade rhetoric closely heading into the Asia session, as that remains the live driver of risk sentiment.
Sentiment Check
The Fear & Greed Index closed at 20 — Extreme Fear. That’s a historically uncomfortable reading, but it also represents the kind of sentiment floor where contrarian setups begin to build. Extreme fear does not guarantee a bottom, but it does indicate that much of the near-term bad news is being priced in aggressively. For broader context on where Bitcoin stands in its longer-term cycle, our 28-for-28 monthly candle analysis remains one of the most reliable structural frameworks we track.
Bottom Line
Today’s session was a textbook macro-driven risk-off event. The Iran ceasefire collapse provided the geopolitical spark, elevated yields supplied the structural headwind, and an already-nervous market with $8 billion in recent ETF outflows had little appetite to hold leveraged exposure into an uncertain Asia open. BTC at $62,240 is holding above critical long liquidation territory — but only barely.
The next 12 hours will be telling. A quiet Asia session with no escalation in Hormuz rhetoric could stabilize price and set up a test of the $63,822 short liquidation cluster. A hot open with fresh geopolitical headlines pushes the $62,005 trap door into play. Position accordingly and size for volatility.
Disclaimer: This recap is for educational and informational purposes only and does not constitute financial advice. Cryptocurrency trading involves substantial risk of loss. Always do your own research. American Crypto Traders and its contributors may hold positions in the assets discussed.
Originally published on American Crypto Traders
This article was syndicated from the American Crypto Traders daily brief. For original analysis and trading signals, visit americancryptotraders.com