

$TRX has experienced a rise of approximately 2.5% over the last week, coinciding with TRON’s stablecoin market capitalization hitting an unprecedented $89.2 billion. Additionally, the total volume of $USDT transactions reached $2.1 trillion during the same timeframe.
The second-quarter report for 2026 regarding TRON, published by Messari on August 10, highlighted that stablecoin transactions remained a prominent aspect of the network’s performance for that quarter, with $USDT constituting almost all stablecoins in circulation on TRON.
As of August 12, $TRX was trading at approximately $0.335, climbing from about $0.327 at the beginning of the week.
The token initially fluctuated around $0.330 before experiencing a notable surge late on August 11, momentarily pushing prices above $0.336.
This recent uptick has resulted in $TRX achieving a 24-hour increase of roughly 0.9% and a weekly gain of 2.5%.
After surpassing the $0.33 mark, the price has managed to maintain most of its gains, avoiding a swift return to earlier levels observed in August.
This week’s network data has drawn attention back to TRON’s stablecoin operations.
Messari reported that TRON facilitated $2.1 trillion in $USDT transfers in the second quarter of 2026.
The network’s overall stablecoin market cap saw a 4.1% rise from the preceding quarter, reaching a historic high of $89.2 billion.
Of this amount, approximately $87.9 billion was attributed to $USDT at the close of Q2, giving it a commanding 98.5% share of TRON’s stablecoin market.
Such transfer statistics are significant for $TRX, as transactions on the TRON network consume bandwidth and energy—resources directly linked to the native token.
Users can utilize $TRX for transactions or freeze and stake the token to access network resources, tying network activity directly to demand for $TRX.
However, Messari’s findings were not uniformly optimistic.
During Q2, the total value locked in TRON’s DeFi ecosystem fell by 1.9%, and the volume of decentralized exchanges decreased by 21.7%, leaving stablecoin transactions as the more robust part of the network’s performance for the quarter.
Analysis of TRON’s Price
The recent price movement has improved $TRX’s technical outlook after surpassing its key exponential moving averages.
On the daily chart, the 20-day EMA currently stands at approximately $0.3294, while the 50-day EMA is at $0.3287, the 100-day EMA at $0.3276, and the 200-day EMA at $0.3214.
$TRX/$USDT 1-day price chart. Source: TradingView.
With $TRX trading around $0.3355, the token remains above all four moving averages, and the 20-day EMA has risen above both the 50-day and 100-day averages.
This arrangement offers $TRX a solid short-term foundation, though the Average Directional Index has yet to indicate a strong trend.
At present, the daily ADX is at 13.48, which is significantly below the 20-25 range that typically signals strengthening directional movement.
Nevertheless, the ADX has begun to trend upward following a decline through July and early August.
A continuous rise alongside a sustained price above $0.335 would bolster the current breakout technically, whereas another drop in the ADX could expose $TRX to returning to its recent price range.
Additionally, $TRX is testing the upper limit of its 21-day Donchian Channel, with the upper band sitting around $0.3351 and the lower band near $0.3247. On August 12, the token traded slightly above this upper limit.
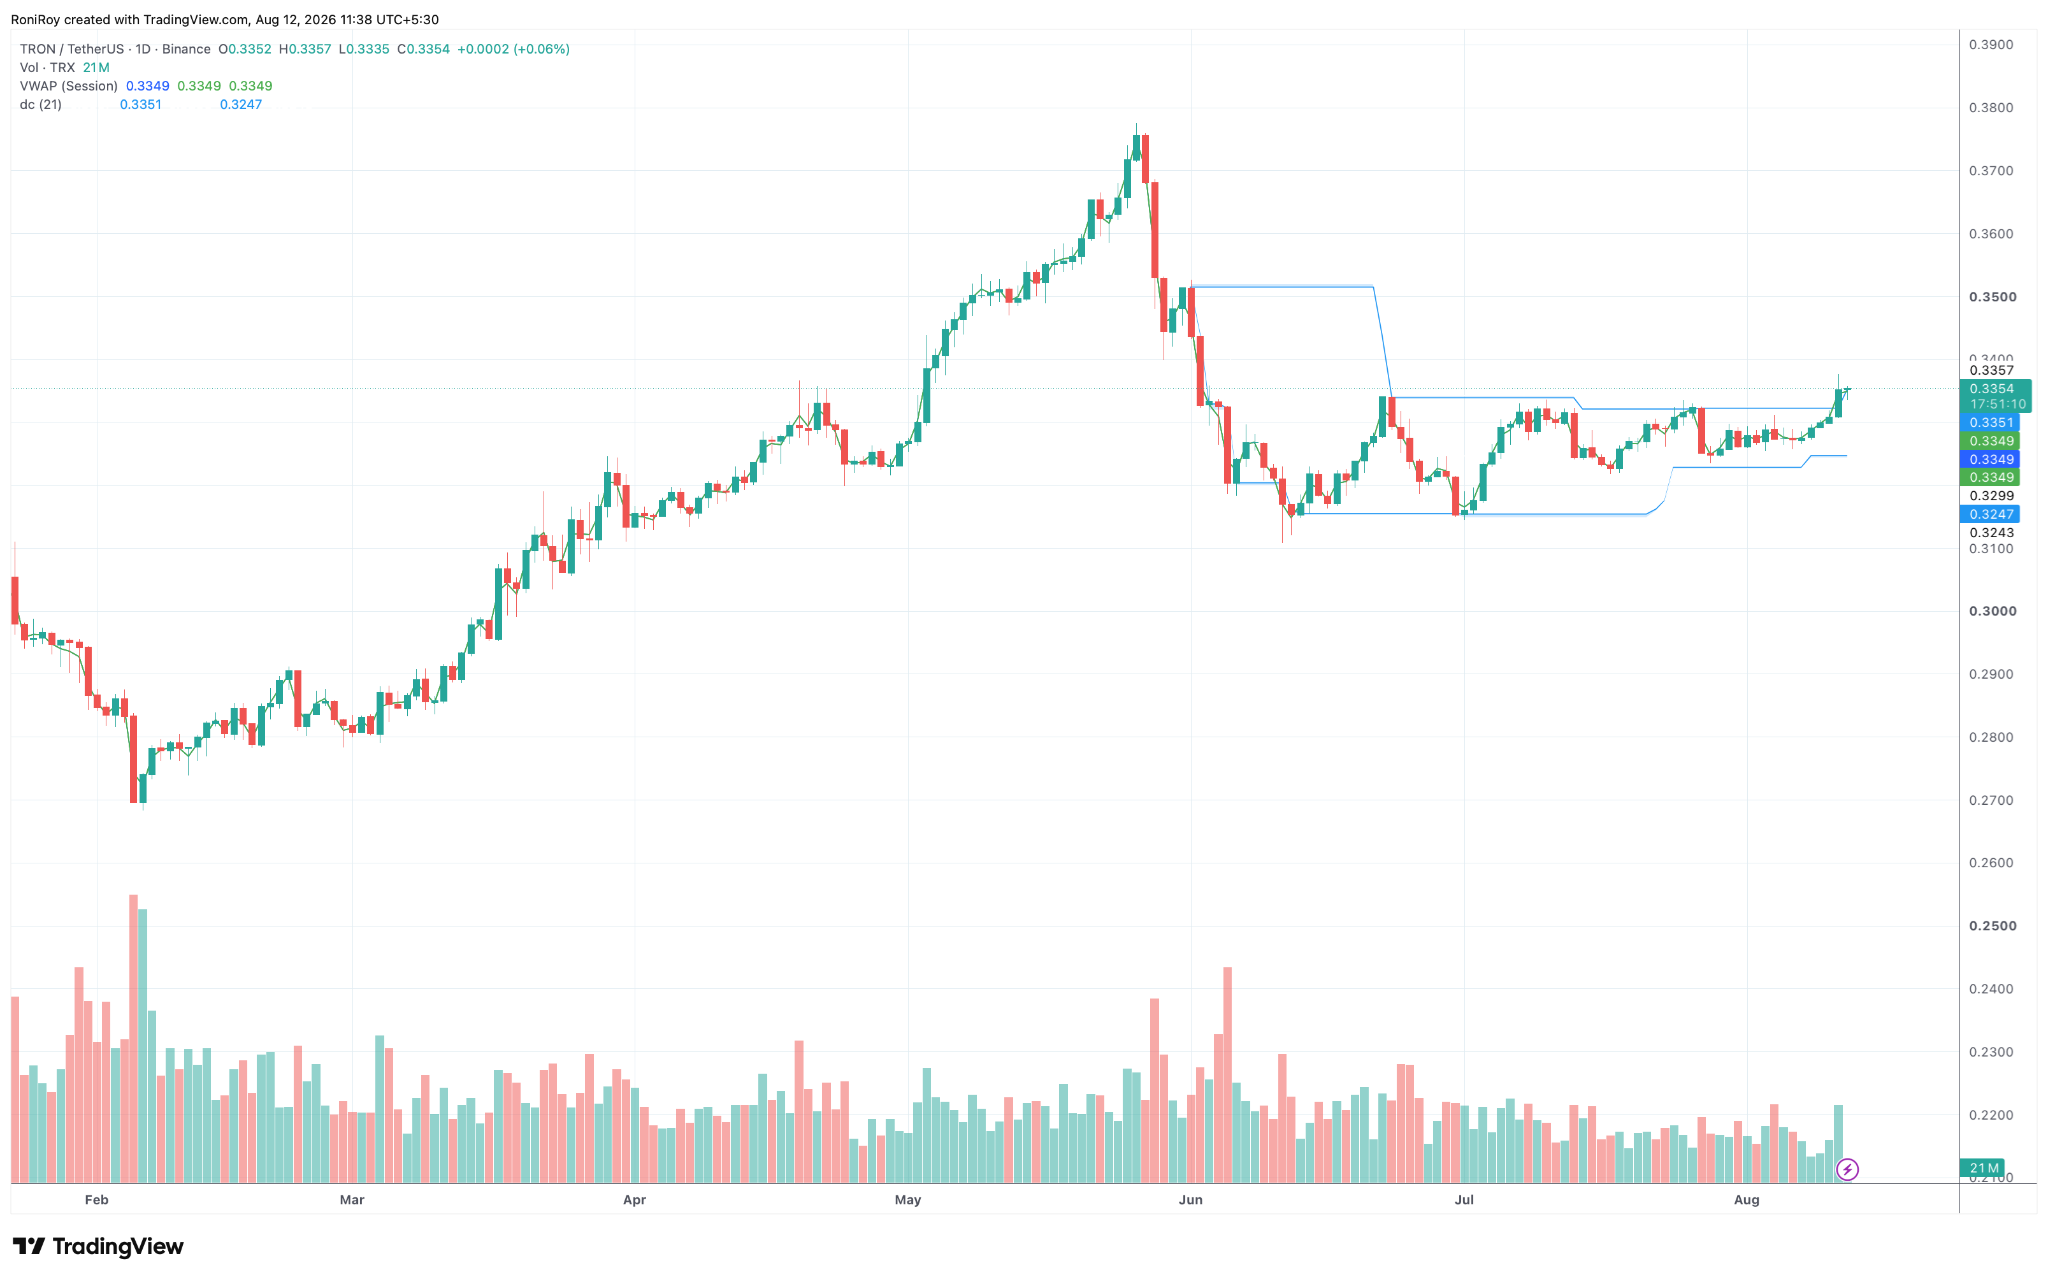
$TRX/$USDT 1-day price chart. Source: TradingView.
A daily close above the Donchian resistance will signify a definitive breakout from the recent trading range.
The initial key area to monitor would be around $0.340, followed by the $0.350 zone, which previously exhibited both support and resistance during the notable correction from May to June.
If buying momentum propels $TRX above $0.350, the significant peak from May at about $0.375 would emerge as the subsequent technical target. Achieving this from $0.335 would necessitate an increase of around 12%.
The session VWAP was approximately $0.3349 on August 12, placing $TRX marginally above the average price for the session.
Sustaining levels above this price will maintain buyer dominance in the recent move, whereas a dip below could put the breakout in jeopardy.
On the lower end, the EMA range between about $0.3276 and $0.3294 represents the first significant support area.
A failure to maintain this zone may lead to a test of the Donchian lower band near $0.3247, followed by the 200-day EMA positioned around $0.3214.