

- Experts are indicating that Bitcoin is currently navigating a range between a support level of $63,000 and a resistance threshold of $67,000, suggesting that investors should adopt a cautious stance until it surpasses $67,000.
- They noted that Bitcoin’s spot trading volume has plummeted to its lowest level since 2019, with a disparity in demand and an increase in leveraged positions, which heightens the potential for increased volatility, as indicated by trends in on-chain data and ETFs.
- However, the combination of the 200-week moving average, support at $63,000, alongside an exhausted long-term downtrend in oversold conditions, points to an increasing likelihood that Bitcoin is nearing a long-term bottom.
Trend Analysis Forecast by Timeline


Bitcoin has been trading within the $63,000 range, even as weaker inflation figures from the U.S. and declining oil prices spark optimism regarding reduced interest rate pressures. However, subdued spot trading coupled with a demand gap keeps the cryptocurrency adrift. Analysts are suggesting that while there’s growing sentiment for a long-term low, it’s best to remain cautious until Bitcoin can exceed the $67,000 mark.
As of 4:48 p.m. on August 14, Bitcoin was listed at $63,050 on Binance’s USDT market, reflecting a downward change of approximately 1.30% from the previous day. On Upbit, it was trading around $64,100. The kimchi premium, which tracks the pricing difference between South Korean and international exchanges, was at a negative 0.46%.
US Inflation and Oil Prices Decline, Lessening Rate Pressures
Recent U.S. inflation data showed lower than anticipated figures, accompanied by a drop in global oil prices, providing some stability to global markets. In contrast, the cryptocurrency sector remained lackluster, suggesting that expectations for lower rate pressures have not yet translated into significant buying interest.
The producer price index (PPI) for July, posted on August 13, showed no change from the previous month—falling short of the 0.2% increase that was expected. Core PPI, which excludes food and energy, saw a rise of 0.2% over the month, also below the projected 0.3%. Earlier reports indicated that July consumer prices increased by 0.1% compared to the prior month, in line with predictions and alleviating some fears of a resurgence in inflation.
The retreat in oil prices contributed positively to market sentiment. Despite ongoing geopolitical tensions in the U.S.-Iran situation, market attention shifted toward indications of reduced crude demand, which brought Brent crude down by over 2% intraday to nearly $87 a barrel. Concurrently, the yield on the 10-year Treasury note decreased to 4.64%, while the two-year yield dipped to 4.15%.

As reported by CME FedWatch, rates futures traders increased the likelihood of a Federal Reserve pause in September to 67.6% as of August 14, up from 59.4% the day prior. Nevertheless, market participants will continue to evaluate whether the easing inflation can significantly lessen rate pressures, even amidst rising geopolitical concerns linked to the U.S.-Iran conflict and worries over the fiscal deficit.
Bitcoin Spot Volume Hits Lowest Level Since 2019 Amid Demand Disparity
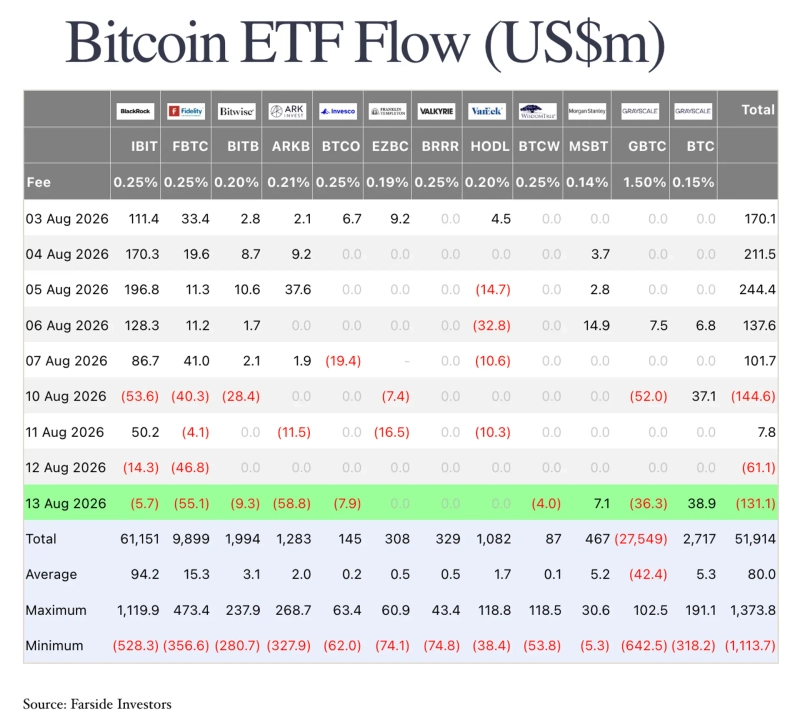
Despite spot Bitcoin exchange-traded funds experiencing net inflows of $865.3 million during the first week of August, this week has seen a reversal back to net outflows. Yet, the ongoing supportive policies and expectations surrounding supply and demand have remained resilient following news that Strategy intended to resume Bitcoin purchases by year-end, alongside advancements on the CLARITY Act by the White House, aimed at digital asset market structuring.
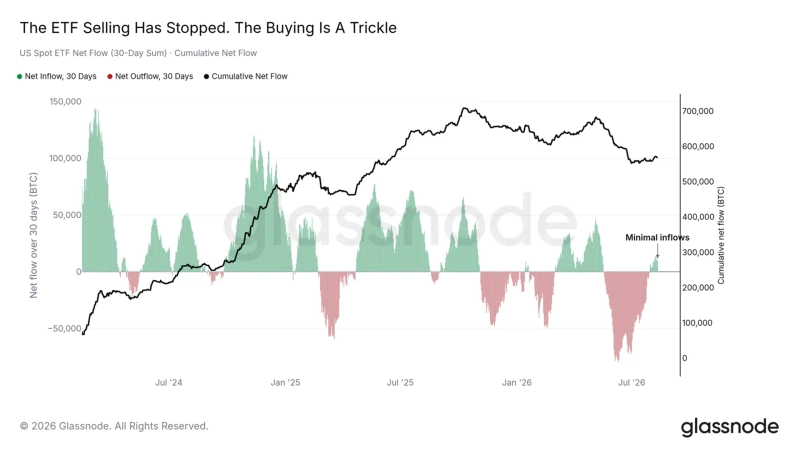
Though selling pressure for Bitcoin has recently tapered off, fresh demand has not emerged to fill the void. According to a weekly report by Glassnode, Bitcoin’s spot trading volume has now reached its nadir since 2019. The cryptocurrency is currently stabilizing around $63,000, while facing resistance approximating $68,700, which marks the average entry price for recent buyers.
Indicators suggesting seller fatigue are nearing figures last seen during previous bear market bottoms. However, the combination of weak ETF inflows and spot trading means that leverage is accumulating first, raising the probability of heightened volatility.
On-chain analyses infer that investors who purchased near peak values are beginning to cut losses, while significant holders continue to accumulate assets. Bitfinex reported that long-term Bitcoin holders experienced their first weekly decline in holdings this year, with about 210,000 Bitcoin less than the peak recorded on July 29, likely indicative of loss realization by investors who entered during the bullish cycle from last October until March.
Long-term holders of Bitcoin are not the principal sellers at this time. Wallets with a minimum of 1,000 Bitcoin have increased to 3.06 million Bitcoin, their highest count this year, according to Bitfinex.
Furthermore, signs of retail exhaustion are becoming more apparent. Santiment noted that expressions like “crypto is over” are becoming more frequent on platforms such as X (formerly Twitter), Reddit, and Telegram. As the stagnation in prices prolongs, more investors may interpret this weakness as a market failure.
Should this pessimistic sentiment deepen while Bitcoin maintains crucial price levels and selling pressure eases, the situation may instead create conducive conditions for demand seeking to capitalize at lower prices, suggested Santiment.
Bitcoin Approaches $64,000 as Analysts Anticipate Long-Term Support
Analysts emphasize that declaring a recovery is premature without Bitcoin reclaiming the $67,000 level and that support at $63,000 needs to be confirmed first.
Alex Kuptsikevich, a senior market analyst at FxPro, observed that the total market cap for cryptocurrencies has lingered near $2.19 trillion for three consecutive days, continuing the range-bound pattern that has persisted since early June. Although the potential for a sharp downward movement exists, he noted that long-term investors are still accumulating assets near the 200-week moving average of approximately $63,980.
If further declines occur, as seen in late 2022, it could lead to better entry points. However, he remarked that it’s challenging to view this as a baseline scenario and expect it without proactive measures.
According to Coinbase Research, key support levels for Bitcoin are pinned at $63,000 and between $58,000 to $59,000, with resistance at $67,000, $69,000, and $71,000. Sustaining above $67,000 could enhance the likelihood of revisiting $71,000, while a drop below $63,000 might prompt a pullback toward the $58,000 mark.
Should the $58,000 to $59,000 support range also falter, a deeper decline could ensue.
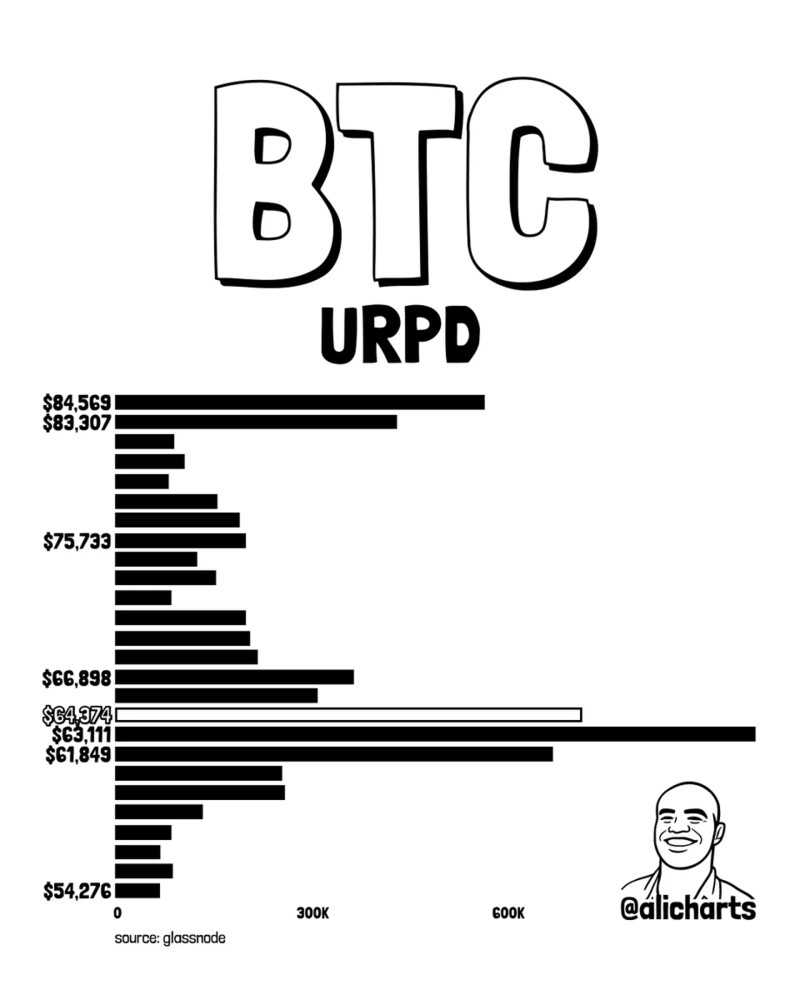
Certain analysts believe that Bitcoin’s prolonged downward trend is approaching its concluding stages. Katie Stockton, founder of Fairlead Strategies, stated that Bitcoin has entered a period where its long-term downtrend is showing signs of exhaustion across multiple time frames. The monthly charts also reveal an oversold condition, bolstering the chances of finding a long-term bottom.
Improvements in long-term momentum indicators along with the price maintaining proximity to historically significant support levels are crucial for market perspectives, according to Stockton. She noted that due to Bitcoin facing more pressure than gold, technical signals hinting at a potential long-term bottom are becoming increasingly evident.
Kang Min-seung, Bloomingbit reporter minriver@bloomingbit.io