

The value of Ethereum has dipped to around $1,875 after sellers thwarted its recent attempt to surpass the $1,900 mark, shifting focus to the $1,850 support area and surrounding liquidation clusters.
Summary
- Ethereum’s trading price was approximately $1,875 after struggling to maintain its position above the critical $1,900 threshold.
- The daily Relative Strength Index (RSI) fell to 49.72, with ETH remaining under its 20-day and 50-day moving averages.
- Concentrations of liquidation liquidity hover near $1,925–$1,950, with clusters at $1,840–$1,860 indicating potential downside movement.
- U.S. spot Ethereum exchange-traded funds (ETFs) brought in $245 million over the last week, marking a fifth consecutive week of inflows.
Ethereum Faces Setbacks Below $1,900
As reported by crypto.news, Ethereum (ETH) was valued at $1,874.90 on August 14, fluctuating between an intraday low of $1,869.32 and a high of $1,891.30. At that point, it registered a 0.6% decline on the daily chart.
This latest downturn affirms Ethereum’s struggle to maintain its footing at the $1,900 level, which has consistently attracted selling activity throughout August. Just earlier this week, prices briefly spiked above $1,920 before retreating to the $1,870–$1,890 range.
Profit-taking activities around the $1,900 mark have confined Ethereum to a limited trading range instead of fostering a clear upward trend. While buyers have defended the price from dipping below $1,850, each recovery has faltered when nearing $1,920.
The 4-hour chart echoes this sentiment of lost momentum. Following a recovery from its late June low near $1,550, ETH peaked close to $1,980 in late July but has seen multiple failed attempts to establish support beyond $1,900.
Recent sell-offs regained dominance after the short-lived rally toward $1,920 faltered. As a result, Ethereum recorded lower intraday highs and settled back at $1,875, increasing pressure on the lower boundaries of its trading range for August.
Liquidation Levels May Drive ETH Movements
According to CoinGlass’ one-week liquidation heatmap, significant liquidity concentrations reside just above Ethereum’s current price. The most prominent range is identified around $1,940–$1,950, along with another concentration near $1,925.
If Ethereum surpasses the $1,900 mark, short positions could face risks as prices move into the concentration zones, potentially prompting short sellers to close their positions and drive further market purchases, accelerating a recovery.
For this to happen, ETH needs to break through the resistance present around $1,890–$1,900. A failure to do so would leave the upper liquidity bands intact and put the market at risk of yet another test of support.
Conversely, the heatmap shows significant liquidity nearby at $1,855–$1,860, as well as a broader range around $1,835–$1,845. These levels could entice buyers if sellers manage to push Ethereum decisively below $1,850.
This situation situates Ethereum in a competitive landscape of leveraged positions. Current pricing remains within approximately $20 of the nearest downside concentration, while the major upside cluster lies $65–$75 higher.
A break below $1,850 could result in long liquidations and drive Ethereum toward $1,840. On the other hand, a close above $1,900 would pave the way towards the $1,925 region, followed by the more densely concentrated $1,940–$1,950 area.
Ethereum Indicators Show Mixed Signals Near Critical Support
The daily chart for Ethereum indicates a somewhat neutral to weak setup. The Relative Strength Index stood at 49.72, slightly below the benchmark average of 52.55 and just under the neutral 50 mark.
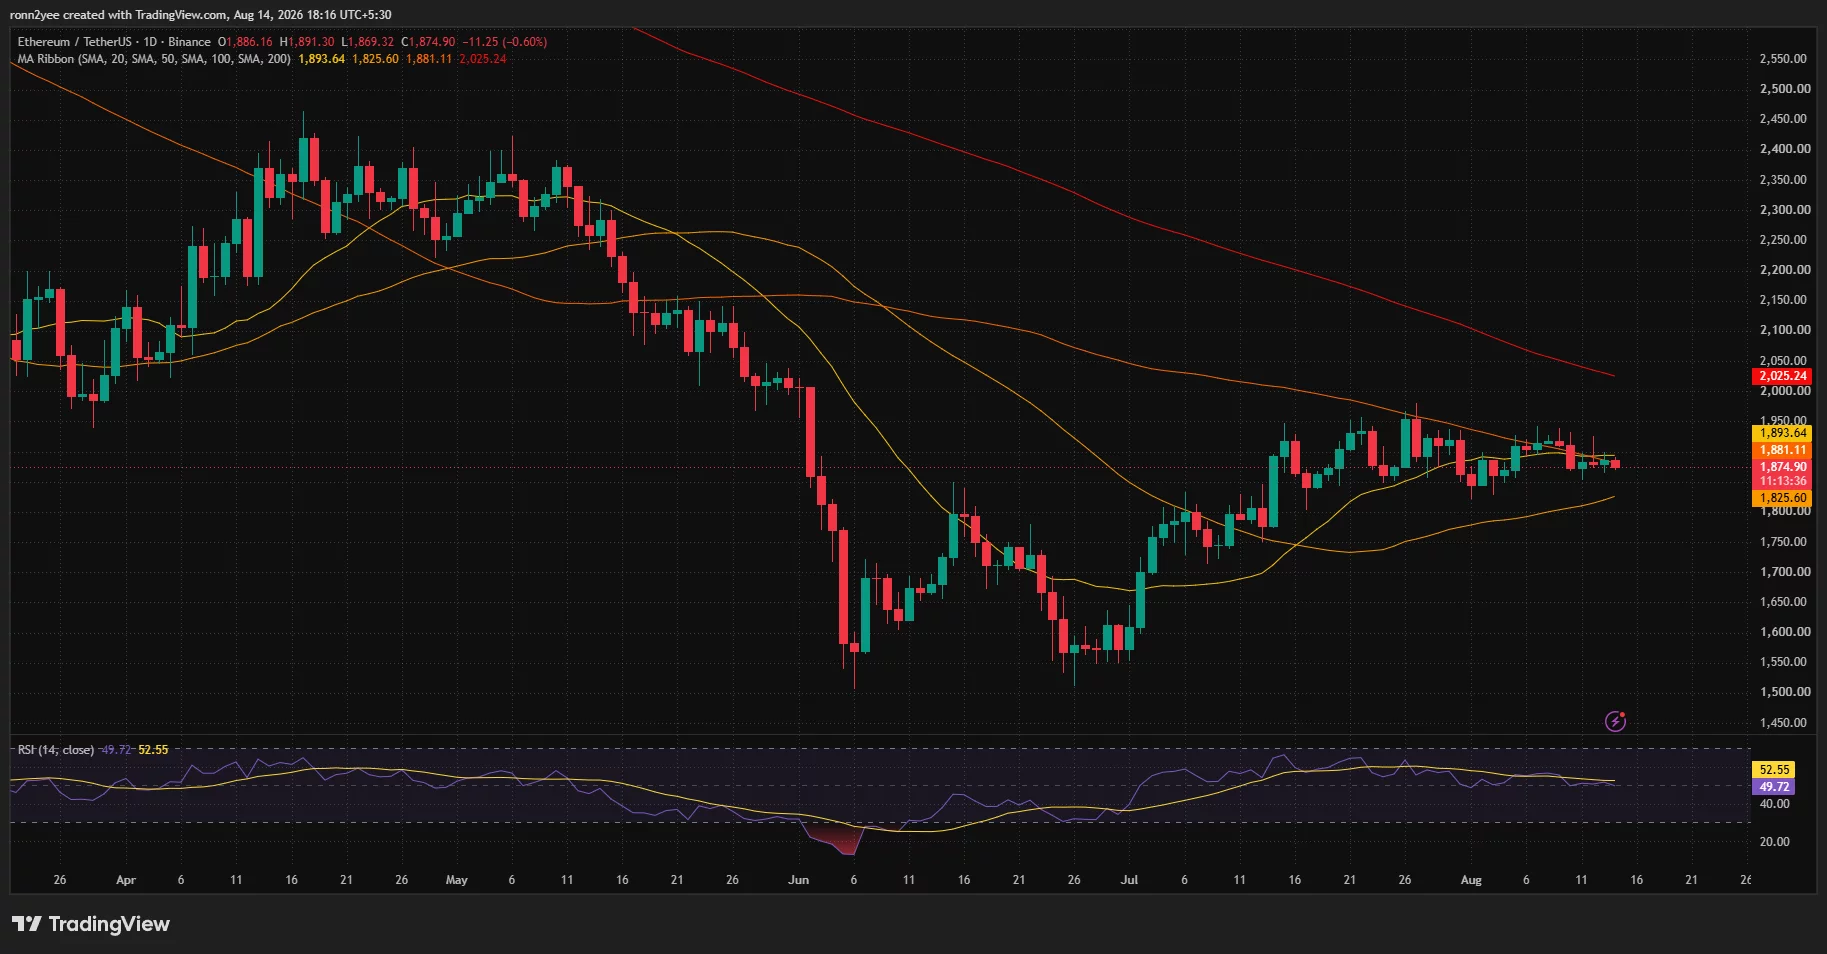
ETH traded below its 20-day simple moving average, which stood at $1,881.11, and its 50-day average at $1,893.64. Both averages have now formed immediate resistance in the same region where recent rebounds have faltered.
While the asset stays above its 100-day average of $1,825.60, suggesting a medium-term recovery since June, slipping below $1,850 would decrease the gap between the price and the 100-day average, exposing the area around $1,825–$1,840.
For long-term resistance, there’s a significant distance to cover. The 200-day moving average is at $2,025.24, indicating that Ethereum has not yet reversed the broader downtrend that began following its highs above $2,300 in April and May.
On the 4-hour chart, Aroon Up recorded 64.29% compared to Aroon Down at 14.29%. This discrepancy suggests that while the recent upward structure has not entirely disappeared, price activity has yet to confirm a renewed bullish momentum.
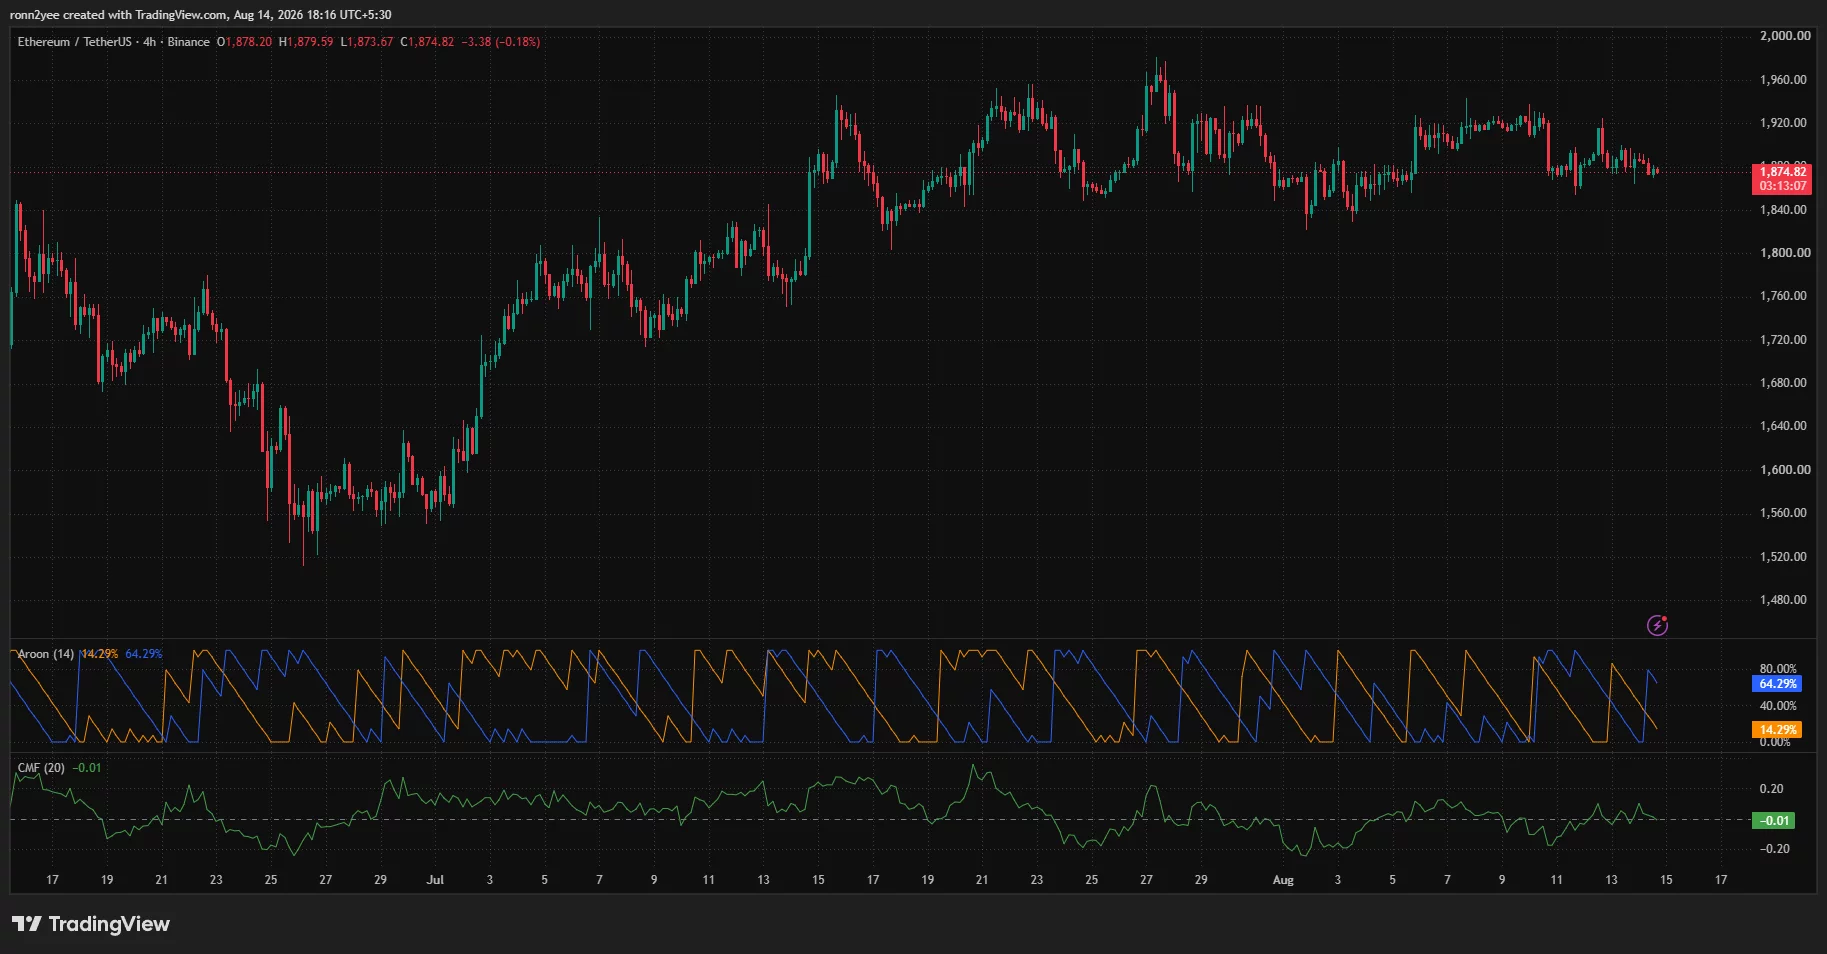
Chaikin Money Flow indicates a reading of minus 0.01, revealing a nearly balanced interplay between buying and selling pressures, albeit slightly favoring sellers. This supports the notion that Ethereum lacks the sustained inflows needed for a significant breakout.
Analysts Highlight $1,850 as Crucial Support for Ethereum
Crypto analyst Ted Pillows pointed out that Ethereum must maintain its position above $1,850, labeling it a “must-hold level” for retaining recent gains.
His analysis identifies the first resistance point around $1,955, with subsequent barriers at $2,050 and $2,190. Conversely, a drop below $1,850 could expose levels around $1,700 prior to venturing towards the more significant support area near $1,550.
The analyst’s resistance points align closely with the daily chart, where the 100-day moving average is approximately $1,826. A sustained breach below both $1,850 and this average would threaten the recovery trend established since late June.
Meanwhile, Michaël van de Poppe, founder of MN Trading, noted that Ethereum is outperforming Bitcoin, approaching the 0.03 mark on the ETH/BTC trading pair. He anticipates a potential liquidity surge if Bitcoin dips lower, while maintaining that the relative trend is strong as Bitcoin stabilizes and altcoins gain momentum.
Despite its stronger performance against Bitcoin, Ethereum still needs to overcome resistance in dollar terms. It must reclaim $1,900 and navigate through the heavy liquidity area of $1,925–$1,950 to establish a more favorable short-term outlook.
U.S. ETF Inflows Provide Some Backing, Yet No Breakout Materializes
U.S. spot Ethereum ETFs saw $245 million in net inflows for the week of August 3–7, marking the continuation of five weeks of positive growth, as reported by SoSoValue data.
BlackRock’s ETHA accounted for about $203 million of this total, while Fidelity’s FETH attracted roughly $24.2 million. Grayscale’s ETHE, however, recorded around $4.8 million in outflows during this timeframe.
This ongoing demand for ETFs offers U.S. investors regulated access to Ethereum and signals that institutional investment persists despite soft short-term price movements. Still, the $245 million in inflows has not been sufficient to push ETH through the resistance barrier between $1,900 and $1,950.
Macro trends have presented mixed signals. U.S. equity funds received $2.58 billion in the week ending August 12, influenced by softer labor data and stable inflation that lessened expectations of a Federal Reserve rate hike.
However, technology-centric funds experienced withdrawals totaling $4.62 billion during the same span. This uneven appetite for risk places Ethereum in a situation where it relies on spot demand to absorb selling pressure near $1,900, while leveraged traders are positioned on both ends of the current trading range.
Disclosure: The information presented in this article does not constitute investment advice. It is intended for educational purposes only.