

On Wednesday, Bitcoin surged past $65,000 and has climbed to approximately $73,856 since then. Factors contributing to this surge include US Treasury bond buybacks, regulatory endorsement from the White House, and a significant short squeeze, according to a key analysis.
Yet, the crucial question lingering among investors and market watchers remains: Is Bitcoin in the midst of a genuine bullish cycle, or are we witnessing a classic bull trap?
Is Bitcoin’s recent movement a bull run or a bull trap?
Structurally, Bitcoin’s current behavior resembles the 2022 bear market, even considering the FTX fallout. This suggests the possibility of a similar rally following that year’s downtrend.
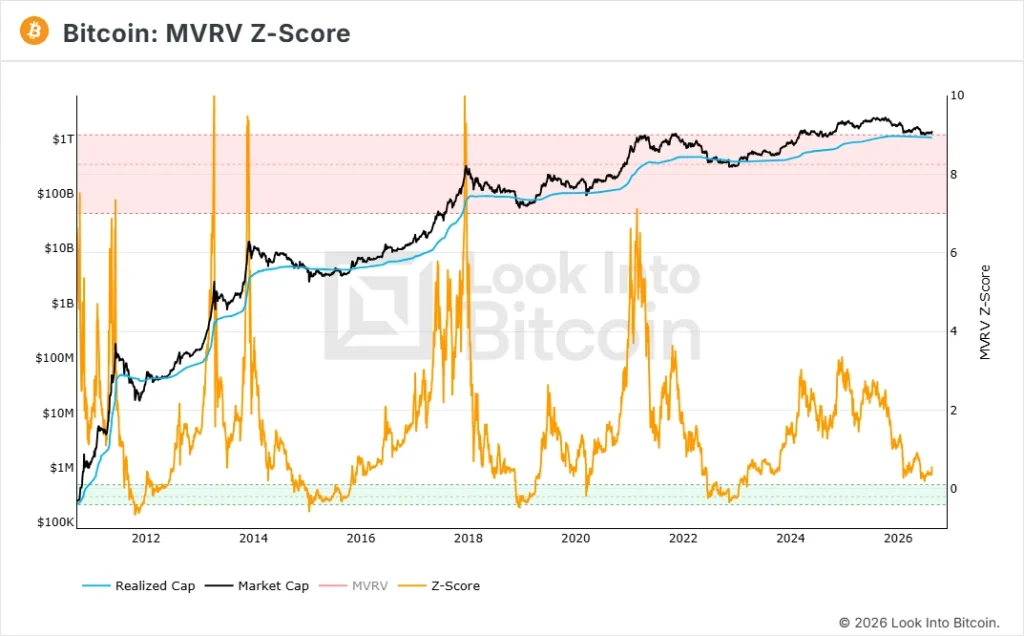
Moreover, the MVRV (Market Value to Realized Value) Z-score is presently at 0.56, indicating neutral conditions where the prices are determined by on-chain fundamentals rather than speculative enthusiasm.

Source: Look Into Bitcoin
Next, the weekly Relative Strength Indicator (RSI) currently sits at 49.5, indicating a critical point of transition. Supporting the bullish case, BTC initially printed lower lows around $59,000, while the RSI demonstrated higher lows.
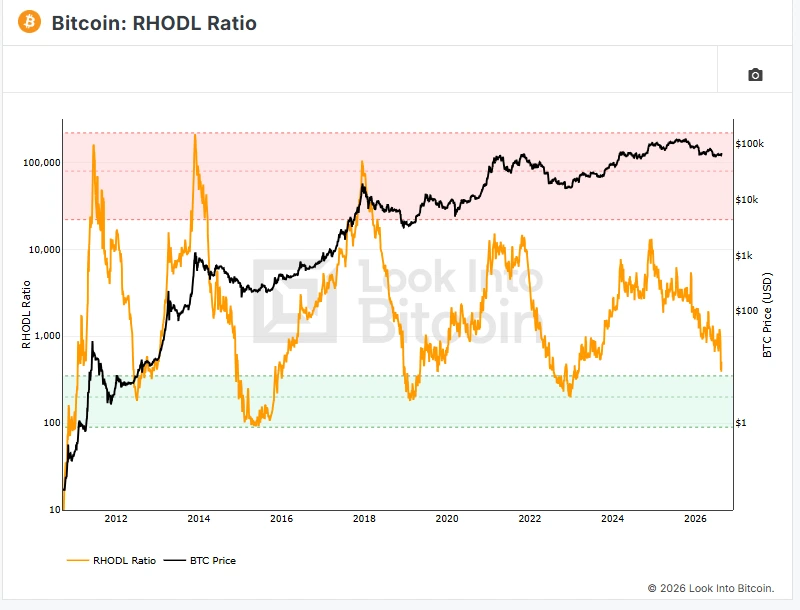
Furthermore, the Realized HODL (RHODL) Ratio is moving closer to the green zone, signaling a shift towards long-term holders and away from speculative traders. Historically, this metric has effectively pinpointed market bottoms in 2015, 2018, and 2022.
Source: Look Into Bitcoin
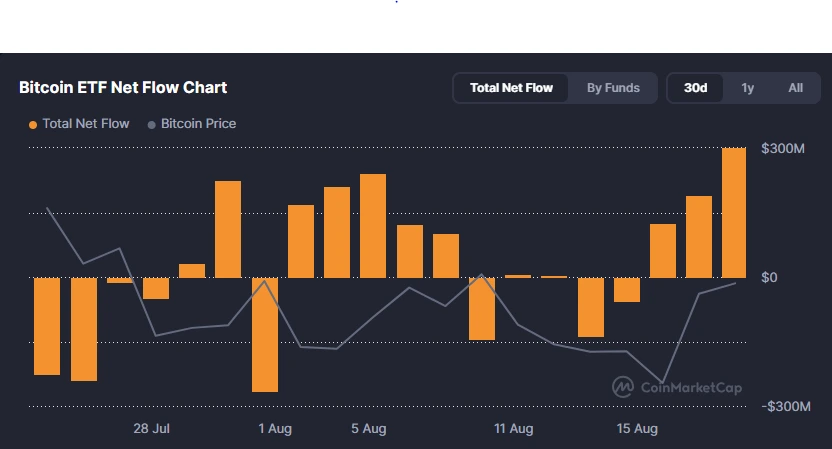
Additionally, Bitcoin spot ETF inflows are on the rise, with these products accumulating over $1 billion in net inflows over a three-day period that saw $517.2 million on Wednesday alone. This robust spot demand is a strong indicator of a potential bullish reversal.
Source: CoinMarketCap
Following this, the Satoshimeter currently shows a low of 2.57. Previous capitulation phases have reached lows around 1.6, but current trends indicate a possible stabilization.
Finally, the recent rally appears largely influenced by a cascade of short squeezes (with over $3B out of $3.5B liquidations affecting short positions) rather than authentic demand. However, this situation seems to be evolving, as the spot Cumulative Volume Delta (CVD) has turned positive, signifying that major investors are taking advantage of the breakout.
The conclusion
It’s worth noting that the spot CVD remains approximately 40% below its 200-day moving average. Genuine macro expansions are characterized by a sustained increase in spot CVD over several weeks, reflecting an ongoing absorption of selling pressure.
In summary, while most indicators suggest a market bottom, the demand for spot trading needs to persist to affirm solid bullish momentum. A weekly close above $68,000 followed by a move toward $75,000 could set the stage for Bitcoin reaching $100,000 by the end of the year.
Did you find this information useful?
End of Story
Your Trust is Important to Us:
Since 2017, CoinPedia has been providing timely and accurate updates in the realms of cryptocurrency and blockchain. Our content is produced by a knowledgeable team of analysts and journalists, adhering to strict Editorial Guidelines based on E-E-A-T: Experience, Expertise, Authoritativeness, and Trustworthiness. All articles undergo fact-checking against reputable sources to ensure accuracy, transparency, and credibility. Our review policy guarantees impartial evaluations when recommending exchanges, platforms, or tools. We aim to provide up-to-date news encompassing everything related to crypto and blockchain, from startups to industry leaders.
Investment Advisory:
All opinions and insights expressed reflect the author’s perspectives on the current market climate. Conduct your own research prior to making any investment decisions. Neither the author nor the publication bears responsibility for your financial choices.
Advertisements and Promotions:
Sponsored content and affiliate links may appear on our website. Advertisements are clearly marked, and our editorial content remains entirely independent from our advertising partners.
Explore the Next Update