

The value of Ethena has surged over 34% in just 24 hours, reaching approximately $0.125, thereby marking an impressive increase of over 46% within the past week. This notable rise comes in response to the introduction of a new $1 billion institutional lending initiative and a significant break from a prolonged period of price stagnation.
According to data from CoinGecko, the price of $ENA hit around $0.125 on August 21, up from about $0.093 just one day prior, with trading volumes experiencing a sharp uptick during this price movement.
This upward trend was sparked by FalconX’s announcement on August 19 regarding a $1 billion secured warehouse financing deal involving Ethena. This arrangement allows assets supporting $USDe to be utilized for overcollateralized loans aimed at institutional clients.
FalconX will manage and originate these loans, with collateral stored with approved third-party custodians.
Ethena gains exposure to these loans through a special purpose vehicle, which is structured to offer secured institutional credit using capital derived from $USDe assets.
This partnership provides Ethena with an additional stream of income in addition to its existing crypto basis strategies traditionally employed by $USDe.
FalconX emphasized that this facility allows for access to overcollateralized institutional loans and a new source of returns, extending beyond the typical crypto basis trades.
Part of $USDe‘s strategy involved delta-neutral methods that combine spot crypto positions with short derivative positions.
Returns from these strategies can vary as perpetual futures funding rates fluctuate, making the new lending avenue a viable option for Ethena to allocate reserve assets.
The timing of $ENA‘s price increase is notable. The FalconX agreement was revealed on August 19, coinciding with $ENA trading around the low $0.09 range, while the most significant gains occurred over the subsequent two days.
Intraday charts from CoinGecko indicated that $ENA surpassed $0.10, then continued upward past $0.11 and $0.12 as trading volumes soared.
Rather than a rapid reaction to the announcement, the price rally accelerated after $ENA broke free from a range that had confined it for most of August.
This rally has also benefited from broader market trends within the cryptocurrency space.
Bitcoin regained momentum past $75,000 following the US Treasury’s decision to double its investments in older long-term government bonds, while renewed interest in US crypto regulations also boosted market sentiment.
Thus, $ENA‘s breakout occurred alongside a general return to buying across major crypto assets, providing additional momentum to its unique catalysts.
$ENA Price Analysis
See below:
$ENA/$USDT 4-hour price chart. Source: TradingView.
At the time of this chart, $ENA was valued near $0.126, compared to a Bollinger Band upper limit of approximately $0.122 and a mid-band around $0.0944.
Trading above the upper Bollinger Band highlights the rapid move of $ENA from its recent price range, and the widening bands indicate increased volatility amid this rally.
The chart also documented a notable rise in trading volume as $ENA surpassed the $0.10 mark, indicating stronger participation in this breakout compared to prior consolidation trading.
Simultaneously, the 4-hour Relative Strength Index reached 91.5, significantly above the 70 level typically interpreted as overbought. The RSI moving average hovered around 72.8.
Even though these indicators suggest robust momentum, they also render $ENA susceptible to a short-term correction if buying pressure does not persist.
On the daily chart, $ENA has ascended above its 20-day EMA at $0.0928, 50-day EMA at $0.0889, and 100-day EMA at $0.0931.
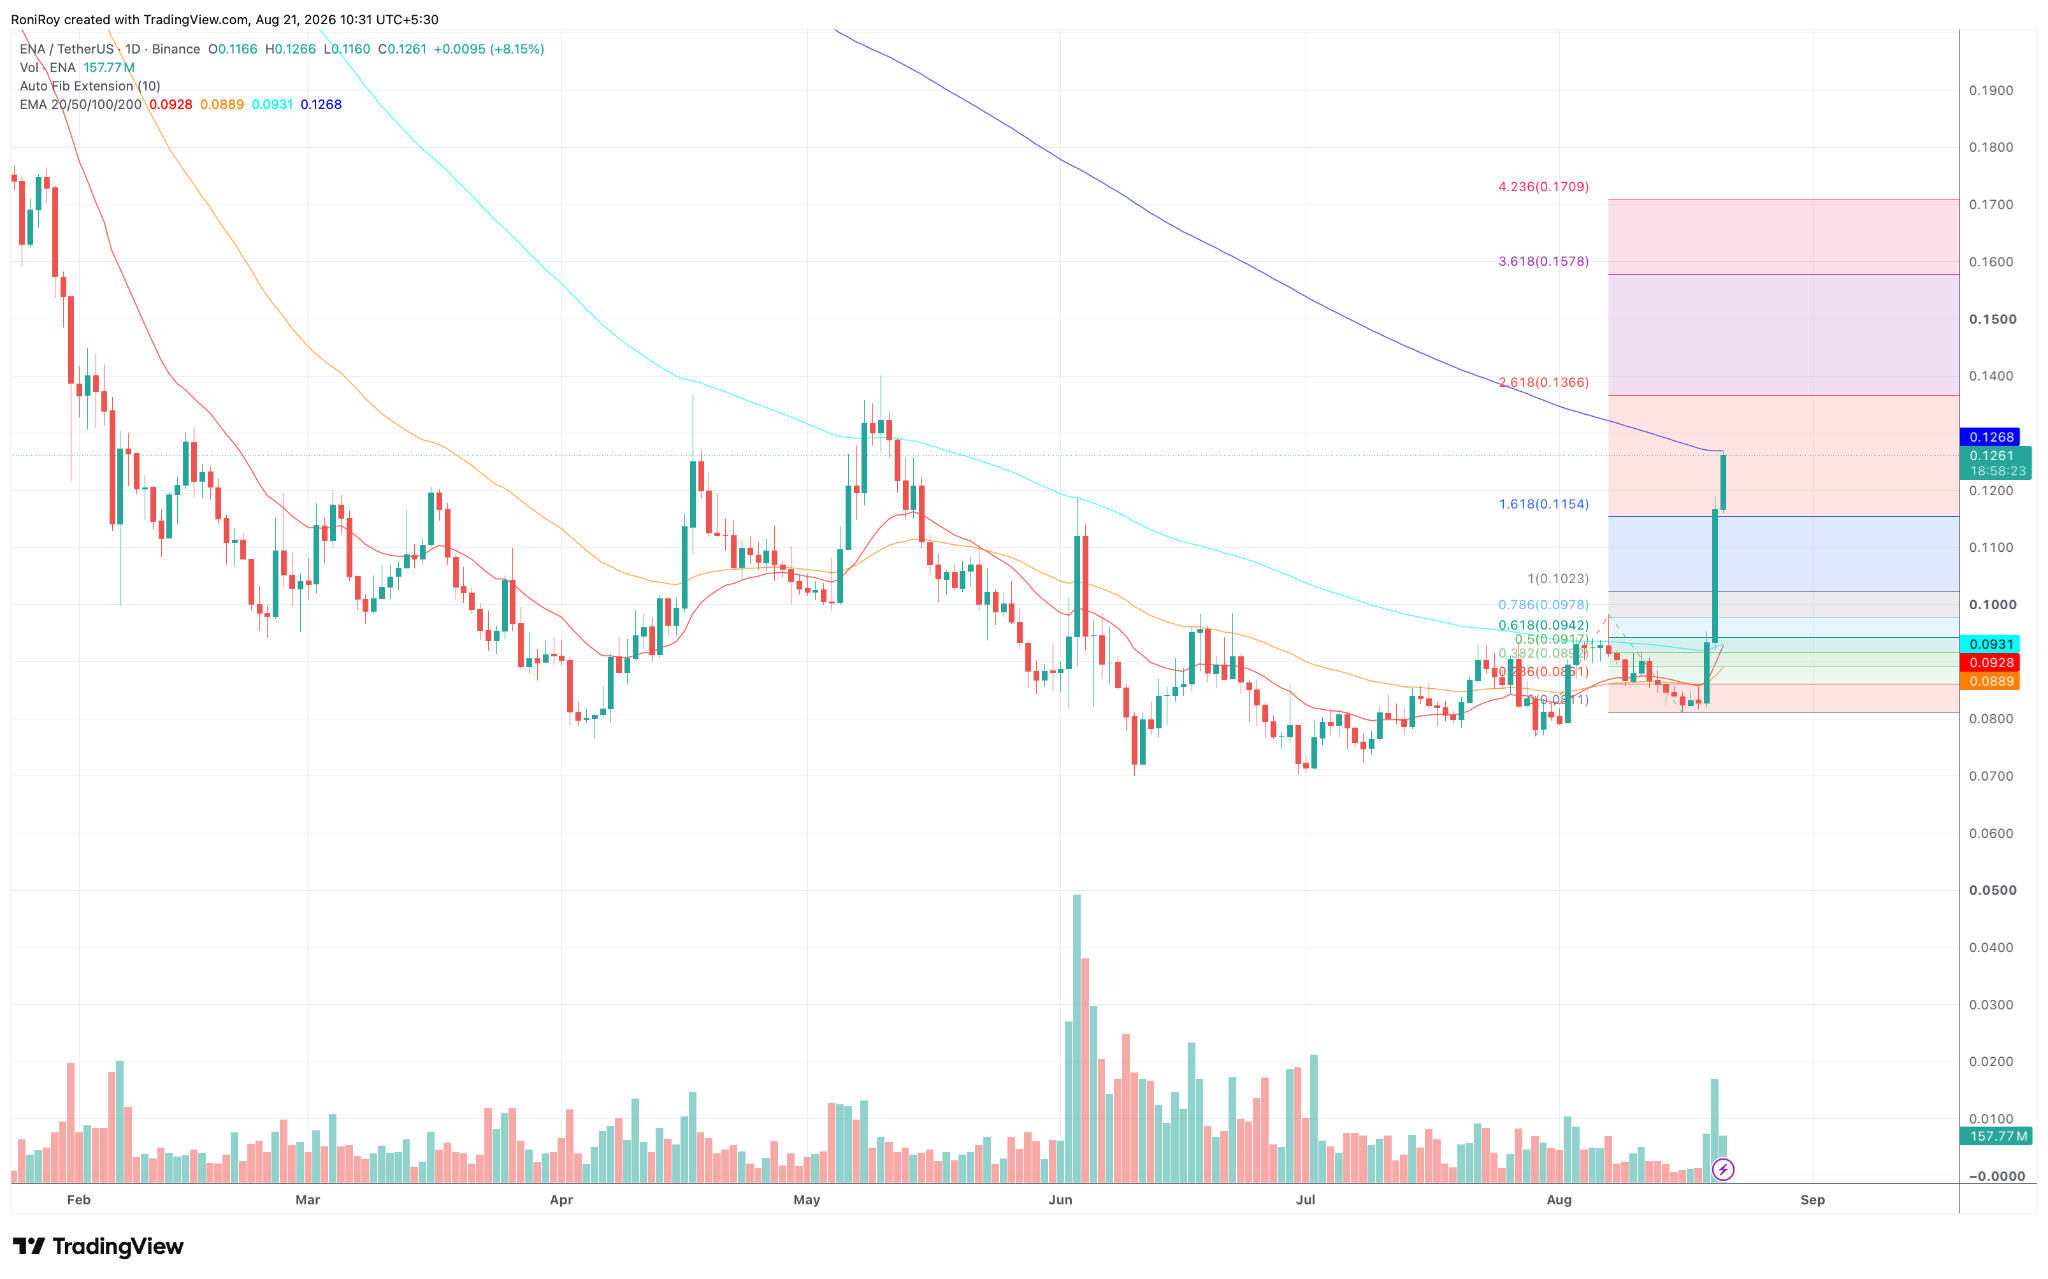
$ENA/$USDT 1-day price chart. Source: TradingView.
The next resistance level is just above the current trading price, with the 200-day EMA located around $0.1268.
A daily close above the $0.1268 threshold would elevate $ENA above all four moving averages depicted in the chart and may open the pathway to further Fibonacci extension levels.
The daily Fibonacci extension indicates that the 2.618 level stands at $0.1366, positioning the $0.136-0.137 range as the initial upside target if $ENA manages to clear the 200-day EMA.
Additionally, the 3.618 extension at $0.1578 represents a secondary target, while an extended rally could bring the 4.236 level near $0.1709 into play.
Meanwhile, the Fibonacci structure identifies the 1.618 extension at $0.1154, a level $ENA has already surpassed.
If momentum fades during the breakout, the range around $0.115-0.116 may emerge as a key area to monitor during any retracement, followed by the previous breakout zone of approximately $0.102-0.098.
Given that the 4-hour RSI is already over 90 and the price is trading outside the upper Bollinger Band, $ENA appears stretched in the short term.
Achieving a move towards $0.1366 likely necessitates the token maintaining support above the recently cleared $0.115 zone and securing a daily close above the 200-day EMA at $0.1268.