
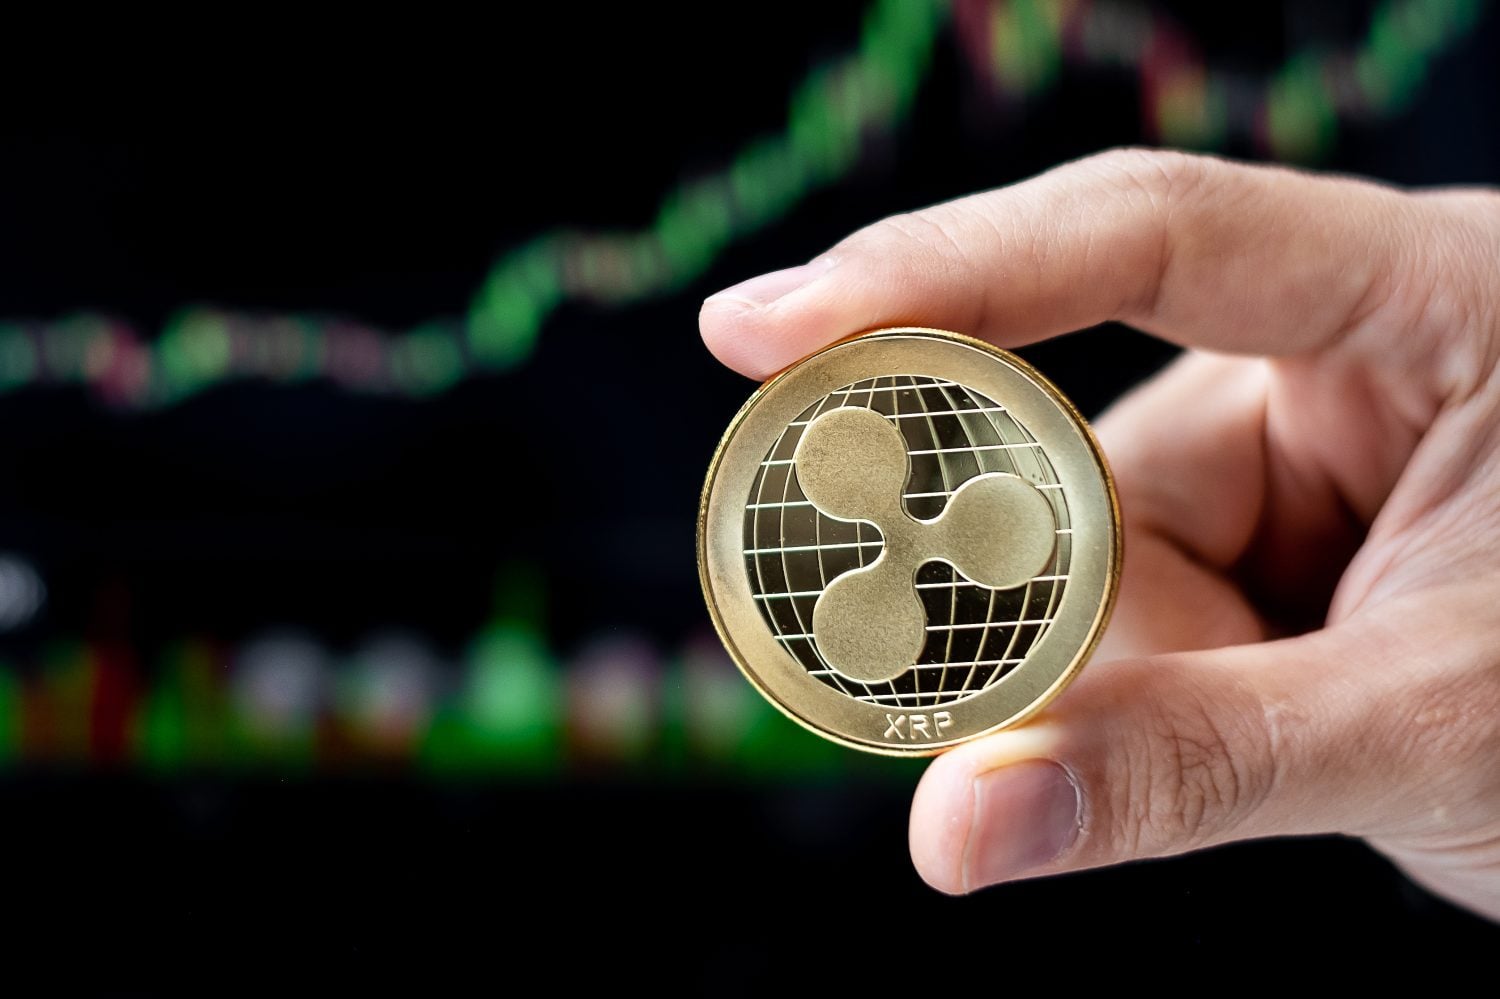
A rare signal that surfaces only once every few years has just emerged on the monthly chart for XRP, and market analysts suggest it could lead to a significant 20% price increase if XRP can navigate through two challenging supply zones.
This post may contain affiliate links, and Flywheel Publishing might receive compensation for actions taken through them.
XRP (CRYPTO:XRP) has shown impressive growth recently, moving closer to $1.13 this week, coinciding with the appearance of a closely monitored signal on its monthly chart. Analyst Ali Martinez highlighted it on X as a TD Sequential buy signal, which has brought XRP back into focus.
Martinez points out that if XRP can surpass the $1.13 mark, it may surge towards $1.30 or even $1.35, representing a potential 15% to 20% increase from its current trading level. However, this hinges on a single indicator. Could XRP achieve a 20% increase and reclaim the $1.30 level it previously held during the first half of the year before declining in June?
Understanding XRP’s TD Sequential Buy Signal
After a prolonged downturn that saw XRP descend from its peak of $3.65, the TD Sequential signal has just completed on its monthly chart, indicating that the year-long downtrend may be losing momentum.
The TD Sequential is a method developed by trader Tom DeMark to identify when a trend is weakening. It counts the number of price candles, signaling a buy when nine consecutive candles close lower than the candle four periods earlier. Essentially, this reflects a prolonged phase of selling. The appearance of the ninth candle is marked with a “9,” suggesting that sellers may be losing control, making a rebound more likely.
On an hourly chart, TD signals frequently appear but hold little meaning, as a single hour of trading has minimal impact on the broader trend. However, this signal completed on the monthly chart, where each candle represents a month of trading activity, making it substantially more significant. Therefore, a monthly “9” for a significant asset like XRP garners considerable market interest.
It’s crucial to clarify what this signal indicates and what it doesn’t. It suggests potential exhaustion among sellers, not a confirmed turnaround. This means selling might be tapering off, not that buying has commenced, and experienced traders often wait for additional confirmation from subsequent candles before placing trust in it.
Evaluating the Strength of the XRP Buy Signal
What sets this setup apart from a standard chart pattern is that multiple indicators are aligning. The Moving Average Convergence Divergence (MACD), another key momentum indicator, has also shifted to a buy signal for XRP. When two independent indicators reinforce each other, it strengthens the overall signal.
Additionally, the Relative Strength Index (RSI) has risen back to around 53, indicating a neutral position. It is no longer reflecting extreme oversold conditions observed during the downturn, suggesting that heavy selling has subsided.
XRP’s price movement also supports these signals. In recent weeks, XRP has maintained the $1 threshold while much of the market looked weak, and this week it has shown resilience, moving back toward $1.13. This price level has held firm while momentum indicators have quietly shifted, forming a solid base that hints at the early stages of a potential recovery.
Nevertheless, it’s essential to note the limitations of this situation. A reduction in selling doesn’t necessarily equate to a reversal. All these signals indicate that bearish pressure may be waning, not that bullish forces have come into power. Therefore, it’s a robust setup still awaiting a confirmation.
Is a 20% Rally Possible for XRP?
The TD Sequential signal indicates that selling appears to be waning, but it does not provide insight on whether a rally is imminent or how high the price could rise. The 20% potential target comes from Ali Martinez’s analysis, based on the trajectory XRP might follow if the selling exhaustion results in a real recovery. However, XRP needs to overcome two obstacles first.
The initial hurdle is the $1.13 level, which has historically hampered XRP’s upward movements. The 50-day moving average also sits just above this level, meaning substantial buying pressure is necessary for a breakout. So far, XRP has only approached this level without breaking through.
If XRP manages to rise above $1.13 and sustain it, a larger barrier lies ahead. Approximately 22.8 million XRP were purchased in the $1.18 to $1.19 range, with another 27.4 million around $1.21 to $1.22. These price levels represent points where many holders will aim to break even, leading a significant portion to sell there to avoid further losses. As such, a substantial supply wall exists between $1.13 and the $1.30 target.
Should XRP surmount both barriers, a 20% move becomes feasible. It would need to clear and sustain above $1.13, navigate the supply between $1.18 and $1.22, and then the $1.30 to $1.35 range would be within reach. This represents an increase ranging from 15% to 20% at the high end.
Factors That Could Propel XRP Higher
To see a rally, XRP needs more buyers, and the chart itself does not generate them. While a signal may suggest sellers are tired, it will take new investment to push prices higher, and a “9” on a monthly candle does not equate to new capital influx.
Increased buyer interest will likely occur once XRP’s regulatory clarity is established, allowing for greater institutional and bigger fund participation. This is what the CLARITY Act aims to do, securing the classification of XRP as a digital commodity, ensuring that a future administration cannot reverse this designation.
With regulatory clarity in place, institutional interest in XRP that has been absent could finally materialize, a development that no chart signal can independently generate. Absent this shift, a languishing downtrend could just as easily maintain a sideways trajectory as it could rebound.
Moreover, the TD Sequential signal has been incorrect in the past, leading to substantial losses for traders who relied on it without skepticism during previous cycles. Thus, while it’s a positive indicator for monitoring XRP, it shouldn’t be seen as a guarantee for investment. Until XRP can demonstrate a decisive break above $1.13, the door to a 20% increase remains unlocked, yet unentered.
For inquiries or corrections, please reach out to [email protected].