

Ethereum surged past $1,930 before retracting to around $1,850, with an early-week boost fueled by ETF investments and lower macro uncertainty succumbing to renewed geopolitical and economic pressures.
According to CoinGecko, Ethereum ($ETH) reached an intraday peak of approximately $1,931 on July 15, marking its highest point in several weeks before subsequently dropping to about $1,850 within 24 hours.
The cryptocurrency was down roughly 3.5% on that day as this report was being compiled, yet it maintained over a 4% increase for the week.
Multiple factors contributed to the initial ascent.
Weaker-than-anticipated US economic indicators, notably soft labor market statistics, heightened the speculation that the Federal Reserve might adopt a more lenient monetary policy sooner than expected.
The declining dollar and a stronger appetite for risk assets prompted more buying across the crypto market.
Additionally, institutional interest revived as spot Ethereum ETFs experienced a turnaround from a protracted phase of outflows.
Around July 15, financial products such as BlackRock’s iShares Ethereum Trust recorded new net inflows, increasing buying pressure as institutional investors re-entered the market.
With $ETH breaking through resistance levels in the $1,800-$1,840 range, derivatives markets provided further impetus.
Short sellers had to close bearish positions, resulting in a wave of liquidations that propelled the token past $1,900 before the rally fizzled out.
However, the comeback quickly lost momentum as overarching macro risks emerged.
Renewed strains in US-Iran relations triggered a broader pullback in financial markets, impacting technology stocks as well as cryptocurrencies.
Simultaneously, increasing crude oil prices rekindled worries about persistent inflation, dampening expectations for immediate rate cuts by the Federal Reserve.
Longer-term US Treasury yields also rose amid geopolitical tensions.
Increasing government bond yields generally detract from the attractiveness of high-risk assets, while diminishing Ethereum’s staking returns appeal for institutional investors.
As a significant portion of the rally toward $1,930 relied on leveraged futures positions, the subsequent drop accelerated when $ETH dipped below approximately $1,880.
Declining prices compelled leveraged long traders to liquidate their positions, which heightening selling pressures and pushed the token back toward the mid-$1,800s.
In addition to immediate macro challenges, Ethereum continues to grapple with longer-term structural issues.
Layer-2 solutions such as Base and Arbitrum have attracted an increasing proportion of transaction activity away from Ethereum’s main chain following the Dencun upgrade, diminishing fee revenues and weakening the token-burning mechanism.
The anticipated Glamsterdam upgrade, expected to enhance scalability and lower gas fees, has also been postponed until later in the third quarter, leaving investors without a significant near-term catalyst.
Ethereum Price Overview
Technically, Ethereum is currently undergoing a pullback after failing to maintain levels above $1,900, though the broader recovery since late June remains intact.
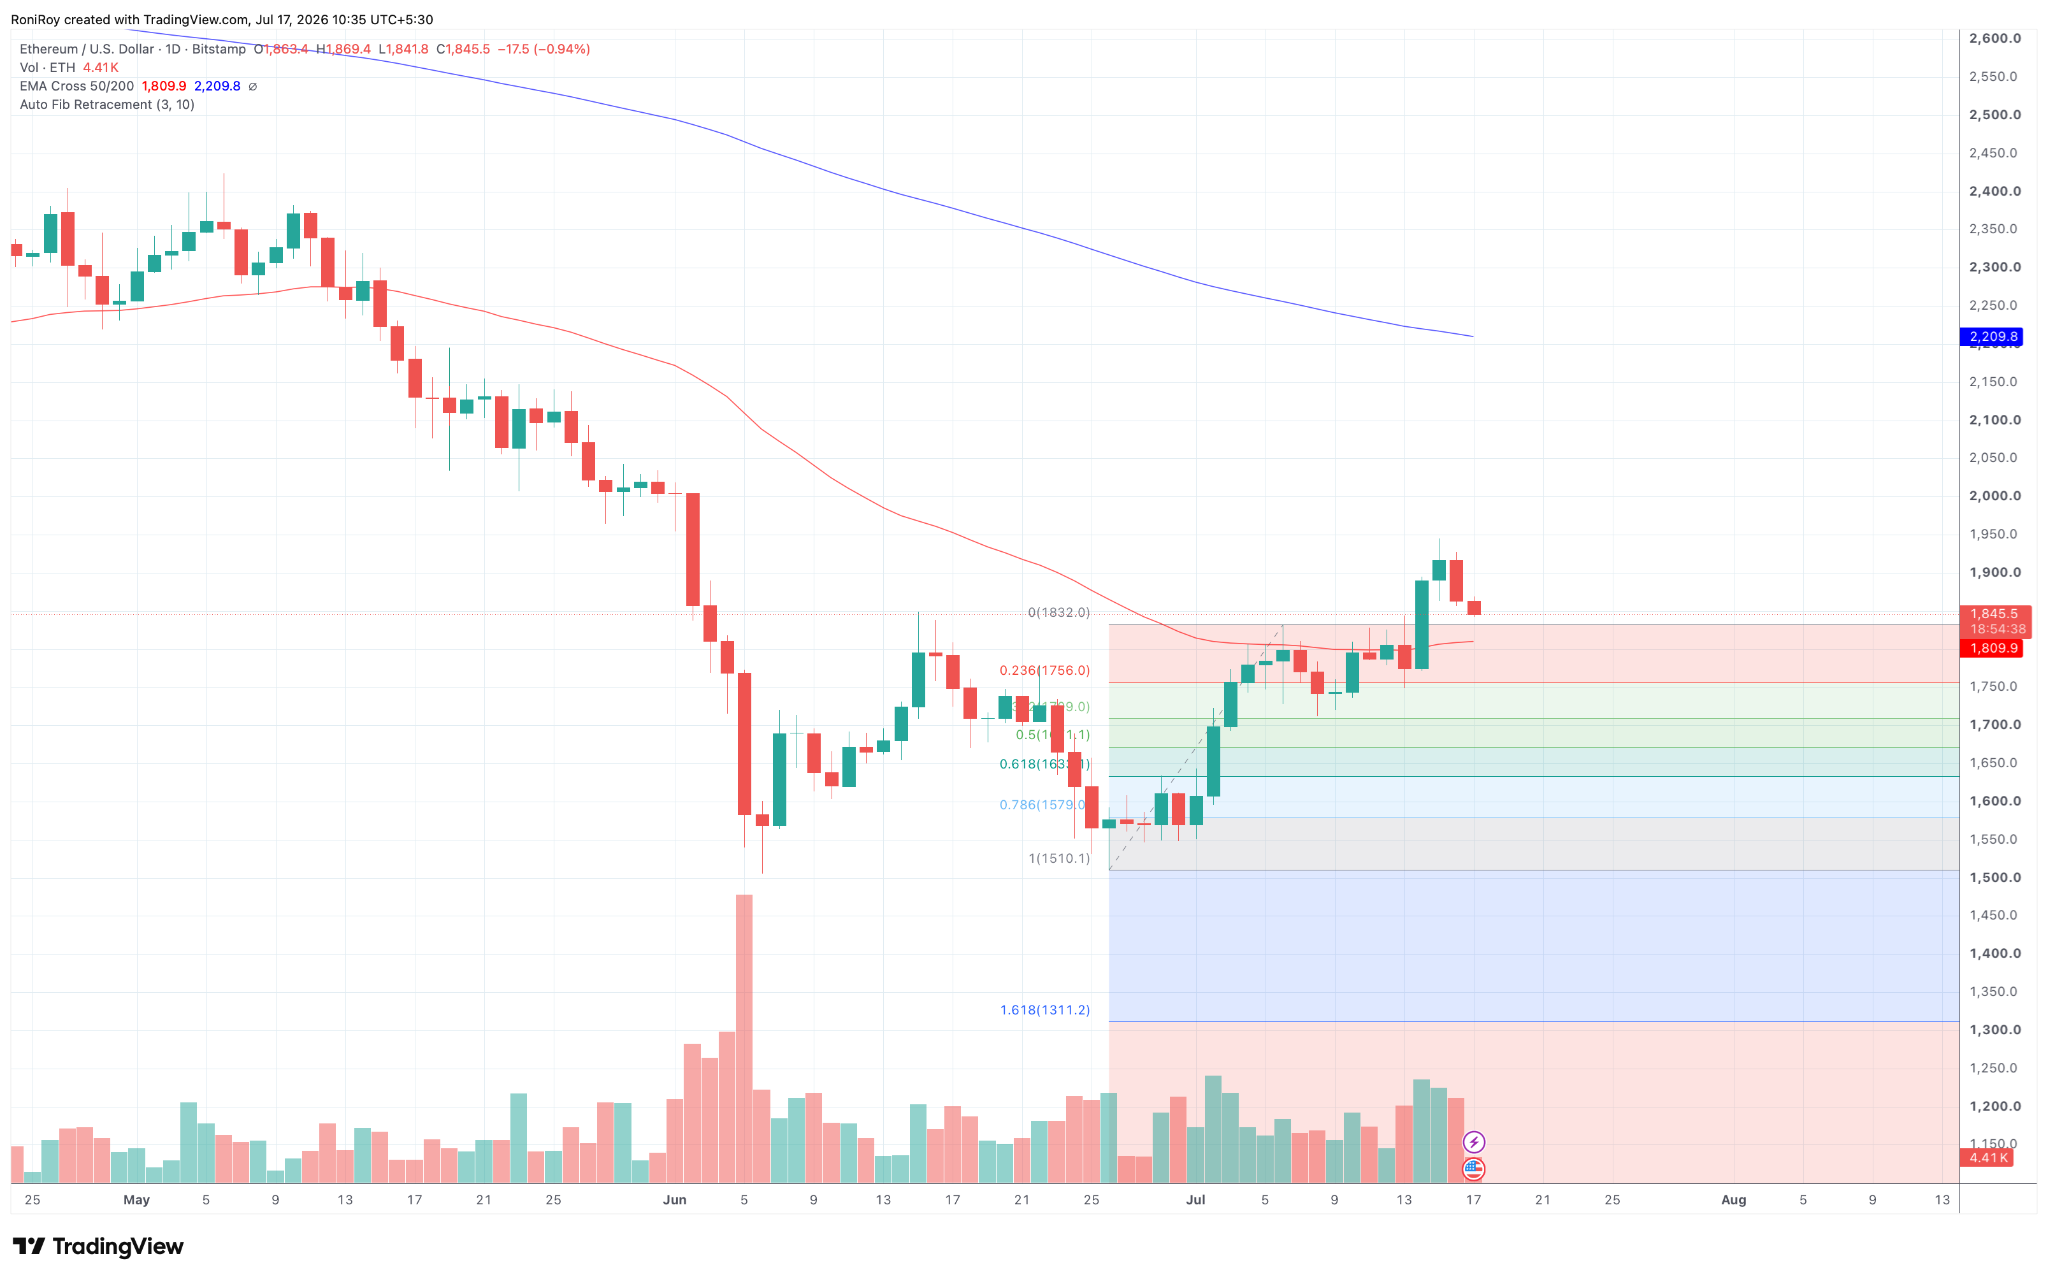
The daily chart illustrates that $ETH has fallen back from the recent peak near $1,931 towards the 50-day exponential moving average, while still trading beneath the 200-day EMA.
$ETH/USD one-day price chart. Source: TradingView.
This indicates that buyers have regained some momentum in recent weeks, despite the longer-term trend not yet fully turning bullish.
The present decline has brought prices to the 0.5 Fibonacci retracement level around $1,846, where buyers have started to show support.
Should prices dip below this, the 0.618 retracement near $1,823 would represent the next crucial point.
A breach of that level could open up declines toward the $1,785-$1,750 range, which corresponds with the 100-day and 200-day EMA cluster on the four-hour chart.
The four-hour perspective indicates that short-term momentum is weakening following a rejection near the 0.236 Fibonacci level around $1,898.
$ETH/USD four-hour price chart. Source: TradingView.
The price has registered lower highs over the past 24 hours, with sellers gradually nudging the token back toward the midpoint of its recent trading range.
If buyers manage to reclaim the $1,900-$1,930 bracket, attention could shift back toward the next horizontal resistance zone around $2,100-$2,160.
If support around $1,823 is lost, the risk of retesting the $1,750 level increases, a threshold critical for sustaining the recent recovery.
Analysts Divided on Ethereum’s Future Direction
Email analysts exhibit contrasting views regarding whether Ethereum is on the path to a durable recovery or still caught within a broader downtrend.
Crypto analyst Daan Crypto Trades stated that $ETH has successfully turned the $1,750 horizontal level into a support mechanism, representing the first notable reclaim of a prior resistance area during this downturn.
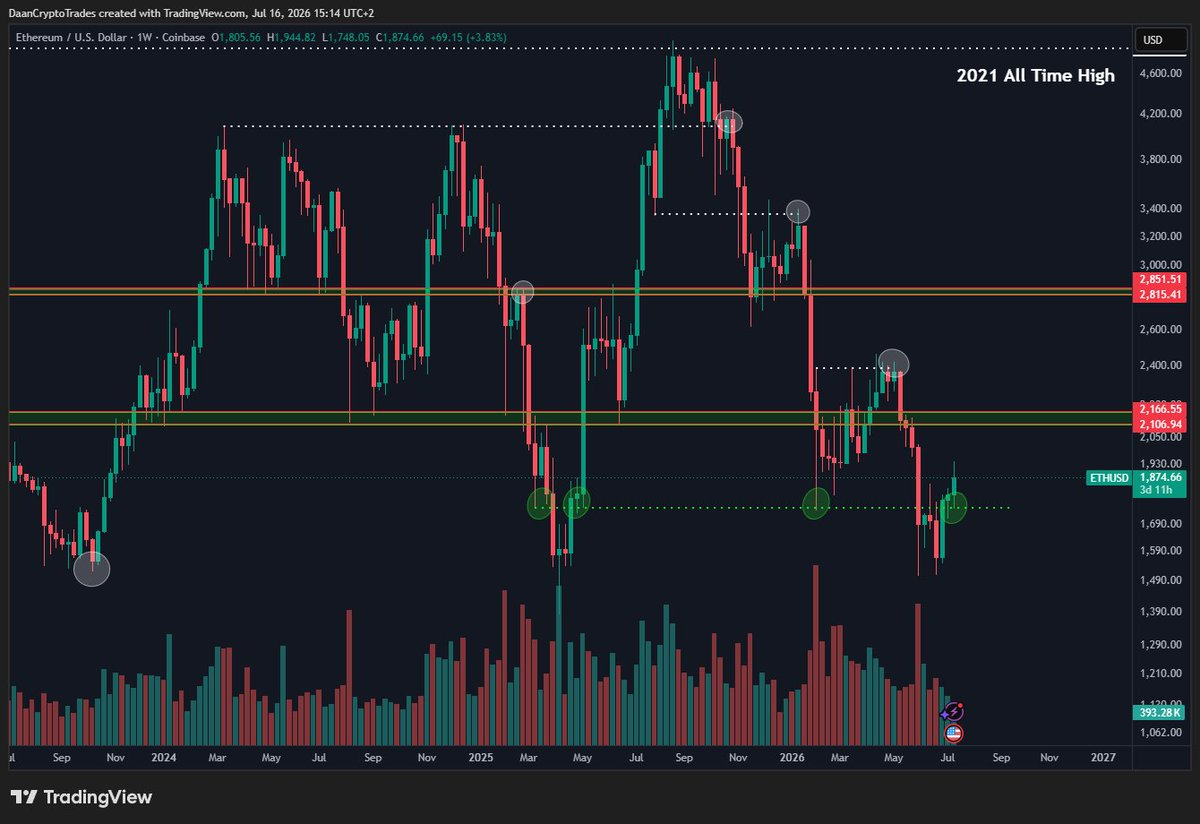
$ETH/USD one-week price chart. Source: Daan Crypto Trades on X.
Daan noted that a successful retention above that level could enable a move towards the long-standing $2,100 resistance zone, while a fall below $1,750 would negate the bullish thesis.
Conversely, a more circumspect perspective emerged from Mister Crypto, who emphasized that Ethereum continues to adhere to a long-term declining trendline that has repelled the price four times since its 2025 peak.
The analyst asserted that $ETH has yet to decisively break that resistance, indicating that the recent rallies still represent lower highs within the overall bearish framework.
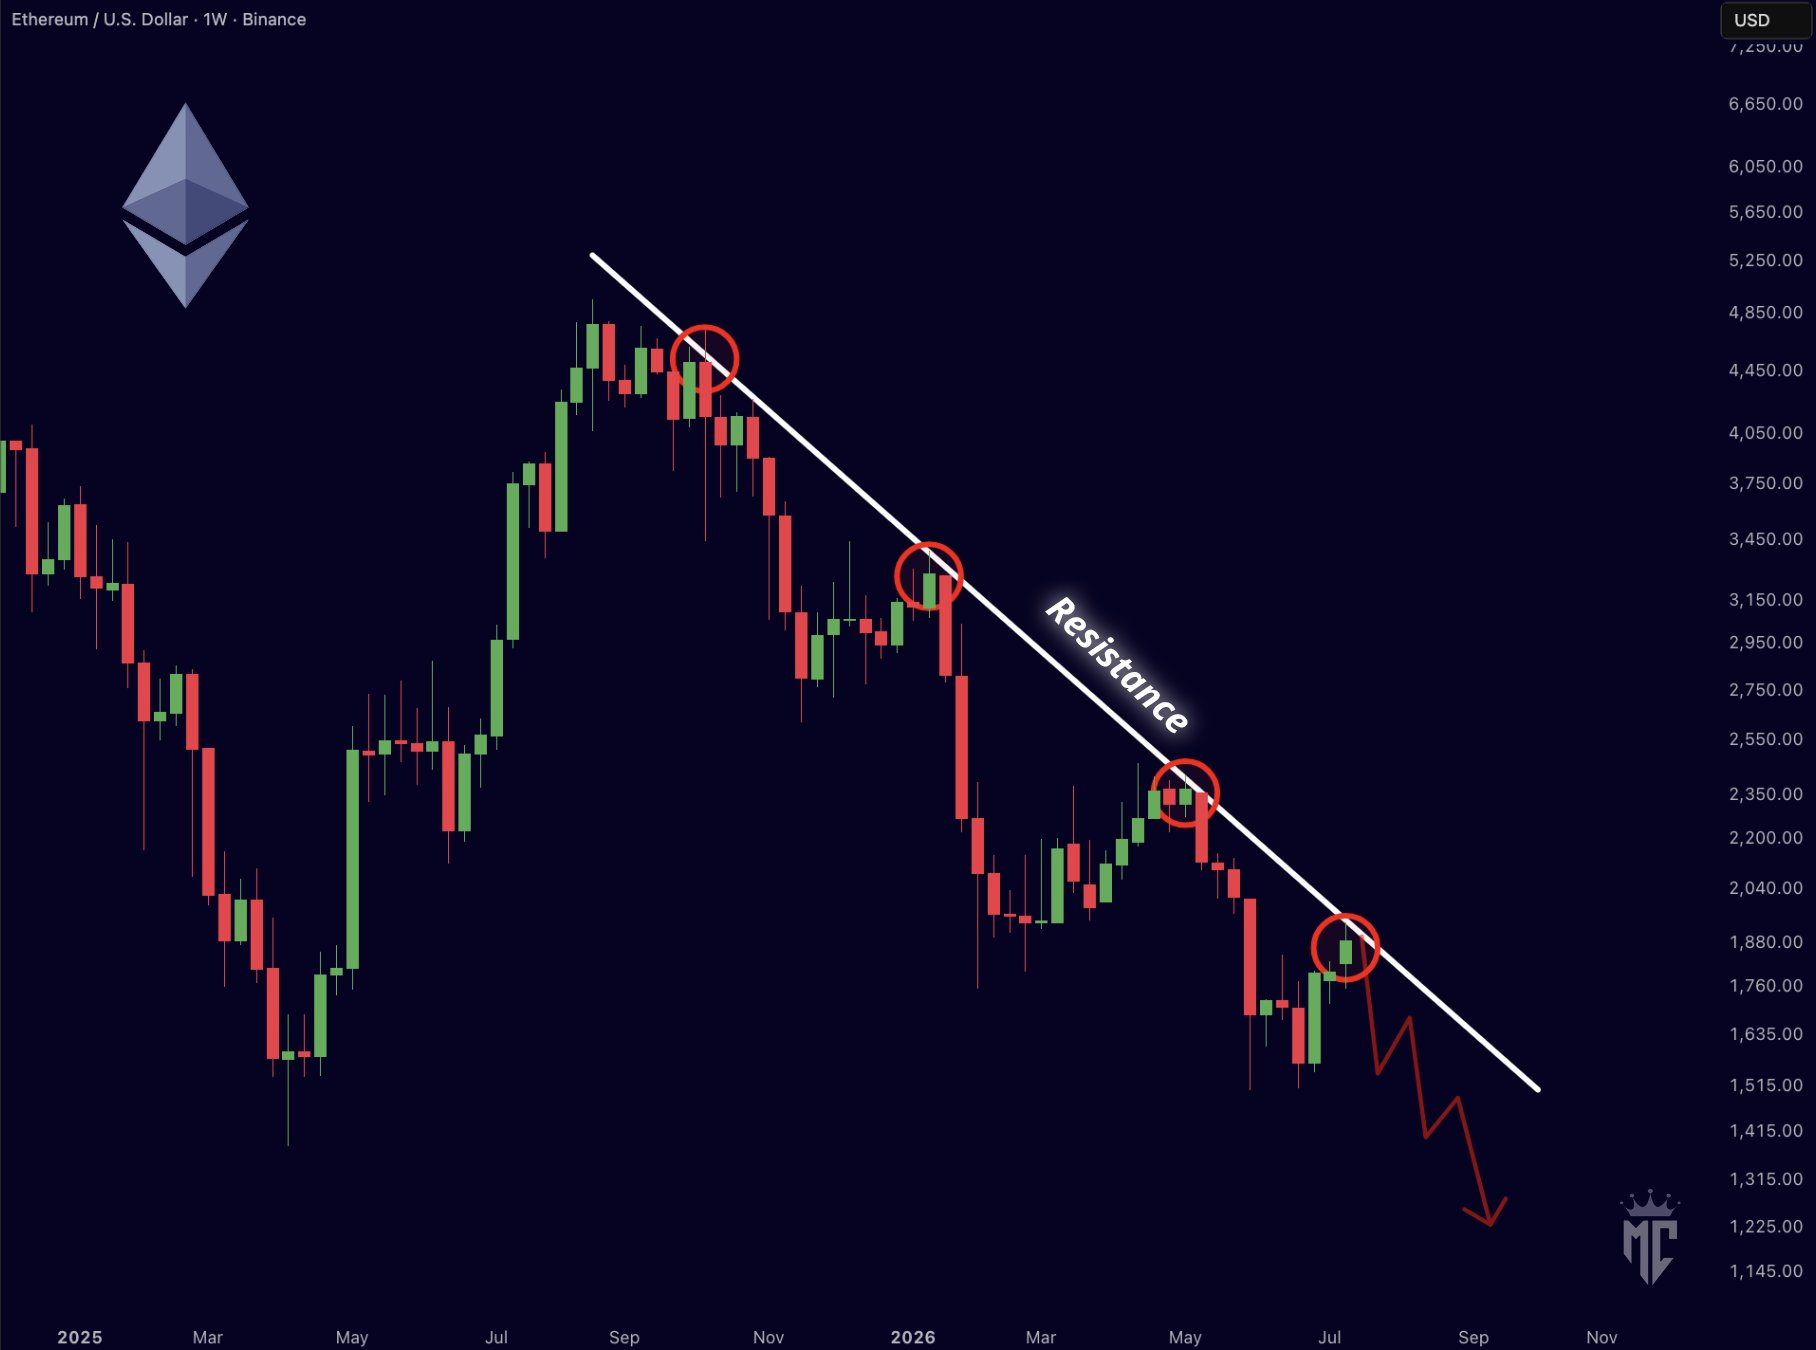
$ETH/USD one-week price chart. Source: Mister Crypto on X.
A sustained breach above the trendline is essential for improving the long-term outlook, the analyst concluded, noting that ongoing rejections could expose the token to a deeper decline toward $1,200.