
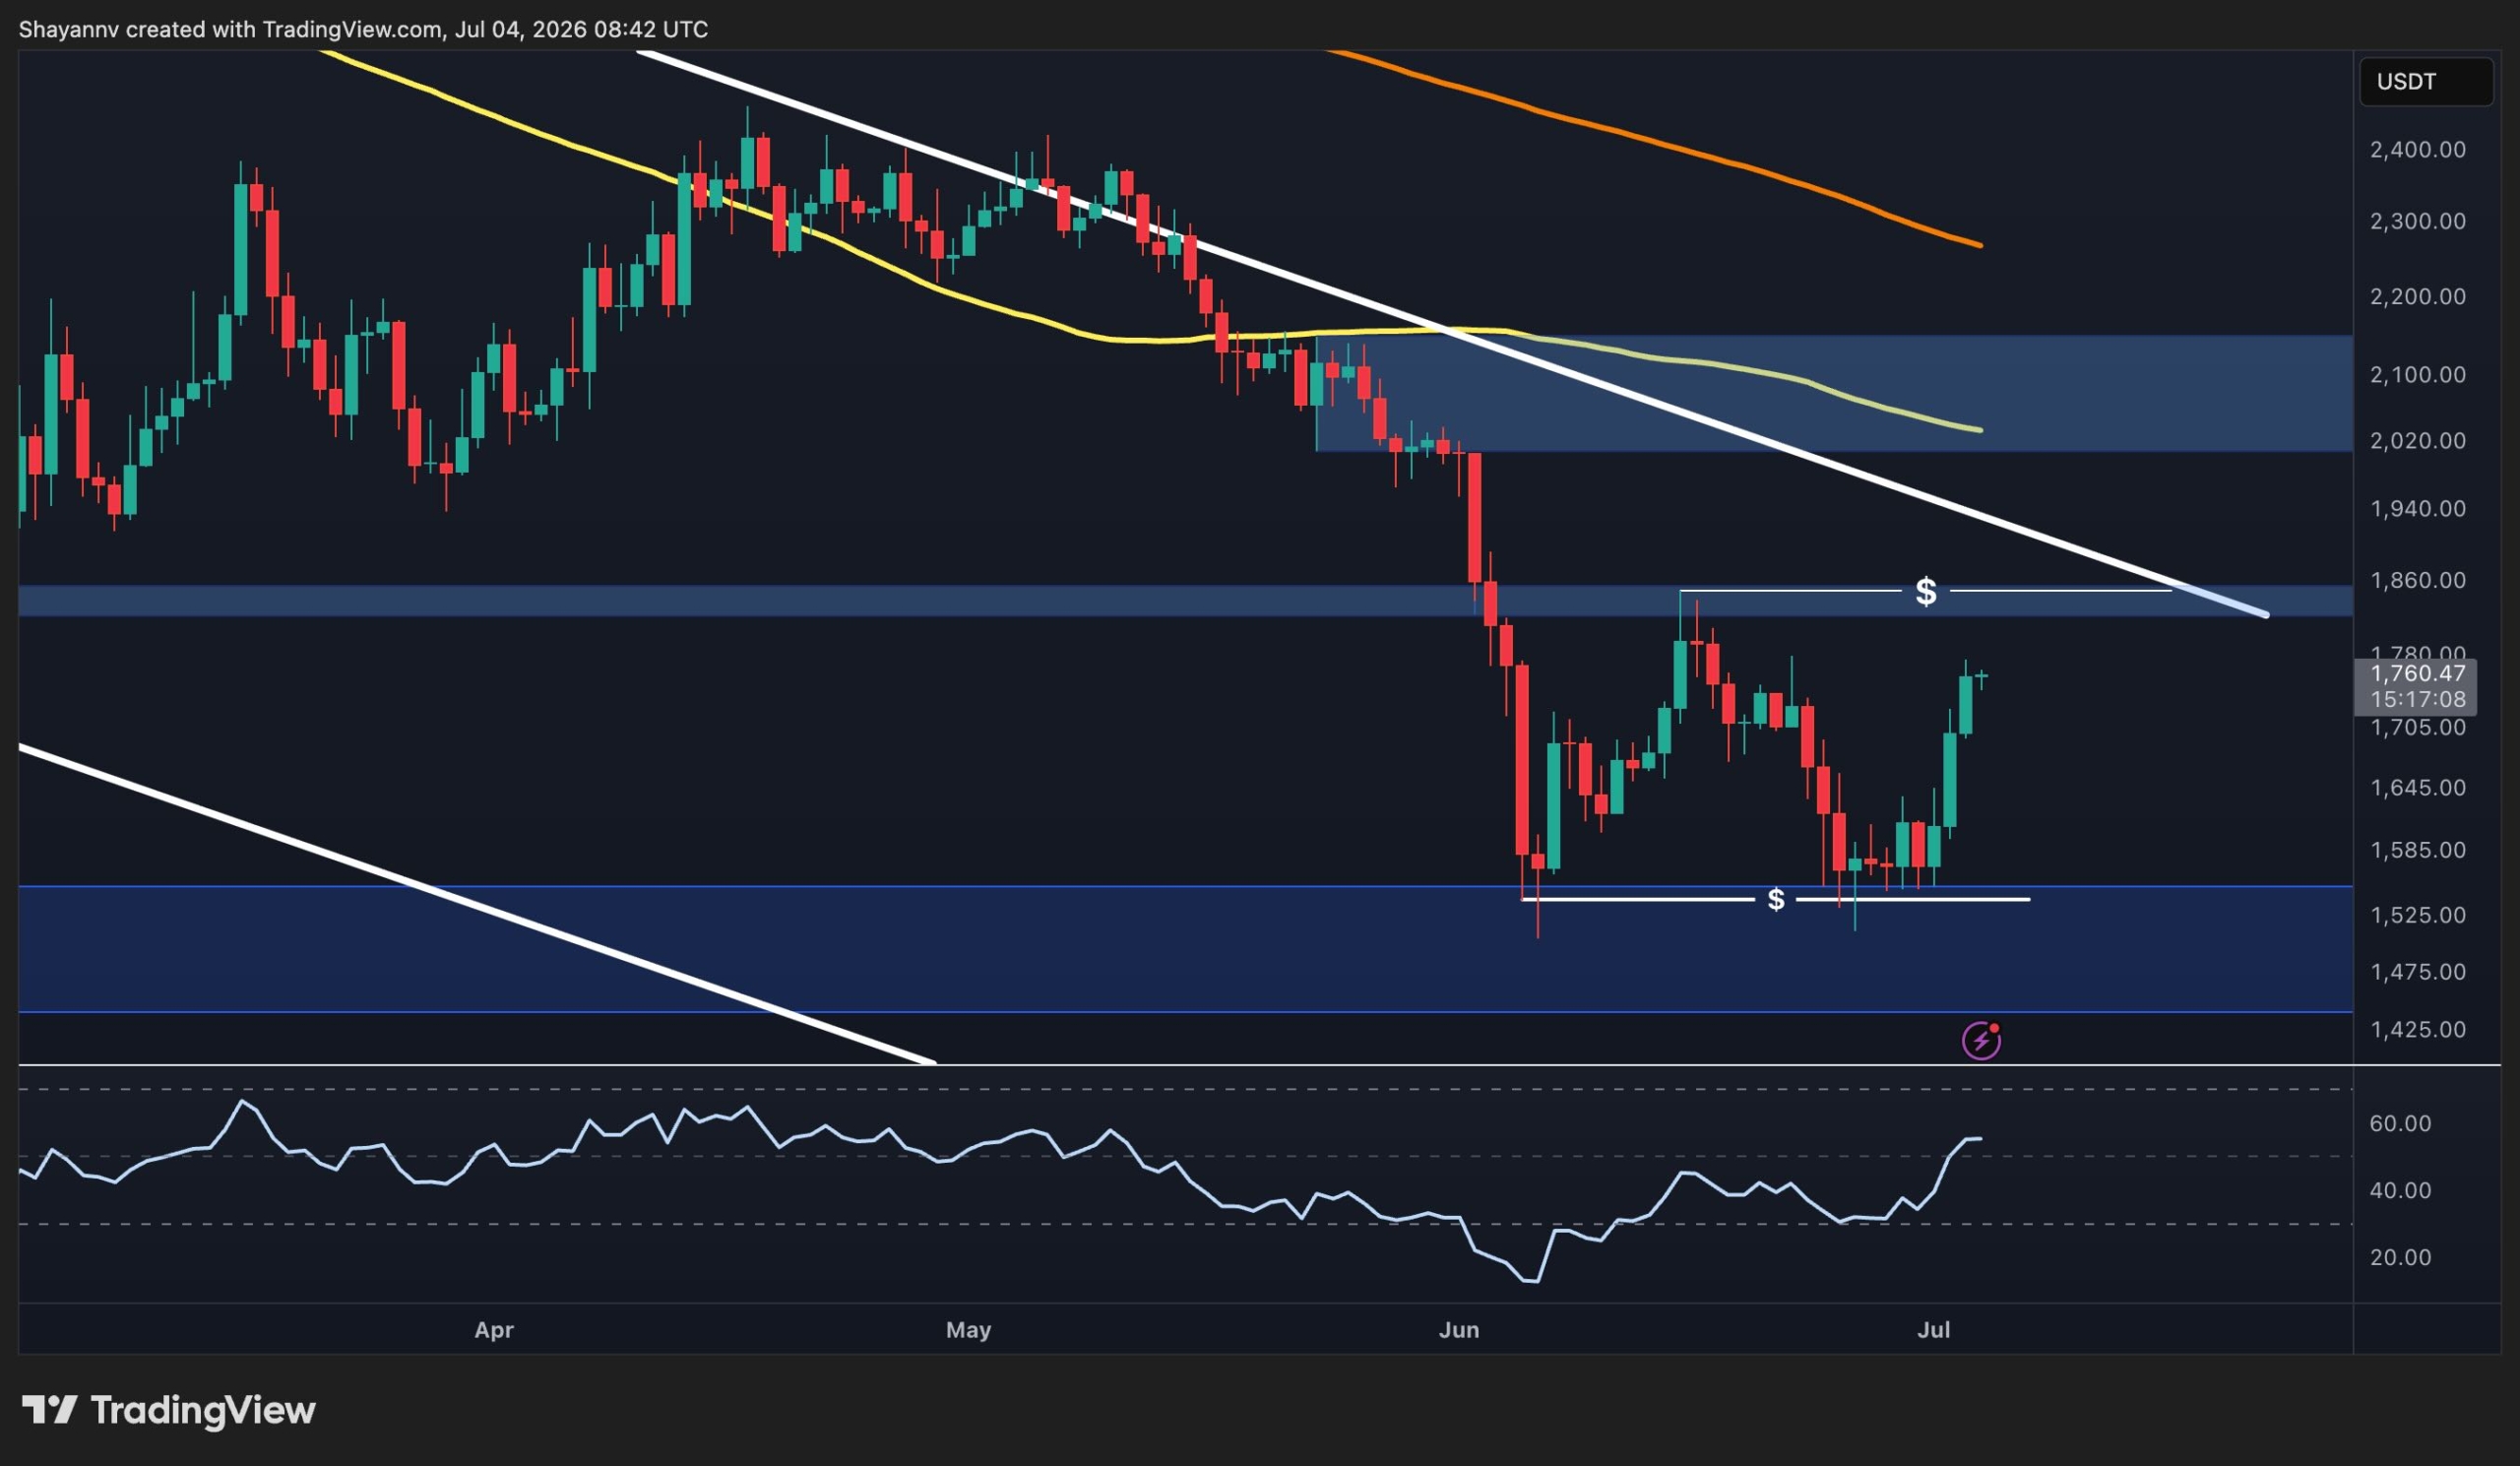
Ethereum has shown signs of recovery in recent sessions, breaking through its previous consolidation range and nearing a crucial resistance area. While this upward movement has positively influenced short-term market sentiment, the cryptocurrency is now testing a critical zone that may determine whether this trend evolves into a significant reversal or merely serves as a temporary relief rally within the ongoing bearish trend.
Ethereum Price Overview: Daily Chart Insights
Ethereum is staging a comeback from the $1.46K-$1.53K demand zone, where buyers once again intervened after sustaining the lows experienced in June. This rebound has propelled the price toward the descending trendline, which has historically capped major rallies since the peak in May.
Moreover, the recent upswing has allowed Ethereum to reclaim the $1.70K level, positioning it just beneath the next essential resistance zone, ranging from $1.82K to $1.86K. This area is particularly noteworthy because it coincides with a long-term descending trendline, creating a considerable technical confluence.
Positive momentum has substantially increased. The previously mentioned bullish RSI divergence continues to manifest, with the indicator reaching higher highs as the price sharply rebounds from support. This development indicates that bearish momentum has significantly waned compared to earlier sell-offs.
However, Ethereum’s overall trend cannot be regarded as bullish until it successfully breaks above the descending trendline and secures the higher resistance band. A failure to do so would maintain the sequence of lower highs that has characterized the market in recent months.
ETH/USDT 4-Hour Chart Analysis
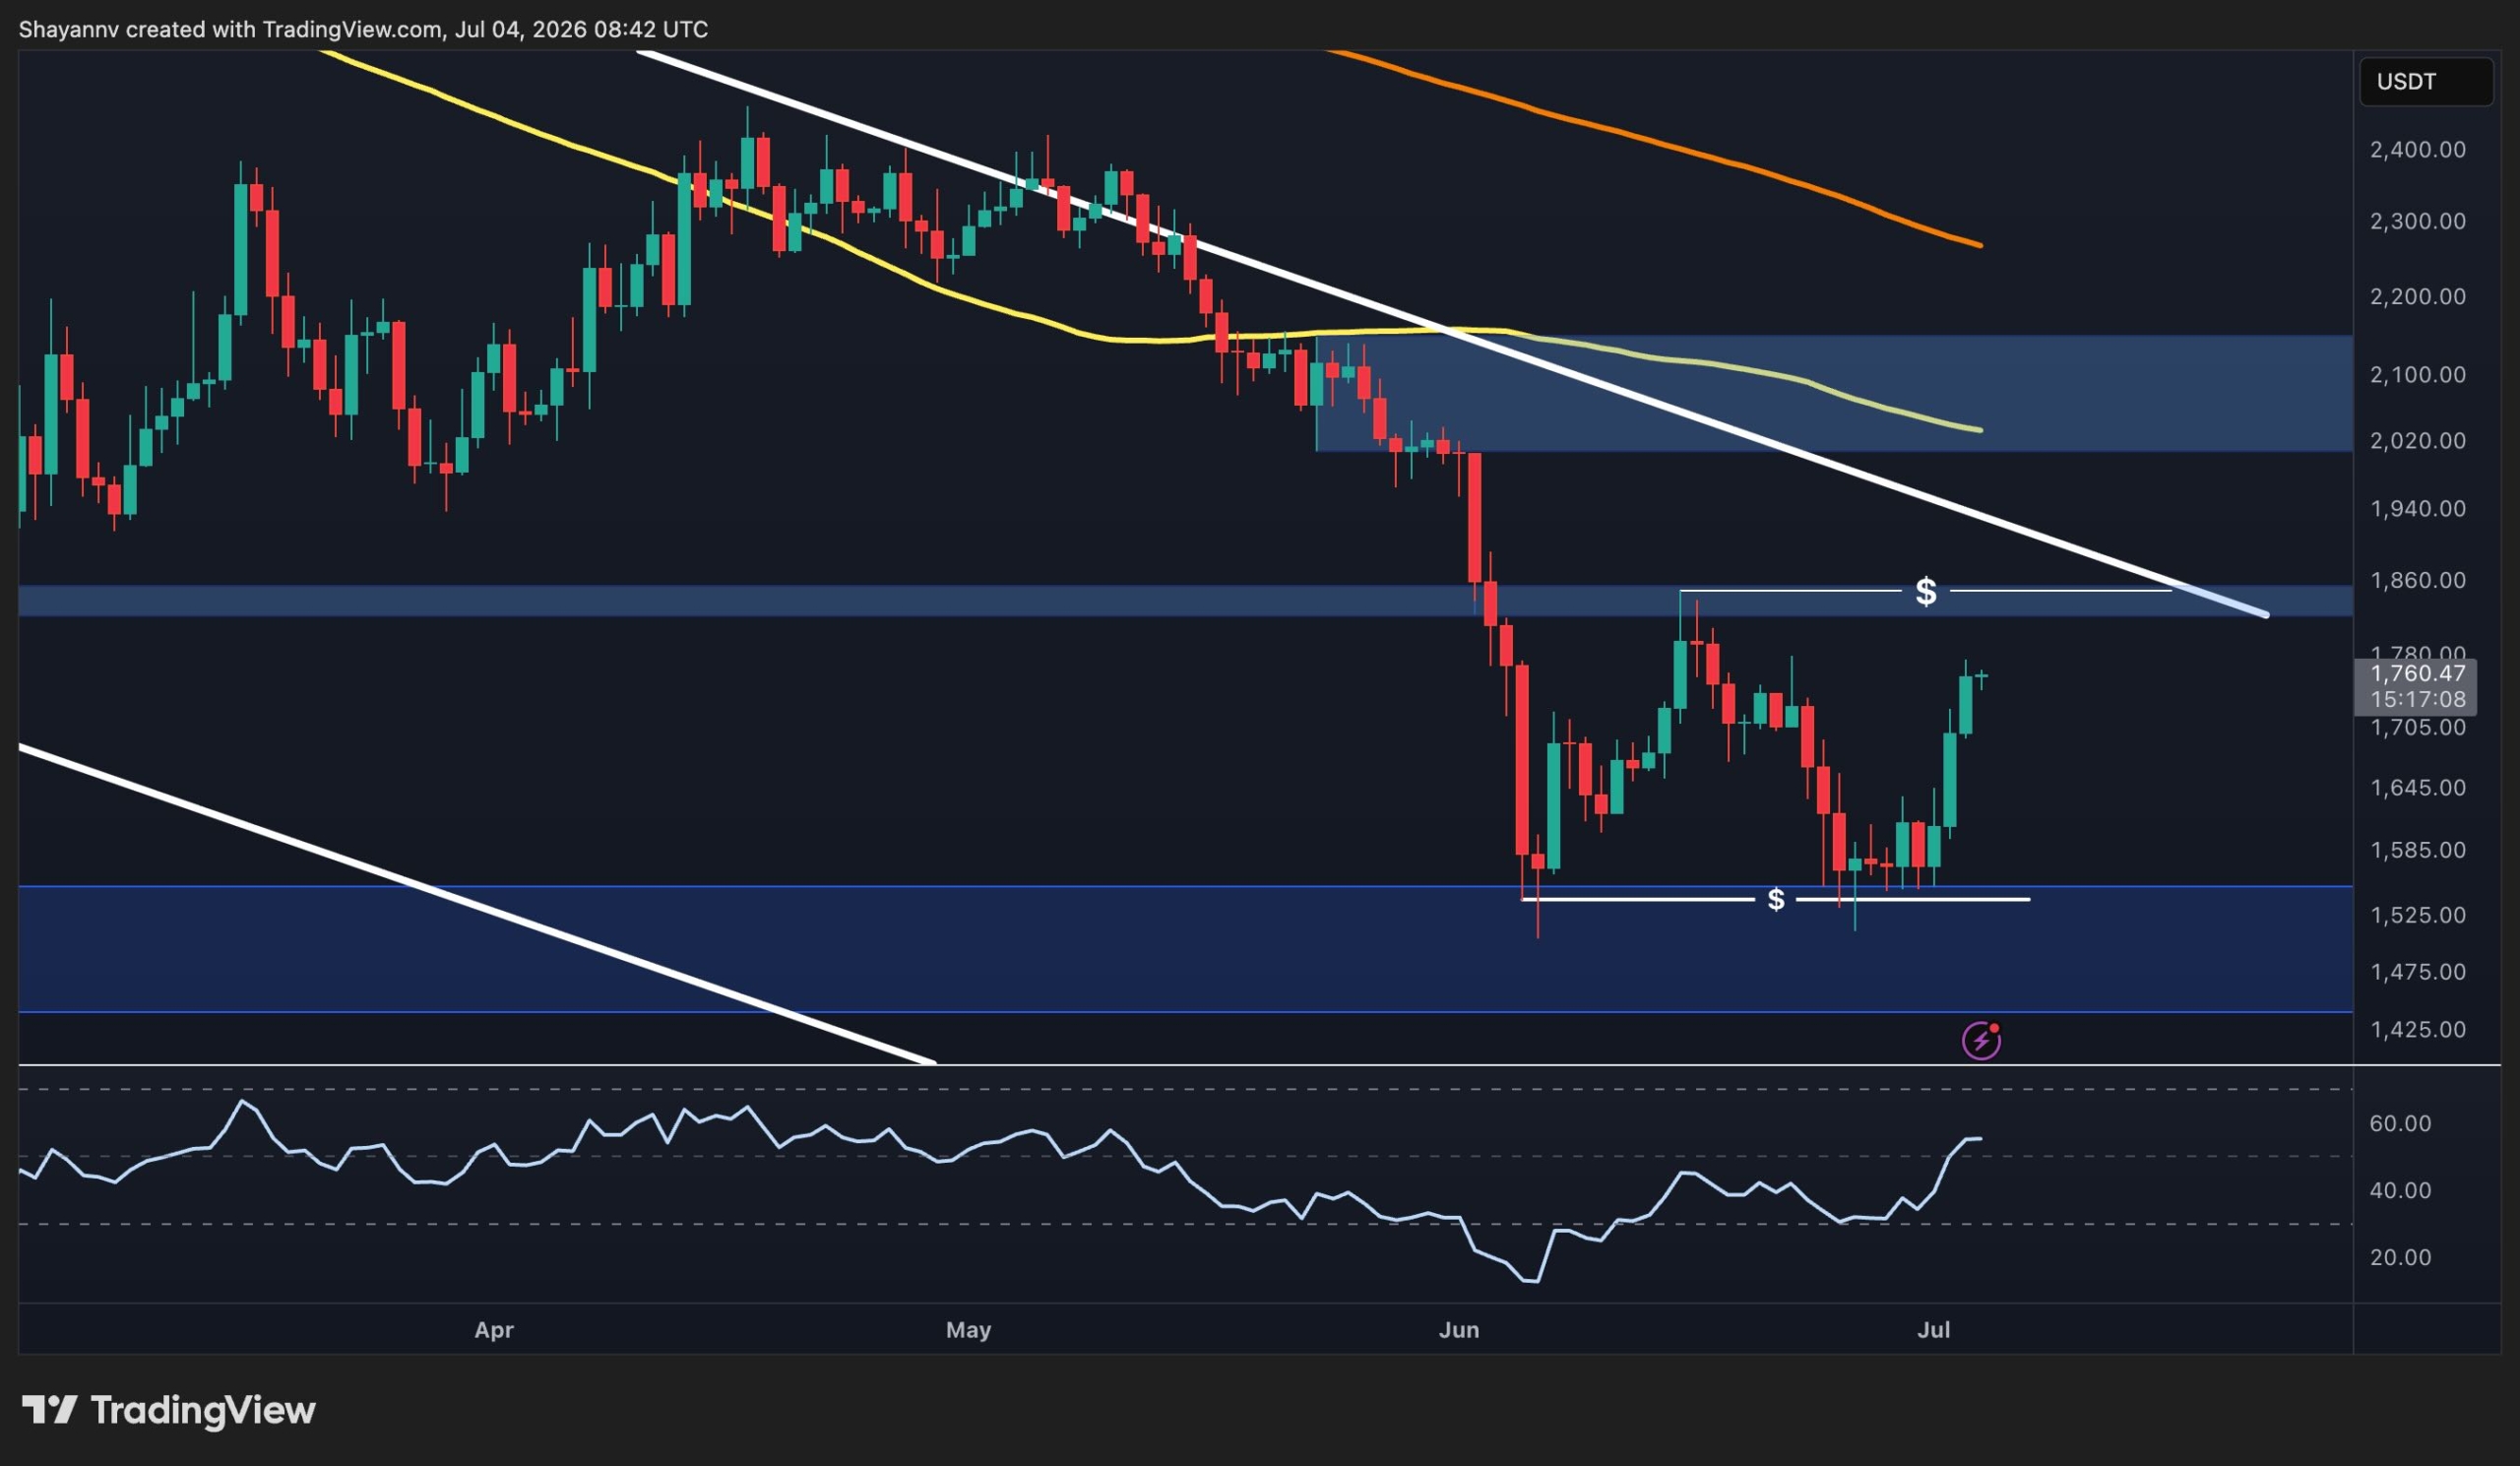
The 4-hour chart provides insights that Ethereum has successfully moved above its short-term consolidation and reached the first resistance zone between $1.70K and $1.74K. Buyers have sustained momentum after breaking through the lower range, leading the price closer to the upper limit of the declining structure.
Currently, the price trades just below the downward trendline that has persistently obstructed previous recovery efforts. A decisive breakout above this trendline would signify the first notable structural improvement since the broader downward movement began, potentially paving the way toward the resistance zone of $1.82K-$1.86K.
As long as Ethereum remains above the recently reclaimed $1.70K level, buyers are in short-term command. However, if the cryptocurrency fails to surpass the descending trendline, it may face another rejection, causing the price to revert to lower support levels and prolong the correction.

Market Sentiment Analysis
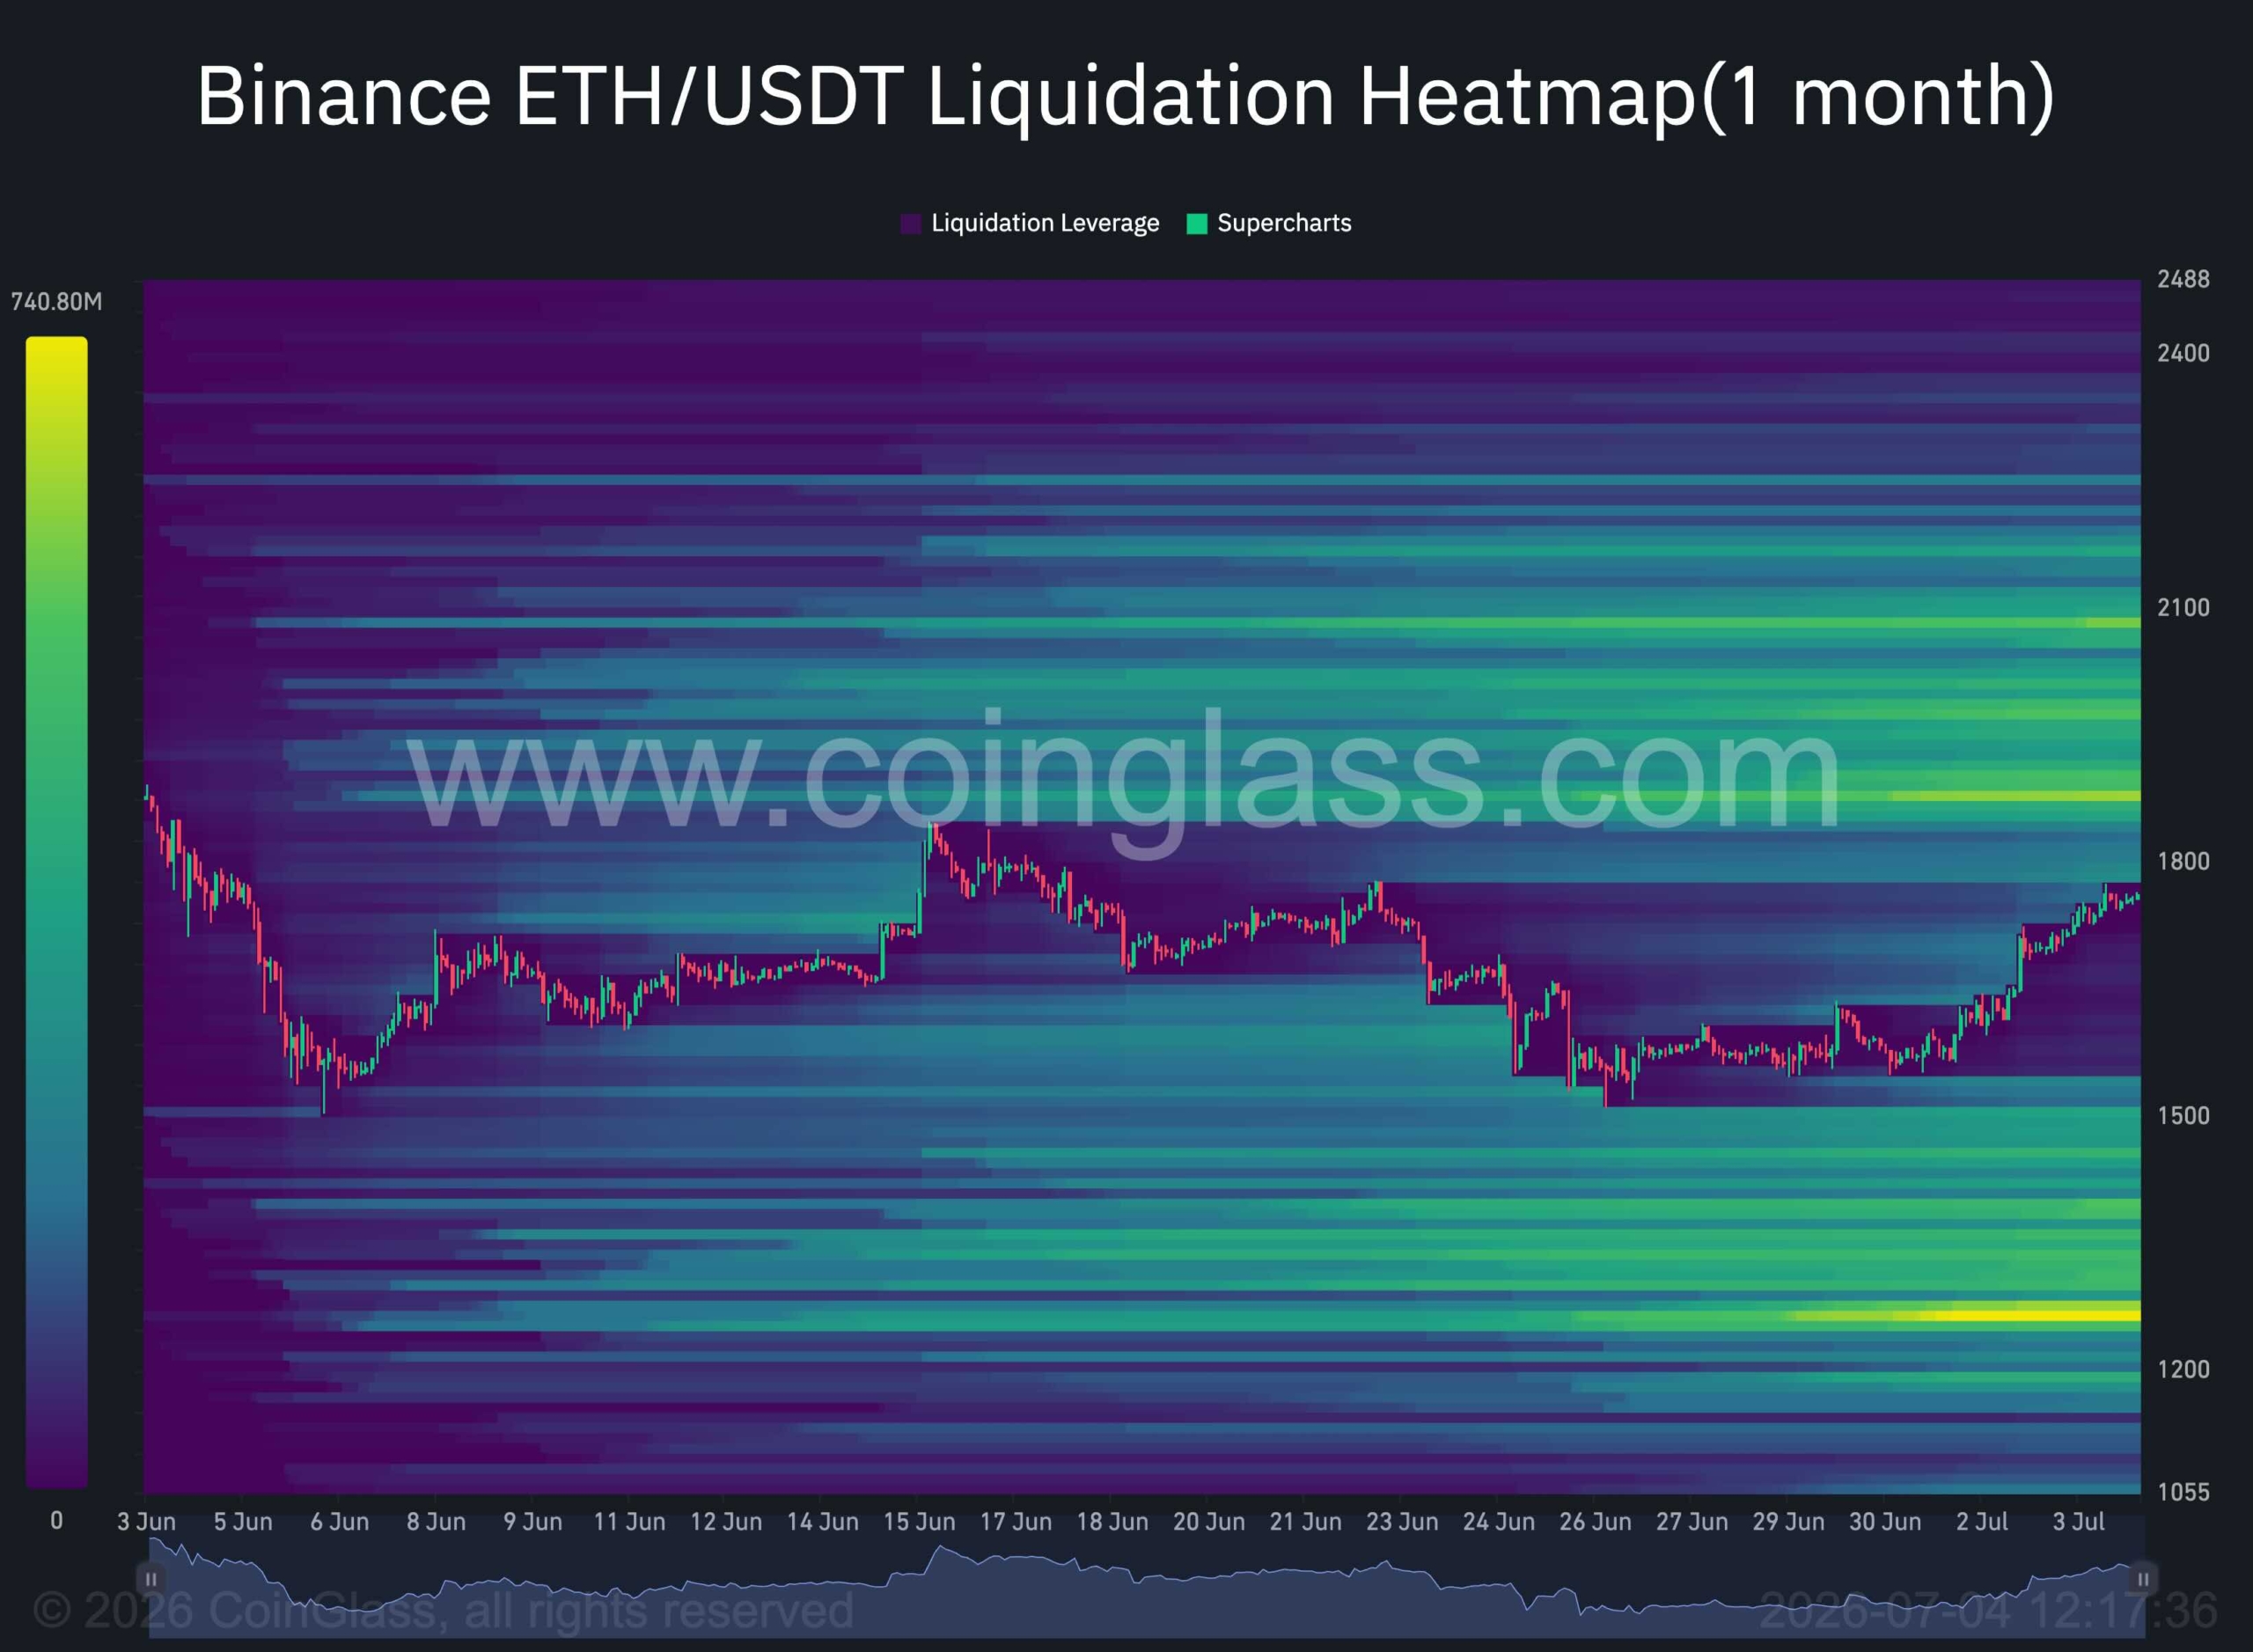
A one-month liquidation heatmap shows a significant accumulation of leveraged positions above the current price level, especially in the $2K-$2.2K vicinity.
These liquidity clusters may attract the price in the forthcoming sessions. If Ethereum surmounts the descending trendline and continues its ascent, the market could accelerate toward this range, driven by short liquidations that fuel further upward momentum.
However, the market’s reaction following such a liquidity sweep may be even more crucial than the upward movement itself. Once the overhead liquidity in the $2K-$2.2K range is exhausted, the market will likely reveal whether buyers have gathered sufficient strength to create a lasting bullish trend or whether the surge was merely a liquidity-driven spike.
If bullish momentum stays robust after clearing the overhead liquidity, Ethereum could enter a broader recovery phase. Conversely, failing to retain above that region would raise the likelihood of another downturn, potentially drawing the price down to target the substantial liquidity pools that remain below the current market. This sequence aligns with the market’s tendency to navigate between significant liquidity reservoirs before establishing its next directional trend.
Disclaimer: The insights presented on CryptoPotato reflect the views of the authors cited. They do not represent the opinions of CryptoPotato regarding the purchase, sale, or retention of any investments. It is recommended that you conduct your own research before making investment choices. Use the provided information at your own risk. Refer to the Disclaimer for more details.