

Ethereum’s value has dipped below the crucial $2,000 support level, influenced by institutional outflows, rising geopolitical tensions, and a negative technical outlook that is affecting overall market sentiment.
Summary
- Ethereum’s value has dropped beneath the significant $2,000 support, driven by ETF withdrawals, decreasing U.S. demand, and a generally risk-averse market atmosphere.
- A breach below a descending parallel channel has exposed targets in the $1,900 and $1,825 range, with major support near the lows from February.
- Data from CoinGlass indicates high liquidation areas between $2,100 and $2,150, while experts caution that losing the $1,900 to $1,950 zone may prompt further declines.
Recent data from crypto.news reveals that Ethereum (ETH) was trading around $1,990, having dipped below the key psychological threshold of $2,000 for the first time in months. This drop came amidst ongoing selling pressure in U.S. markets, as traders grow more defensive due to declining risk appetite in both cryptocurrency and traditional assets.
A notable decline in U.S. spot demand appears to be a key factor behind this downturn. Market observers have highlighted a significantly negative Coinbase premium, which compares ETH prices on Coinbase against those on offshore exchanges.
The shift to negative pricing indicates that selling activity within the U.S. has surpassed global purchasing interest, diminishing a crucial support zone around $2,000.
Meanwhile, capital continues to exit Ethereum investment vehicles. According to SoSoValue, spot Ethereum exchange-traded funds have recorded $241 million in net outflows over the past week, bringing monthly redemptions to around $540 million.
Beyond the cryptocurrency realm, rising geopolitical tensions are adding further stress. Traders are closely monitoring events involving the United States and Iran, while soaring crude oil prices have reignited inflation fears.
Increasing energy prices pose a challenge to the Federal Reserve’s policy considerations and dampen expectations for imminent interest rate reductions, a scenario that historically impacts risk assets negatively.
Digital asset funds are feeling the repercussions, with recent data indicating approximately $2.8 billion exiting crypto investment products in the last week, mirroring the caution many investors have adopted in the face of macroeconomic uncertainty.
Ethereum’s Technical Breakdown Below Long-Standing Support
The latest downturn in Ethereum has also confirmed a significant technical failure on extended timeframes.
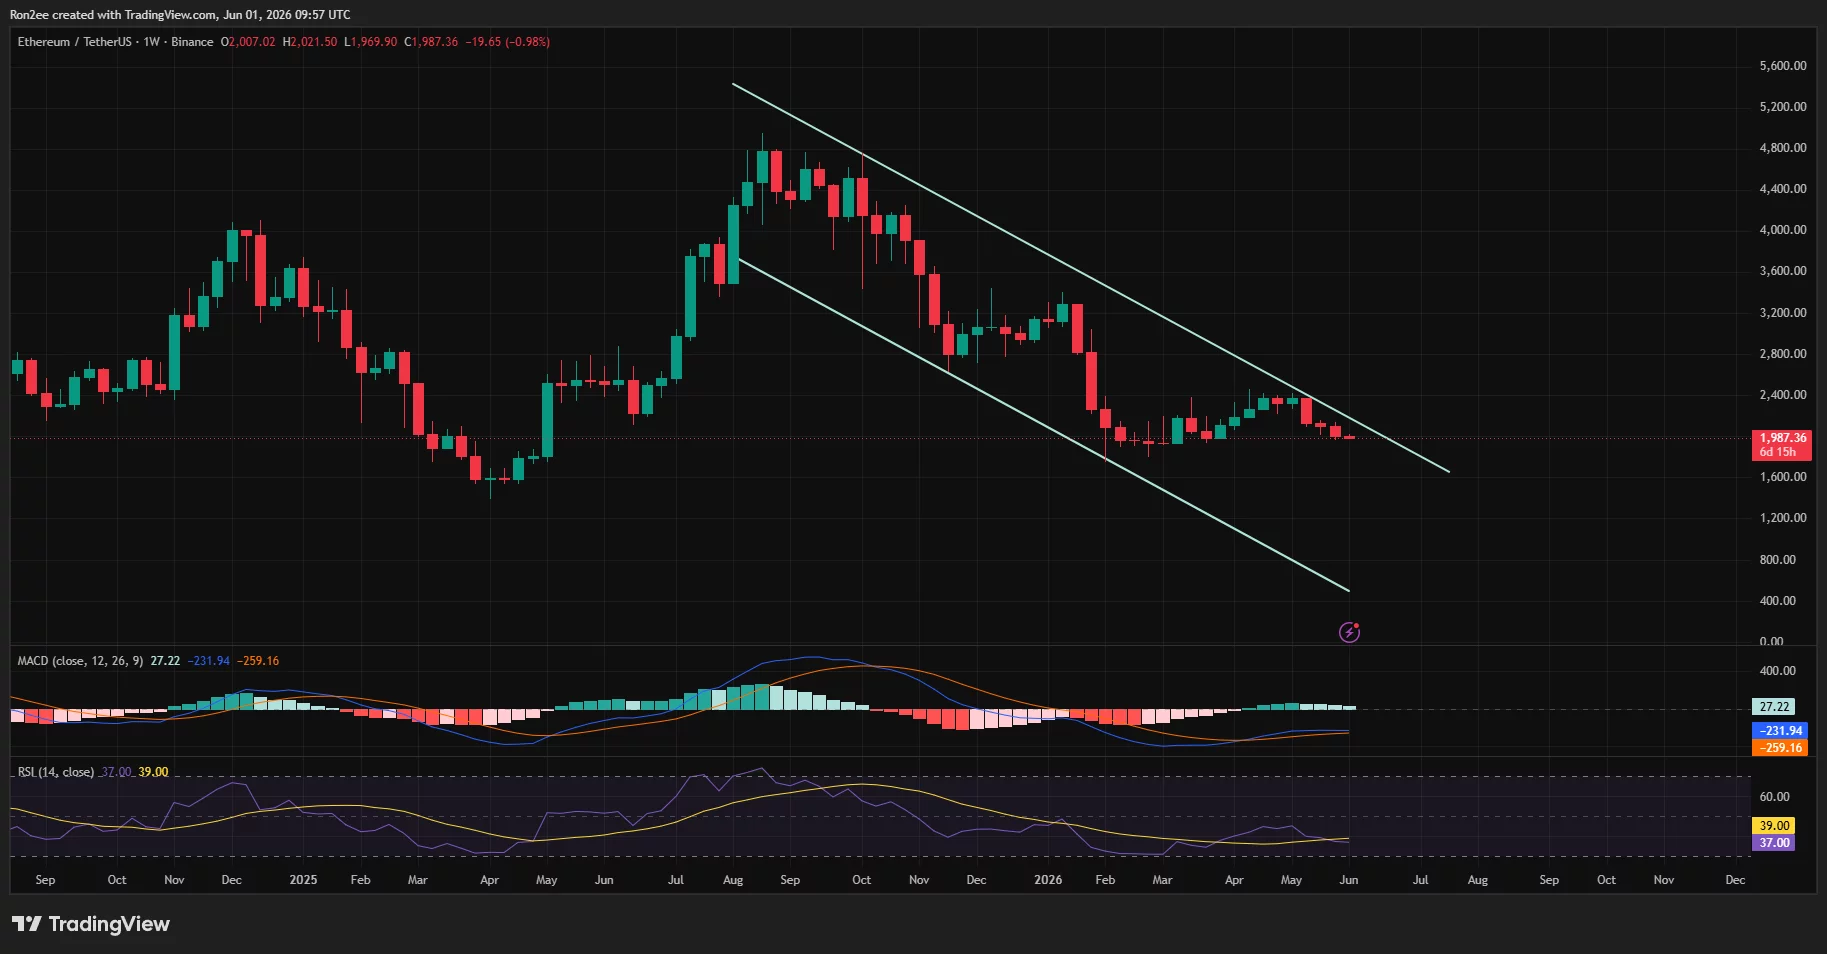
The daily chart illustrates Ethereum falling below the lower boundary of a descending parallel channel that has governed price movements since January. Sellers have successfully driven ETH beneath both channel support and the 0.786 Fibonacci retracement level close to $2,100, forcing the token below the critical $2,000 mark.
This breakdown leaves February’s low around $1,825 as the next significant target to the downside, with the previous channel support near $2,100 now serving as immediate resistance.
Various trend indicators are still pointing toward seller dominance. Ethereum is trading below its Supertrend resistance at about $2,195 and remains below the 20-day, 50-day, and 200-day moving averages. These levels now provide multiple layers of overhead resistance, ranging from approximately $2,100 to $2,400.
Momentum indicators have yet to indicate a substantial rebound. The weekly Relative Strength Index resides around 37, keeping ETH in a weak position, although not oversold. Meanwhile, the weekly MACD stays below its signal line, failing to create a bullish crossover during May’s attempted recovery.
Longer-term charts also reveal a bearish narrative. Ethereum is still navigating within a descending channel that has characterized price action since mid-2025. The upper channel boundary lies near $2,300, while the lower boundary intersects in the $1,750 to $1,800 range.
In an analysis of the current situation, crypto expert Ali Martinez noted that Ethereum is approaching a critical support area.
“Ethereum is nearing the bottom of its channel near $1,825. This region could provide a favorable risk-reward opportunity targeting $2,073 and $2,360, provided the price remains above $1,750 on a daily closing basis.”
Another analyst, Ted Pillows, identified the $1,900-$1,950 area as the next key support region after the decline below $2,000. According to Pillows, failing to maintain that level could lead to fresh lows in the cycle.
Positioning in derivatives indicates that traders are bracing for increased volatility around these levels.
Liquidation heatmaps from CoinGlass reveal a significant liquidity cluster situated between $2,100 and $2,150. A considerable amount of leveraged short positions appear to be concentrated in this range, potentially acting as a magnet should Ethereum manage to reclaim lost support. Below current prices, noteworthy liquidation points are observed around $1,950, extending down to $1,900.
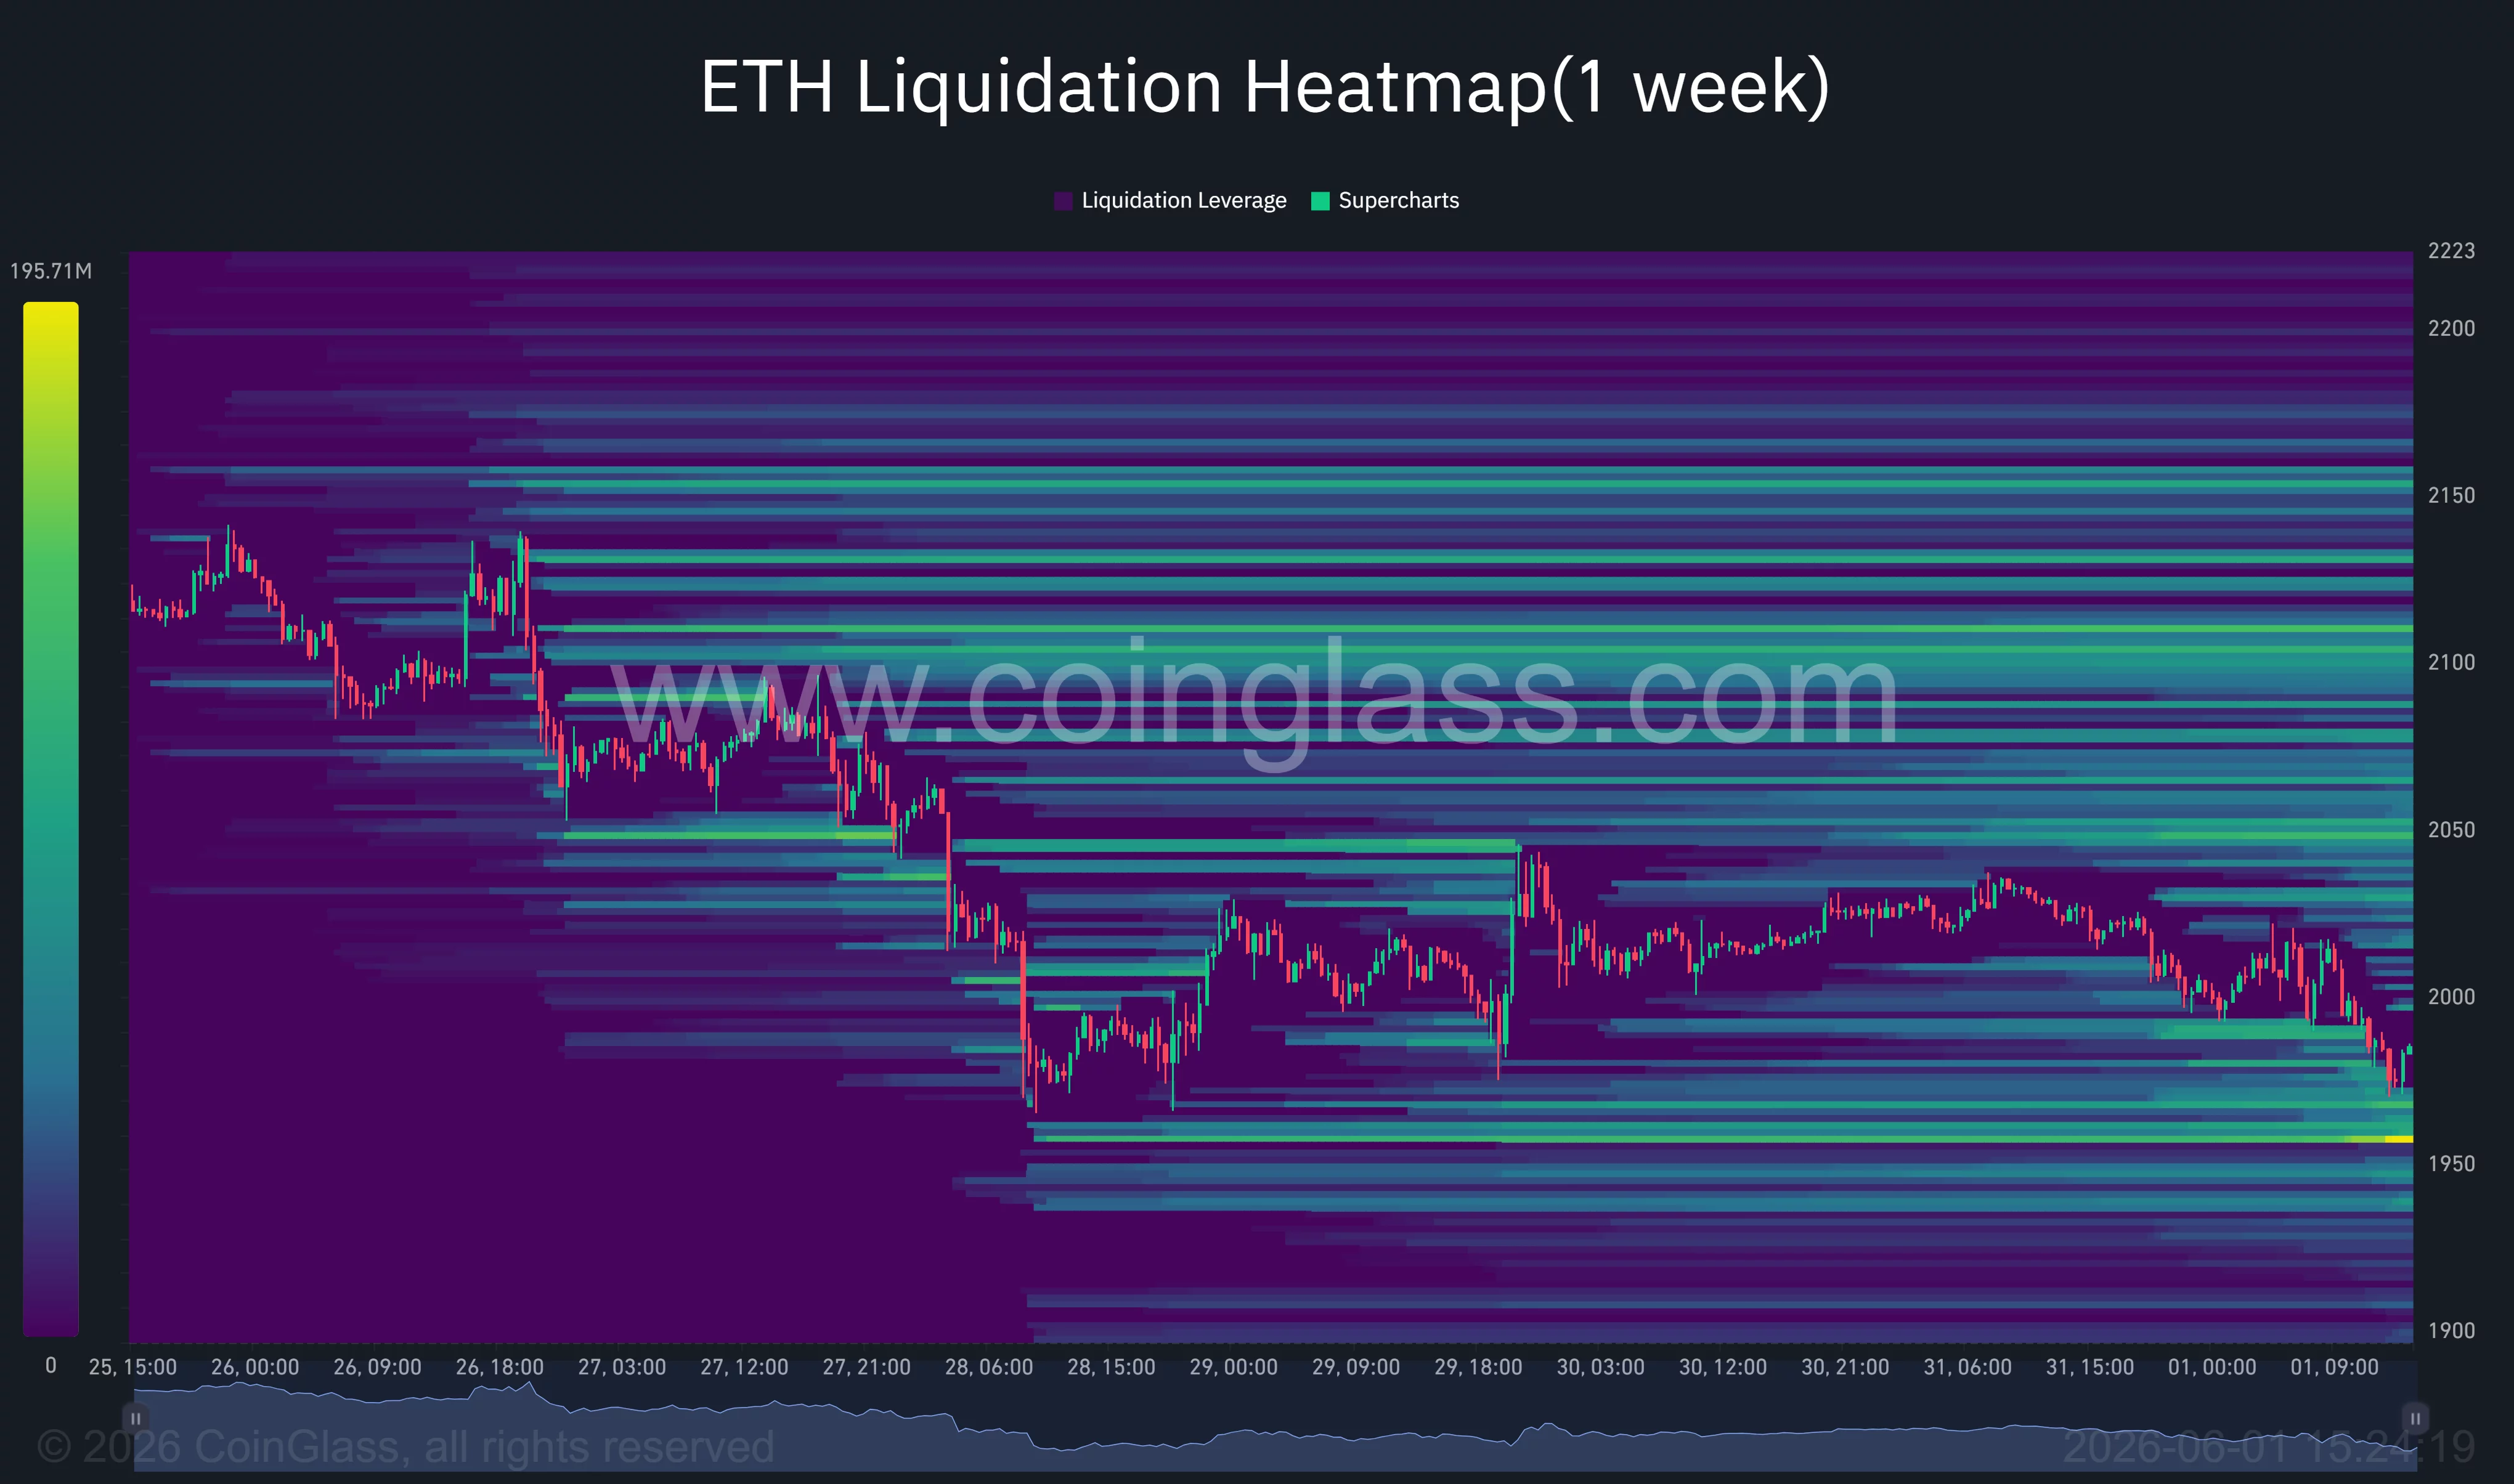
This accumulation of leverage beneath the spot price heightens the risk of another liquidation surge if the support levels do not hold. Such occurrences typically accelerate downward trends, adding further sell orders to the market due to forced long liquidations.
ETF Withdrawals and Macro Challenges Pressure Ethereum
Institutional interest has notably dwindled during this latest downturn.
Spot Ethereum ETFs have now experienced over half a billion dollars in losses in the past month, marking a stark contrast to the significant inflows seen earlier this year. Ongoing redemptions have coincided with Bitcoin’s rising relative performance, as investors show a preference for the largest cryptocurrency during market instability.
There has also been a noticeable shift of capital toward artificial intelligence-related tech stocks, drawing attention from market participants. Several analysts note that growth-focused investors are increasingly gravitating towards major tech companies instead of digital assets, which has diminished speculative demand in the crypto markets.
Concerning inflation metrics driven by higher energy costs might compel policymakers to uphold stringent monetary policies for longer. Such a scenario could well keep pressure on liquidity-sensitive assets, including Ethereum.
A sustained rebound above the $2,100 mark would undermine the immediate bearish outlook and bring the $2,150 liquidation cluster back into consideration. Surpassing this threshold could prompt short covering and reveal resistance levels near $2,360 and $2,400.
In the meantime, sellers continue to dominate the trend. Unless buyers swiftly reclaim the $2,000-$2,100 range, technical targets in the vicinity of $1,900, $1,825, and possibly near the lower channel boundary around $1,800 are likely to remain in focus.
Disclosure: This article is not intended as investment advice. The content and materials within this page are purely for educational purposes.