

The value of Bitcoin is experiencing pressure, hovering around $78,500 after retreating from its September 3 peak of $82,283. Deteriorating momentum and the emergence of a potential head-and-shoulders pattern heighten the chances of a more significant correction.
Bitcoin Price Movement Today
As reported by crypto.news, Bitcoin (BTC) was trading close to $78,500 on the evening of September 9, fluctuating between approximately $78,060 and $79,760 during the day’s trading. This marks a decline of roughly 4.6% since it touched $82,283 on September 3.
The recent downturn has extended the pattern of lower highs observable on the 4-hour chart. Buyers attempted to protect the $78,000 mark several times, but each bounce struggled to reclaim the critical psychological barrier of $80,000.
Additionally, Bitcoin’s positioning within the 4-hour Bollinger Bands indicates a waning short-term strength. Trading at approximately $78,522, it sits below the midpoint band at $79,079 and just above the lower band at $78,015.
Movement towards the lower Bollinger Band could suggest increasing selling pressure, while the nearby support might also lead to a brief recovery. Bitcoin must reclaim the midpoint band to mitigate the immediate bearish sentiment.
The upper Bollinger Band is positioned around $80,144, making the $80,000–$80,150 range the first significant resistance level to watch. A close above this area would allow buyers a chance to test the recent peaks near $81,500 and $82,300.
Oil and Treasury Yields Impact Risk Assets
The decline in Bitcoin’s value comes as rising tensions in the Middle East have driven Brent crude oil prices close to $100 per barrel, adding to worries that elevated energy prices may keep inflation high. On September 9, Brent reached $99.22, while West Texas Intermediate climbed to $94.13.
For U.S. crypto investors, these inflation concerns are crucial because they can influence expectations for Federal Reserve interest rates. Higher rates and bond yields provide improved returns on lower-risk assets, which creates competition for Bitcoin and similar assets that don’t yield interest.
The U.S. Treasury market also contributed to the downward pressure. The benchmark 10-year yield exceeded 4.85% following the Treasury’s announcement of a $6 billion buyback operation aimed at older bonds maturing in 10 to 20 years.
Additionally, the yield on 30-year bonds reached its highest level since 2007. Increasing Treasury yields can tighten financial conditions by raising borrowing costs and making riskier assets less appealing to investors.
This Bitcoin pullback coincides with a broader reassessment of inflation and interest rate risks in the lead-up to the Federal Reserve’s policy meeting on September 15–16. Traders will be closely monitoring upcoming inflation data and oil prices for cues about the central bank’s monetary stance.
Bitcoin Technicals Highlight $78K Support
The 4-hour relative strength index registered at 43.58, below the neutral mark of 50 and its signal average of 44.71. This indicates bearish momentum without suggesting that Bitcoin is in oversold territory.
On the daily charts, signals are less negative. Bitcoin remains above the daily Supertrend support at $72,786, indicating that the broader recovery structure is still intact despite the most recent decline.
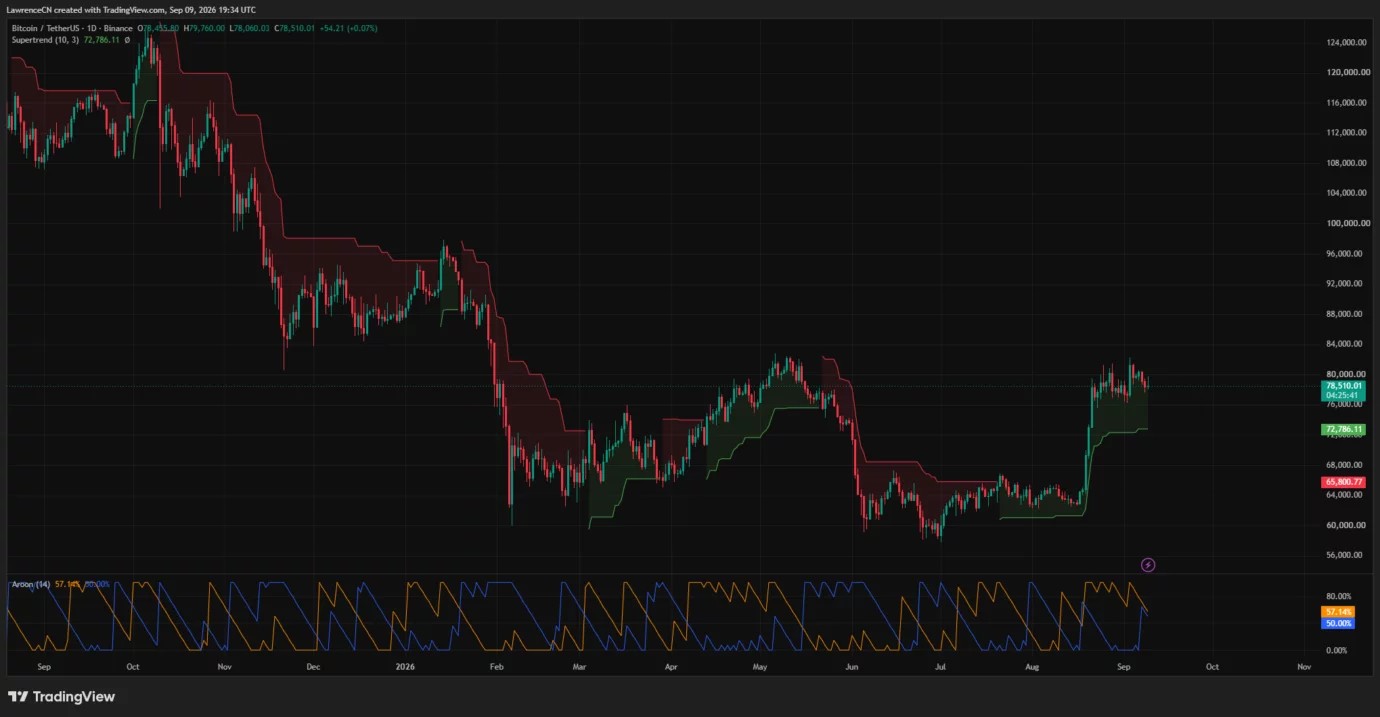
The daily Aroon indicators were closely aligned, with one line at 57.14% and the other at 50%. This slight difference suggests that neither buyers nor sellers hold a dominant position in the higher timeframe.
Crypto analyst Gerla pointed out a potential head-and-shoulders formation, identifying the first shoulder near late-August highs, the head around the September 3 peak, and the right shoulder possibly forming during the latest recovery.
“The $78K–$79K zone is crucial. If that level is lost, $70K could come swiftly,” Gerla noted in a September 9 update on X.
The pattern is unconfirmed as long as Bitcoin maintains its neckline. A decisive daily close below $78,000 would reinforce this setup, exposing $76,000–$77,000 before targeting the significant $70,000 mark.
Liquidation Heatmap Reveals Pressure from Both Sides
CoinGlass’s three-day liquidation heatmap has indicated significant concentrations of leveraged positions just above Bitcoin’s current price. The most substantial nearby liquidity appears between approximately $79,700 and $80,200, with additional clusters extending towards $82,000.
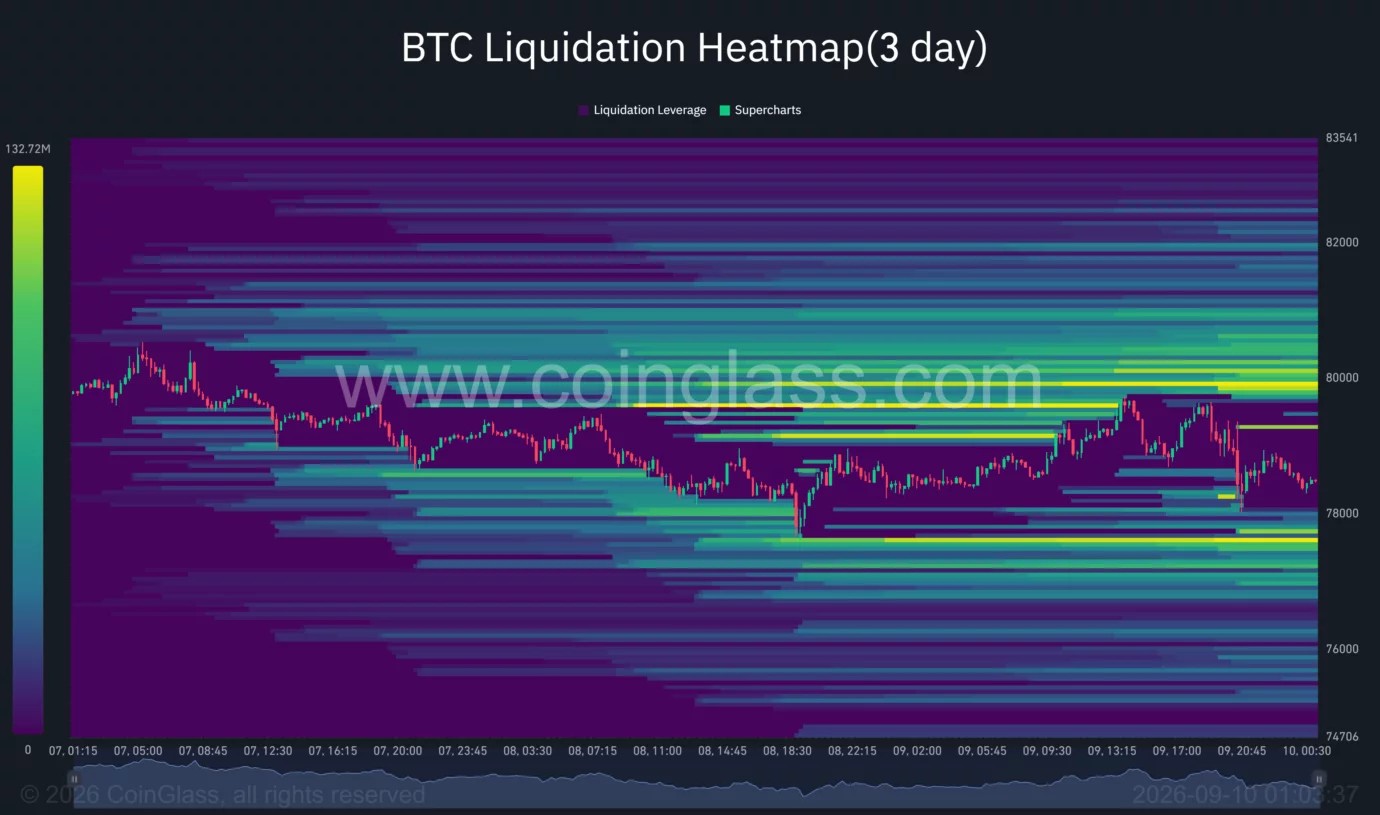
These concentrations can influence pricing during times of high leverage, though they don’t guarantee that Bitcoin will channel towards them. A recovery past $79,100 could trigger liquidations of short positions, facilitating a test of the $80,000 region.
Conversely, downside liquidity is concentrated near $78,000 and in the $77,500 to $77,800 range. Dropping below current support could heighten volatility as leveraged long positions are unwound.
Further liquidity is visible around $76,000, aligning with the next technical support area just beneath the suggested neckline. This heatmap implies that breaking above $80,000 or falling below $78,000 could result in heightened movements as liquidations amplify spot-market pressure.
Essential Bitcoin Levels to Monitor
The immediate trading range for Bitcoin lies between the lower Bollinger Band at approximately $78,015 and the middle band around $79,079. Preserving the $78,000 support level would keep the door open for a potential bump towards $79,700–$80,150.
A sustained break above $80,150 would weaken the short-term bearish trend and bring $81,500 and $82,283 back into focus. Buyers need to clear the September peak to affirm a renewed upward trajectory.
A close beneath $78,000 would signal deeper weakness, redirecting focus to $77,500 and the broader support zone of $76,000–$77,000. The head-and-shoulders pattern interpretation would gain validation below the neckline, while the daily Supertrend near $72,786 remains a crucial barrier that must be overcome before the analyst’s $70,000 scenario can come to fruition.