
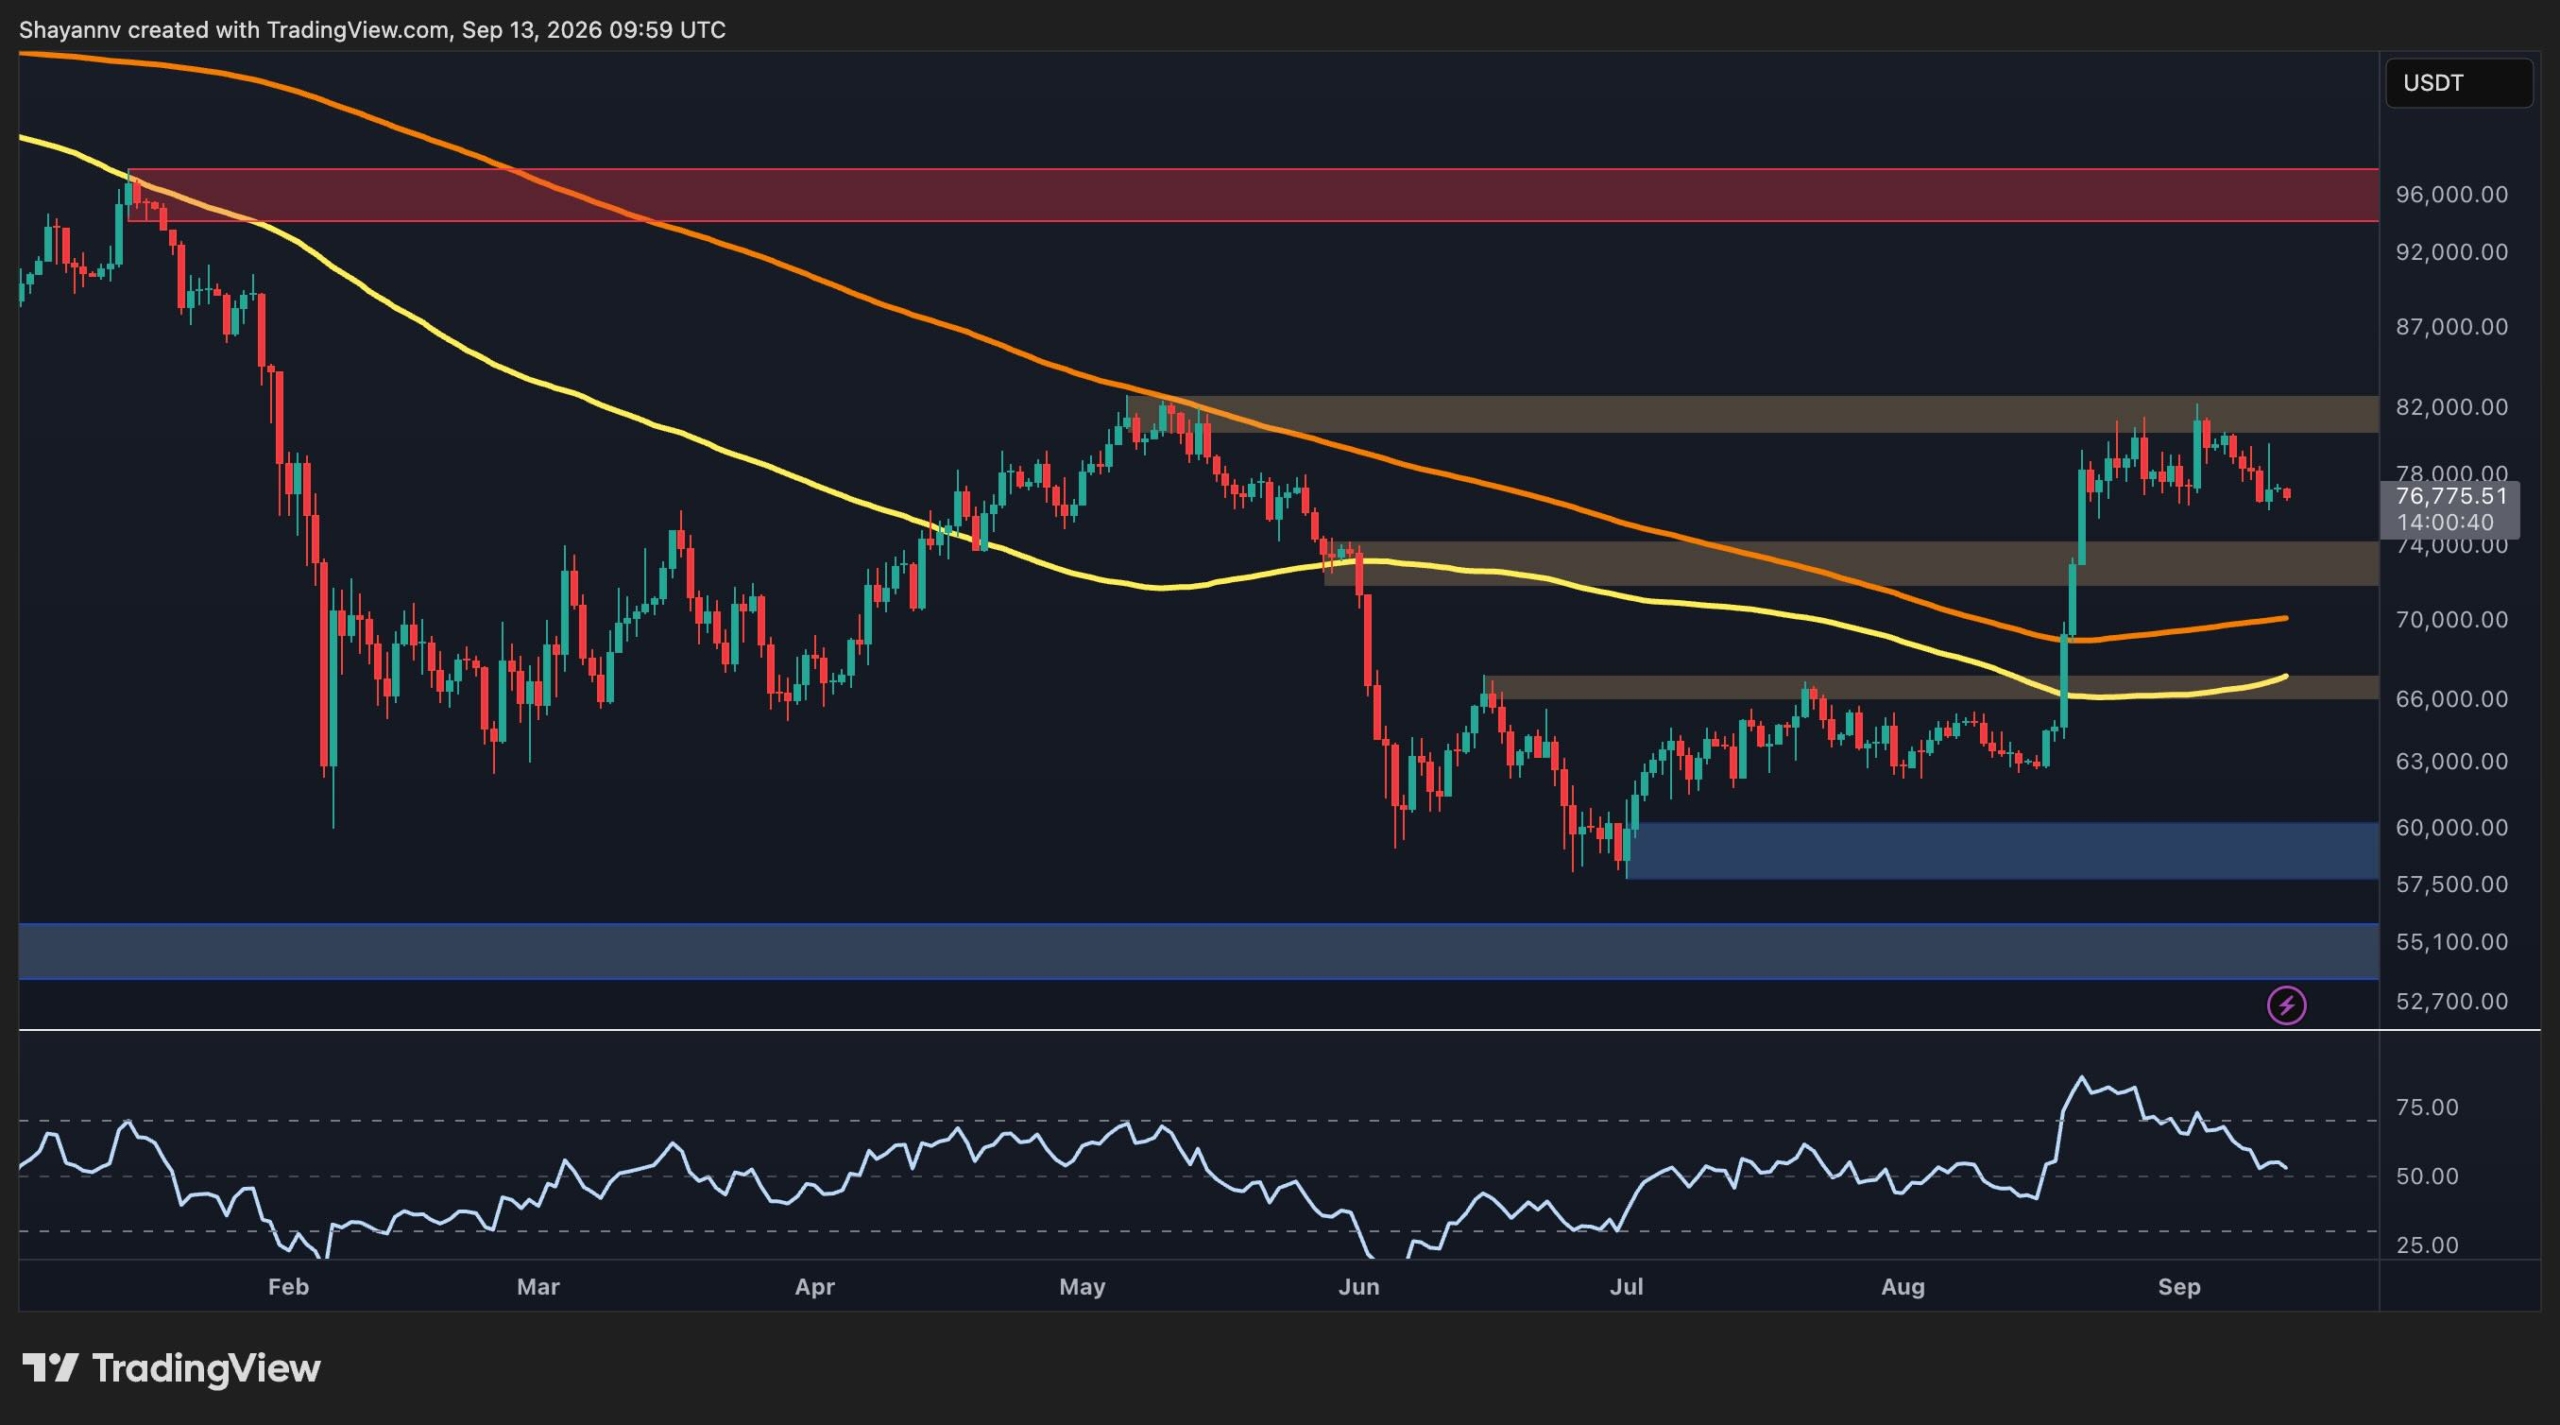
Bitcoin is currently stabilizing around $77,300 after a notable breakout from the $67,000 level. While the overall trend has shown marked improvement, BTC is encountering significant resistance in the $80,000 to $82,000 range. Additionally, the most recent Coinbase Premium data indicates that the demand for spot purchases in the U.S. hasn’t yet confirmed this latest bullish movement.
Bitcoin Price Evaluation: The Daily Chart
The daily chart reveals a vital recovery in structure. Following a decline to the $60,000 demand zone in June, Bitcoin spent several months establishing a solid base before decisively overcoming the $67,000 resistance in late August. This upswing propelled BTC swiftly through the $72,000 to $74,000 range and closer to the $80,000 mark.
The $72,000 to $74,000 area is now the primary support zone. A successful retest of this level would maintain the positive trend initiated by the recent breakout. If it fails, the $67,000 zone acts as a crucial support level, having previously restricted market movement for several months. A more significant correction could refocus attention on the $60,000 demand area.
On the upside, BTC approaches the $80,000 to $82,000 resistance zone. The price has previously tested this area multiple times but has yet to achieve a lasting breakout. A daily close above $82,000 would be pivotal, potentially leading to a move towards the $90,000 level or higher.
BTC/USDT 4-Hour Chart
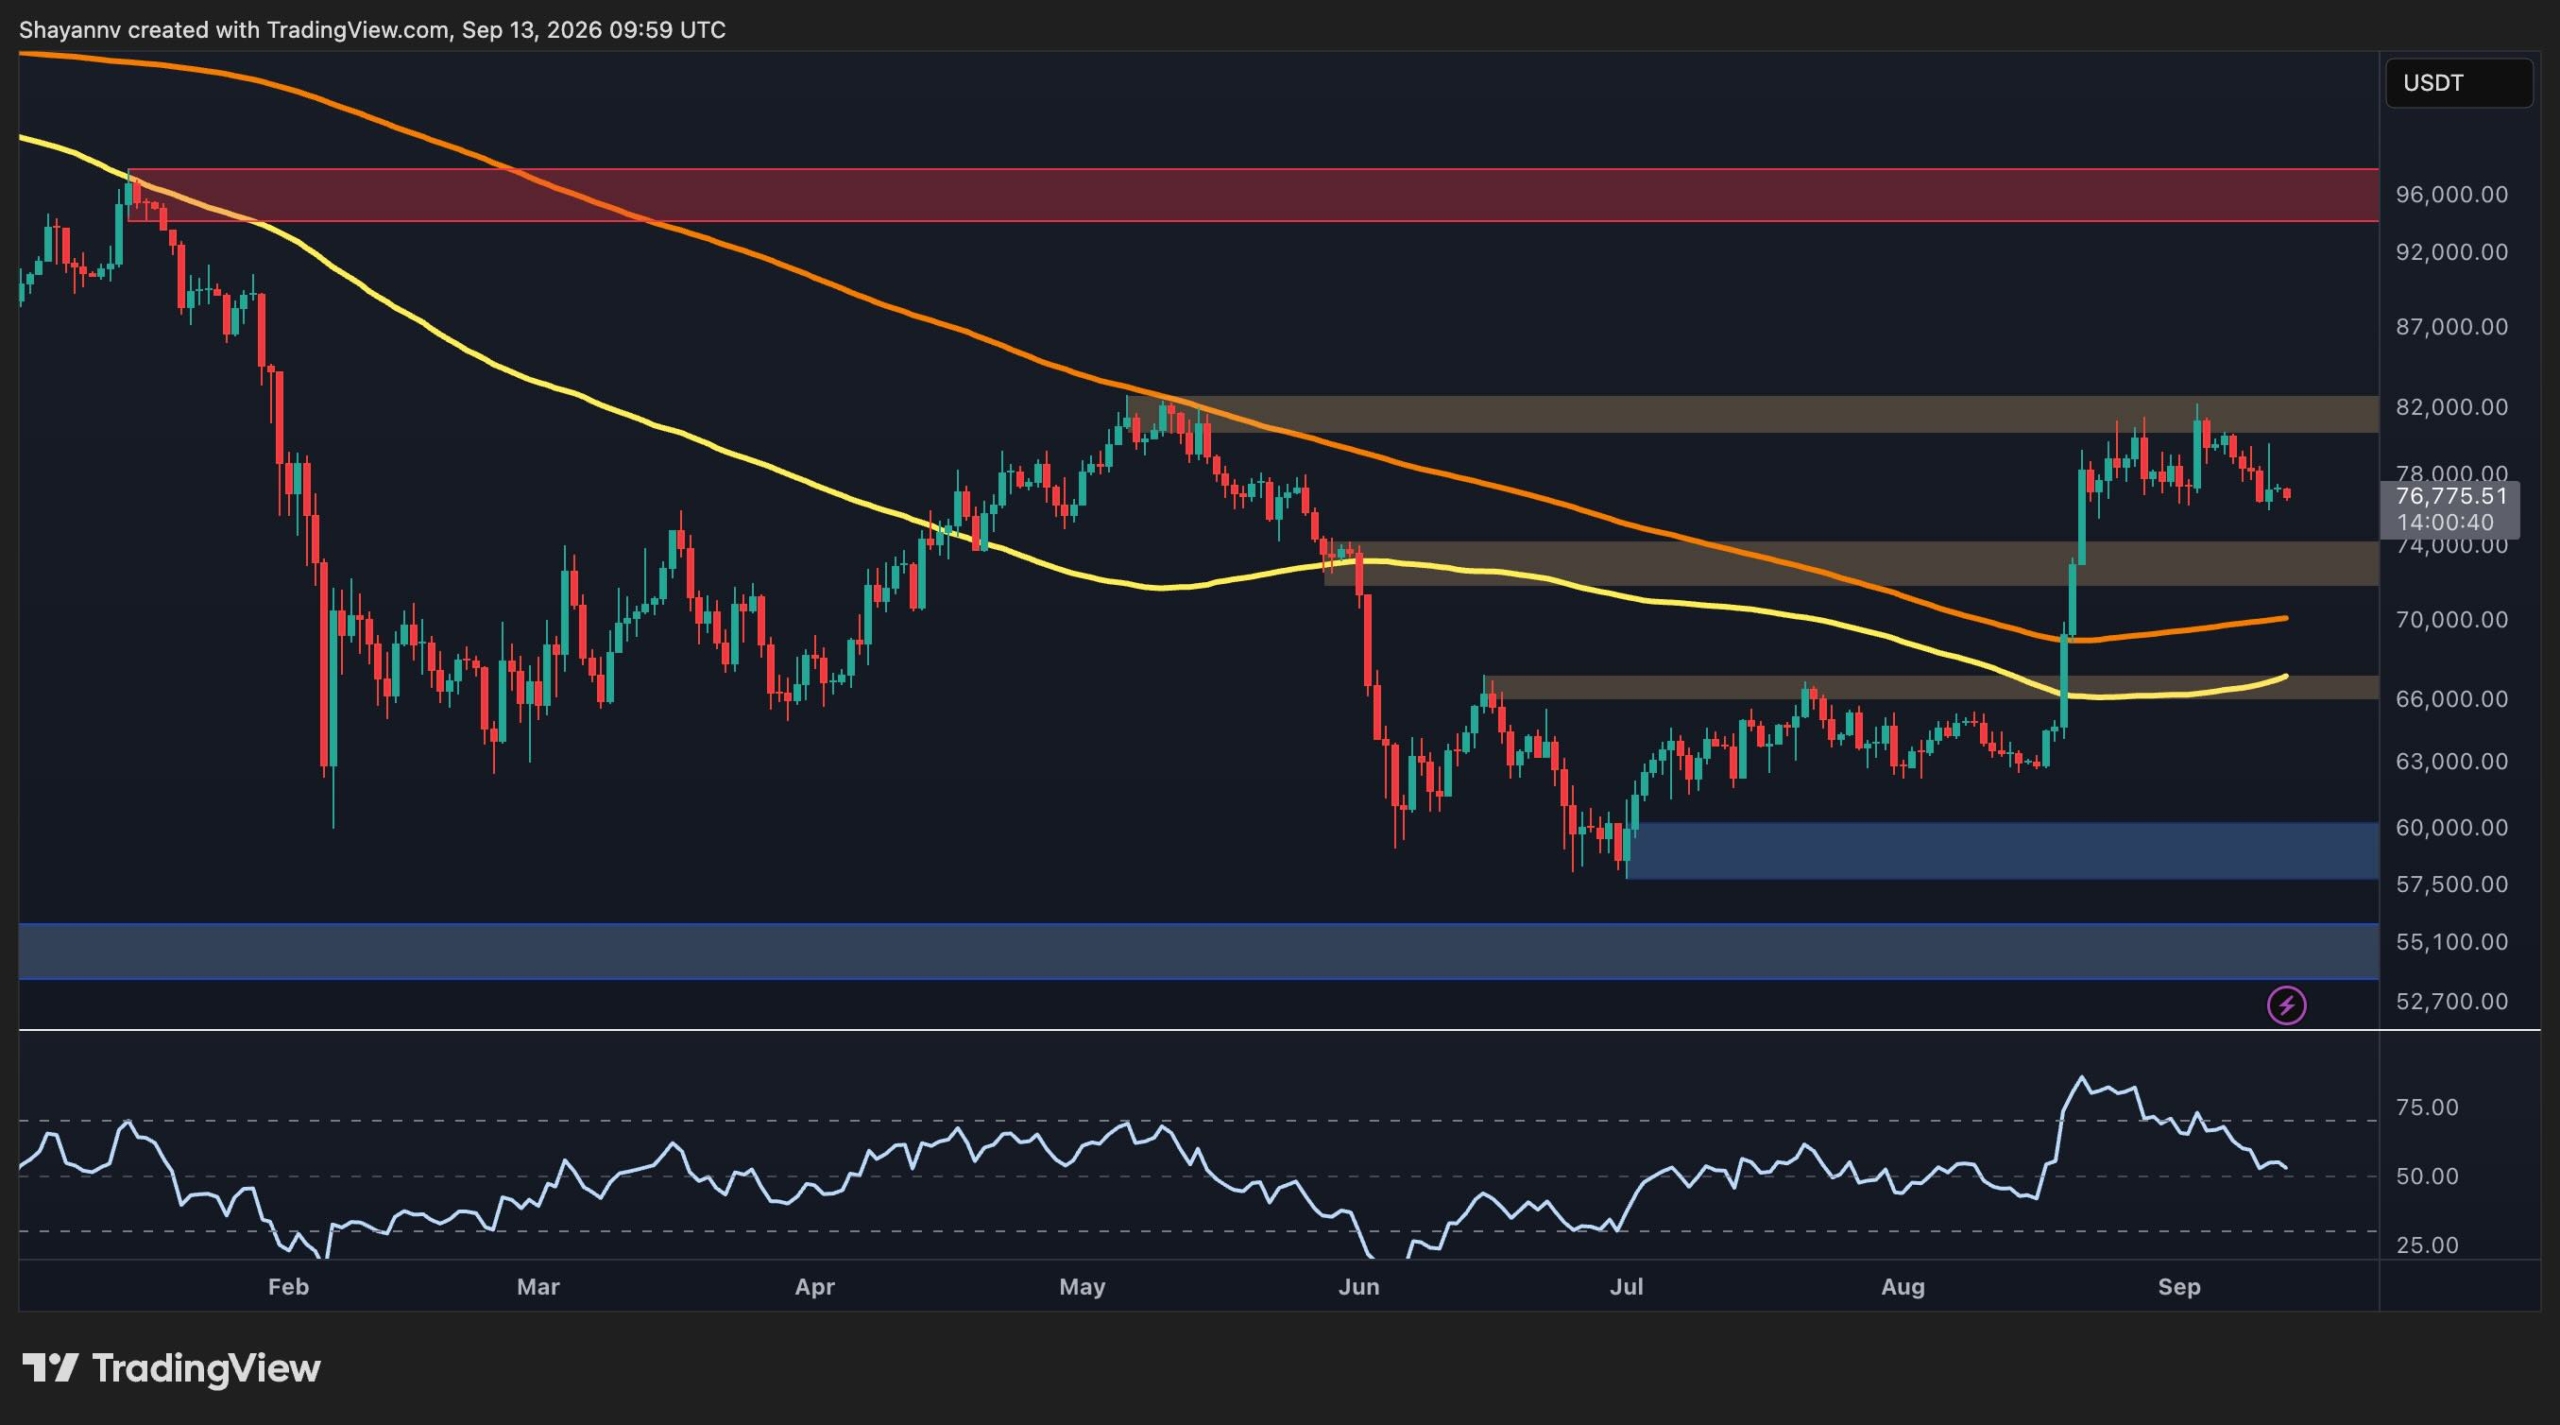
The 4-hour chart offers a clearer insight into the current movement. Bitcoin traded sideways for most of the summer, fluctuating between approximately $60,000 and $67,000 before executing a significant breakout. The surge past the $67,000 resistance accelerated, pushing BTC through to $74,000.
However, after reaching the $80,000 to $82,000 vicinity, the rally has begun to lose steam. Currently, BTC is trading near $76,800 and has formed a broad consolidation beneath this resistance. This could indicate a continuation pattern post-breakout, assuming the lower boundary remains secure.
Immediate support is found around the $72,000 to $74,000 region. This area is crucial because it was the previous resistance that BTC conquered during the breakout. Maintaining this level would support the ongoing series of higher highs and higher lows on the 4-hour chart.
The primary resistance remains situated within the $80,000 to $82,000 bracket. A clear breakout and sustained trading above this range would indicate that buyers are regaining dominance, potentially leading to the next major resistance level of around $95,000. Conversely, if BTC faces repeated rejections and breaks below $72,000, it could result in a deeper pullback toward $67,000.

On-Chain Insights
The Coinbase Premium Index provides a critical perspective on the technical analysis. This index tracks the price disparity of Bitcoin on Coinbase compared to other major exchanges and is often viewed as an indicator of U.S. spot buying pressure. Positive values typically signal higher demand on Coinbase, while negative ones point to weaker U.S. spot demand.
The latest index reading is around -0.02, indicating a return to negative territory. This is noteworthy because, during this period, BTC has maintained levels above those seen prior to the breakout in late August.
This discrepancy reveals that the recent price gains have not been matched by a corresponding increase in Coinbase buying activity. In essence, while the technical landscape appears stronger, the current premium data does not yet support a robust U.S. accumulation narrative.
Historically, during the decline toward the $60,000 level, the Coinbase Premium often lingered below zero, with stronger positive values appearing during various recovery stages. Thus, the current negative reading calls for caution as Bitcoin nears the $80,000 to $82,000 resistance zone.
To bolster the bullish outlook, a positive movement in the Coinbase Premium alongside a breakout above $82,000 would offer stronger validation. Conversely, if BTC falls below $72,000 while the premium remains in the negative, the likelihood of the recent rally evolving into a deeper correction increases rather than transitioning into another upward move.

Disclaimer: Information provided on CryptoPotato reflects the views of the cited authors. It does not represent CryptoPotato’s stance on buying, selling, or holding any asset. We recommend conducting personal research before making investment choices. Use the information at your own risk. Refer to the Disclaimer for more details.