

On September 18, Bitcoin’s price jumped over 5%, surpassing the $80,000 mark as a four-hour trend shift and focused short liquidations propelled its recovery from a low of $75,560.
Summary
- Bitcoin’s value rose by 5.49%, peaking at $81,258.
- It now trades above the 20, 50, 100, and 200-day moving averages.
- The 4-hour Aroon Up indicator reached 100%, while the Supertrend signal turned bullish.
- Key liquidation zones around $81,500–$82,000 may influence Bitcoin’s next movements.
Bitcoin Bounces Back from $75,560
As reported by crypto.news, Bitcoin (BTC) was trading near $80,600 at the time of this writing, following a daily opening at $76,417. The 5.49% increase recovers most of the losses incurred during the previous downturn from the $80,000 mark.
This rebound followed a dip to roughly $75,560, the lowest point for Bitcoin this month. Buyers initially steadied the price near $76,000 before propelling it past the $78,000 and $80,000 thresholds in swift movements.
Bitcoin reached a temporary high of $81,258 during this surge but retreated below $81,000, indicating that sellers remain active at the recent upper limit. Nonetheless, the daily candle remains signficantly positive, with its body exceeding $4,000.
This rebound has allowed Bitcoin to return to the trading range established prior to the sell-off on September 15. To solidify this breakthrough, it’s crucial that the price stays above $80,000, transforming this previous resistance into support and mitigating the risk of another decline into the high $70,000 range.
This rally followed an uptick in bearish sentiment during Bitcoin’s slide below $76,000. Market data indicated that forced buying from short liquidations accelerated the recovery once the price began to overcome nearby resistance levels.
Daily Indicators Favor Bitcoin’s Breakout
Bitcoin has successfully surpassed all four moving averages featured on the daily chart. The 20-day simple moving average is positioned at $78,150, serving as the nearest dynamic support after the breakout.
The 50-day SMA stands at $72,498, while the 200-day and 100-day averages hover around $70,432 and $67,976, respectively. Bitcoin’s standing above these longer-term averages maintains the broader recovery structure, despite the volatility observed in September.
The daily relative strength index (RSI) has climbed to 62.93, surpassing its moving average of 57.38. An RSI above 50 indicates that bullish momentum is strengthening while remaining below the typically monitored overbought level of 70.
This suggests Bitcoin is accumulating momentum without exhibiting extreme RSI levels. A rise beyond 70 could indicate increased buying pressure, but it may also heighten the risk of a short-term pullback if the price encounters resistance near $82,000.
The daily framework still places Bitcoin beneath the local highs from May, as well as the upper limits of its recent trading range. Bulls need to see a daily close above approximately $82,000 to confirm a higher high and substantiate that the September correction is over.
Bullish Signal on 4-Hour Bitcoin Charts
The 4-hour Bitcoin chart observed a bullish Supertrend conversion during the latest upward movement. The indicator now indicates bullish support around $77,828, while the price has cleared the previous bearish Supertrend level at $78,597.
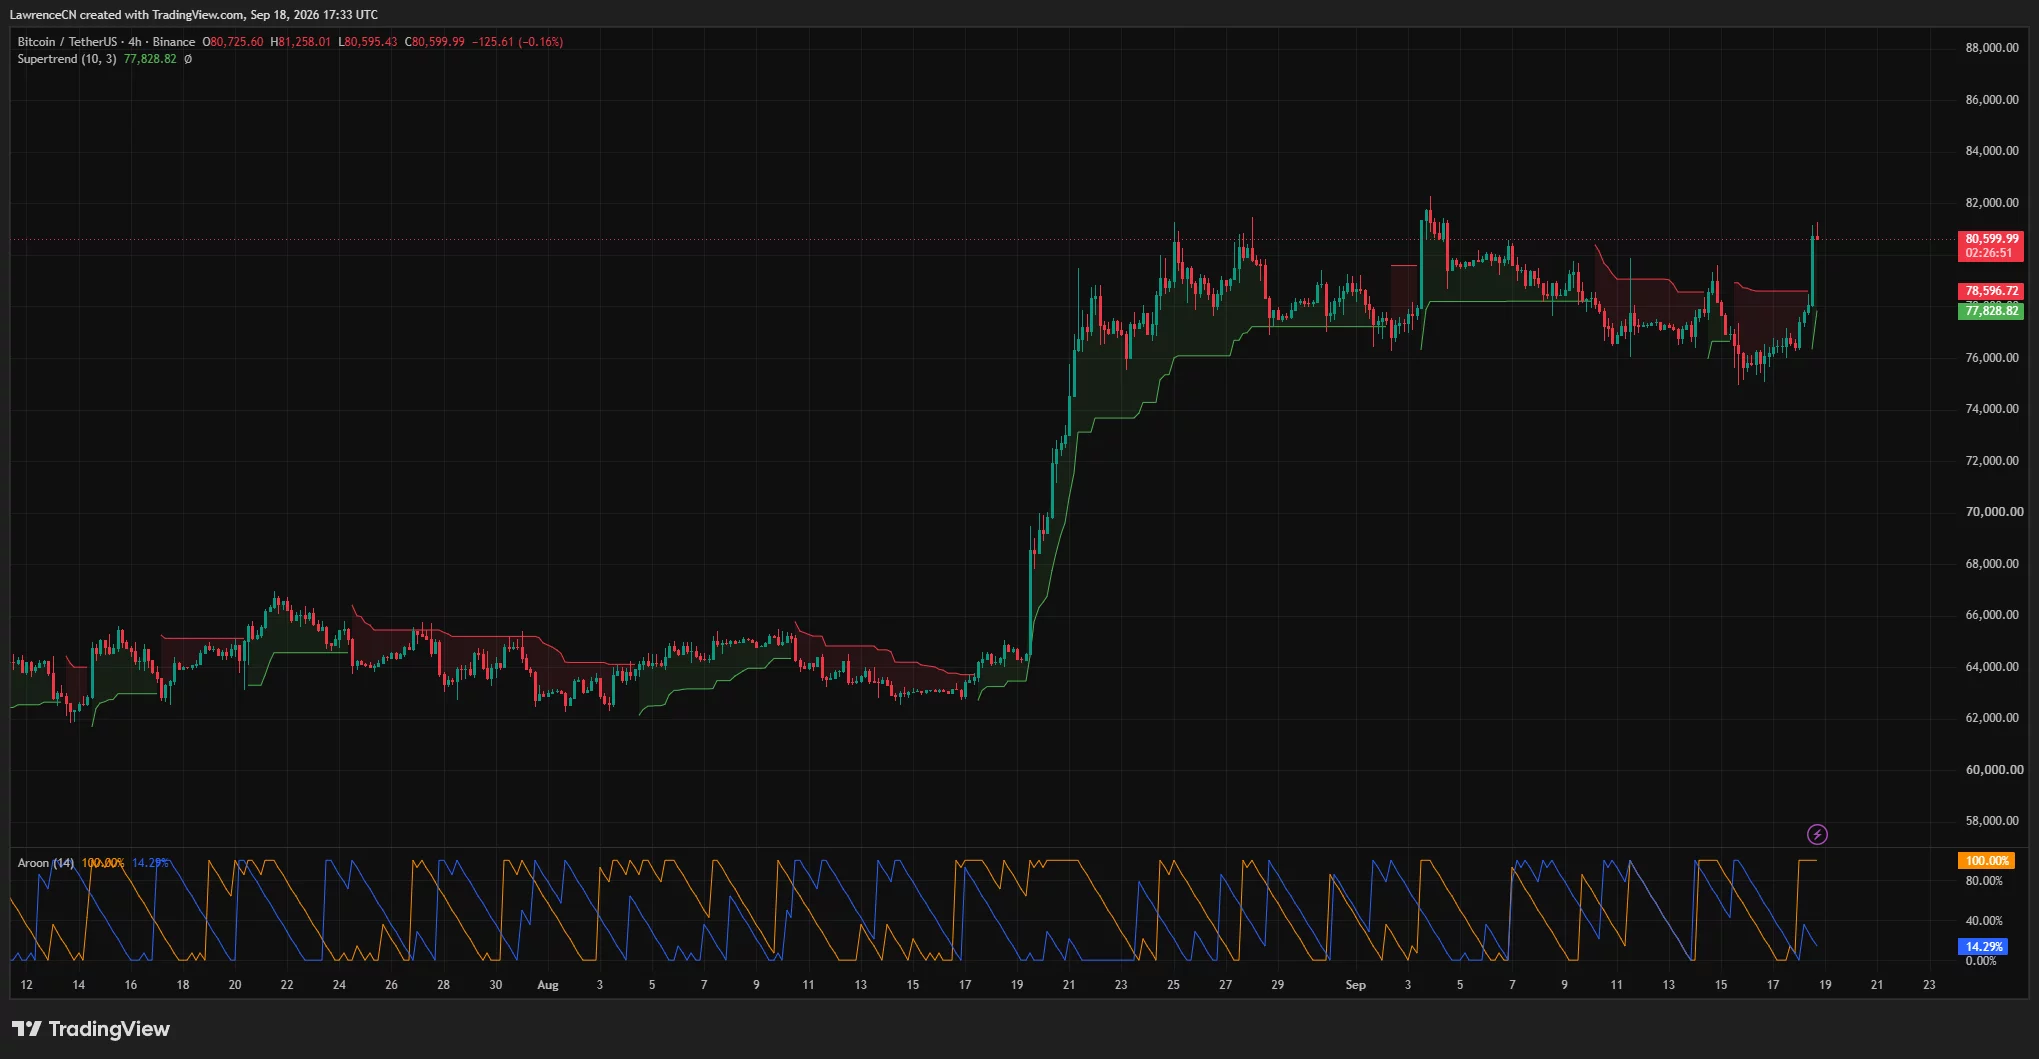
Closing above this previous resistance bolsters the breakout as it indicates that buyers sustained control beyond just the initial price surge. The $78,600 zone may now act as support during subsequent retests.
The Aroon indicator displays a significant shift in short-term momentum, with Aroon Up hitting 100%, while Aroon Down fell to 14.29%, suggesting that the latest high occurred significantly later than the most recent low.
Bitcoin might experience a cooling off period following its steep 4-hour advance. A pullback that holds between $78,600 and $80,000 would maintain the new bullish framework, while a drop below the Supertrend support level at $77,828 would jeopardize it.
A drop below $77,800 could cause Bitcoin to slip back towards $76,000 and the monthly low of approximately $75,560. Falling below this low would negate the immediate recovery setup and potentially lead back toward the daily moving-average range between $72,500 and $70,400.
Liquidation Map Highlights $82,000
According to CoinGlass’s 24-hour Bitcoin liquidation heatmap, there are substantial leveraged-position clusters above the current market price. The closest significant concentrations are observed around $81,500 and $82,000, with additional liquidity extending towards $84,000.
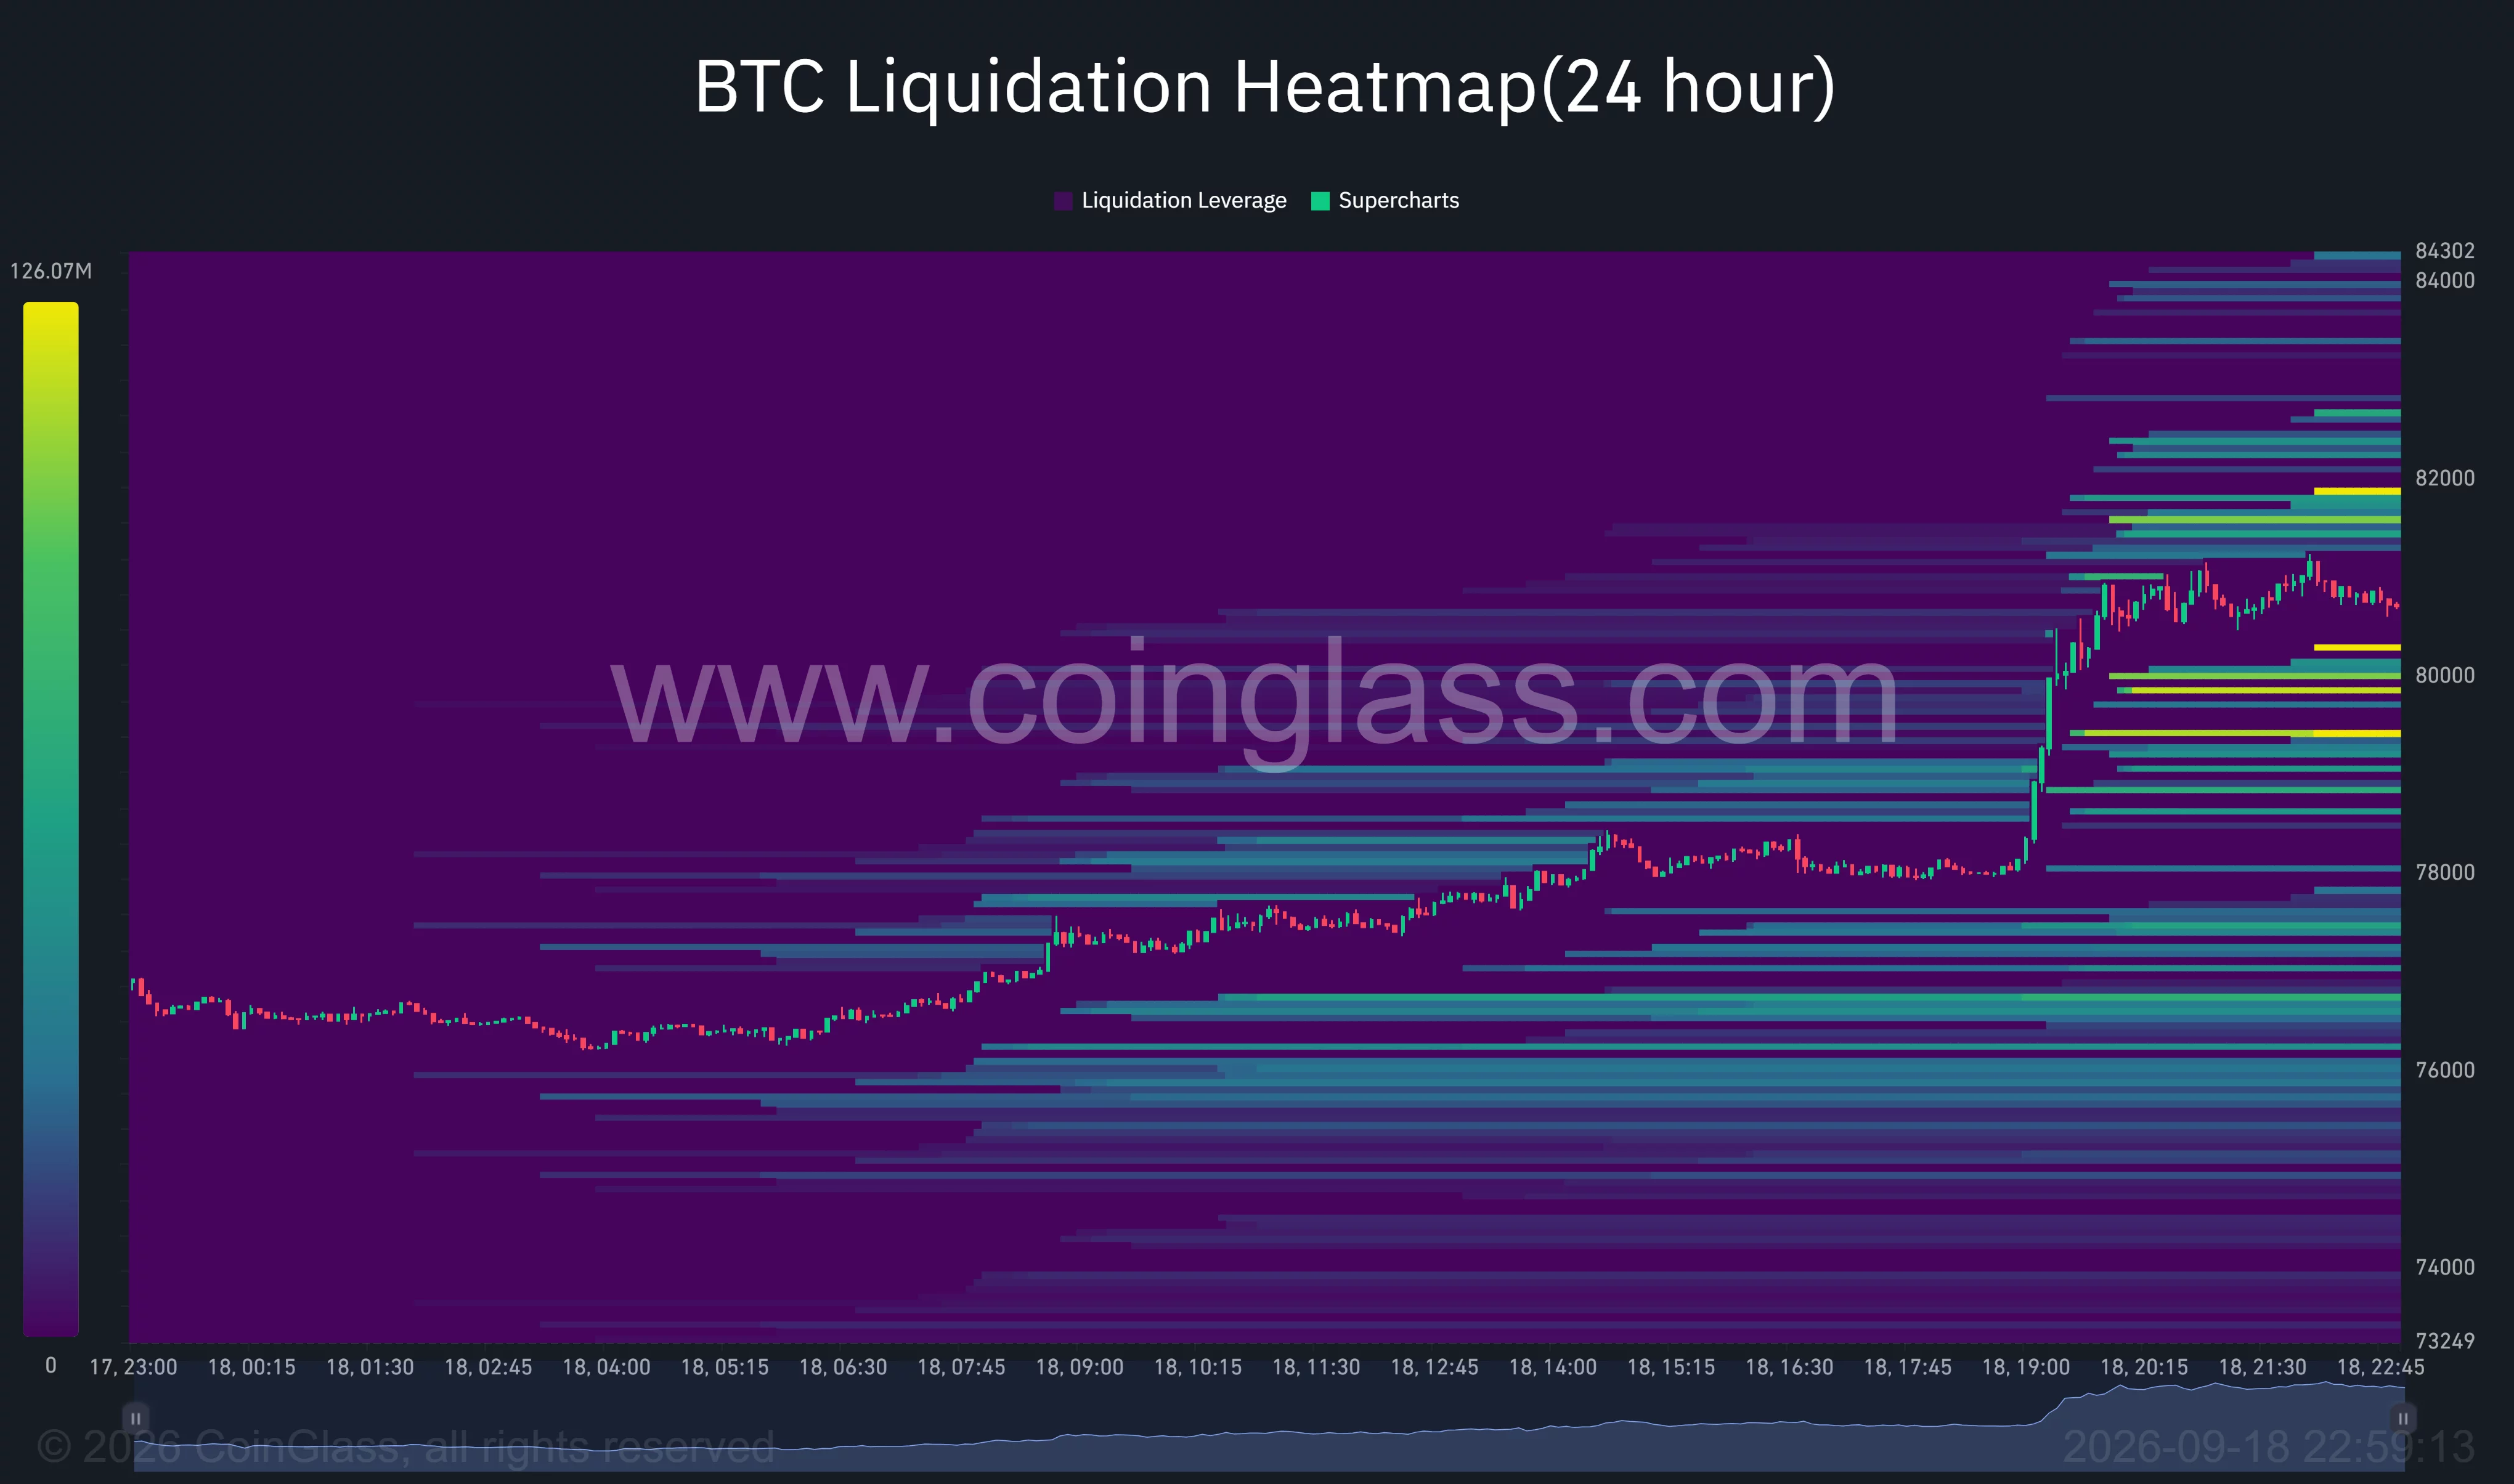
Short leveraged positions could face forced liquidation as Bitcoin ascends into these ranges. Such liquidations create buying pressure in the market, which may amplify momentum if the price surpasses $81,500 with enough volume.
The heatmap also indicates liquidity below the current market level around $80,000 and $79,300. Additional larger bands appear between roughly $76,000 and $77,500, making that zone a potential target if Bitcoin fails to sustain its breakout.
It is worth noting that liquidity concentrations do not guarantee a price movement to those levels. Instead, they highlight areas where leveraged positions might be vulnerable, raising the likelihood of volatility as Bitcoin approaches them.
To maintain a bullish trajectory, Bitcoin must break above the intraday peak of $81,258, followed by a sustained progression through the $81,500–$82,000 liquidity zone. A successful breakout would set the next focus around the $84,000 threshold.
Analyst Predicts Bearish Channel Breakout
Crypto analyst Batman noted that Bitcoin has escaped a descending-channel setup reminiscent of an earlier formation that resulted in a 24% increase. He referenced the current September pattern alongside a channel that emerged prior to Bitcoin’s rise in August.
“$BTC just broke the same descending channel setup that led to a 24% move last time,” the analyst stated.
Batman suggested that this latest breakout has room for further extension, although the previous 24% gain does not assure a repeat performance. Confirmation of this breakout hinges on whether the price can remain above the channel while overcoming the impending $82,000 resistance.
For U.S. traders, the next challenge will involve watching how the rally maintains itself through the coming session, as deeper spot and derivatives liquidity could either affirm the breakout or reveal it as a mere short-covering reaction. Until Bitcoin demonstrates a daily close above $82,000, the charts indicate a short-term bullish reversal rather than a confirmed breakout from the broader range.
Disclosure: This article is not investment advice. The information and materials provided here are for educational purposes only.