

The forecast for Bitcoin as of September 22 remains optimistic, remaining above $80,837. The cryptocurrency $BTC appears to be maintaining its stance within a descending triangle, marking a significant week as it closed above its 50-week moving average for the first time since November 2025.
Bitcoin Price Breakdown: Will $BTC Overcome Its Current Triangle?
Currently, $BTC is trading close to $81,338, showing a slight increase of 0.22% today, while settling within a descending triangle that has formed since reaching a peak of approximately $82,900 earlier in September:
- Stable support: $75,559, near the Parabolic SAR indicator
- Diagonal resistance: links lower highs from the September peak towards a current apex near $81,500
- Significant high zone: $81,500 to $82,900, which has been tested but not sustained on a daily timeframe
Observations from market behavior indicate a shift occurring near $76,700, followed by a structural break that drove the price closer to this week’s high. A confirmed breakthrough above $82,087, which is this session’s peak, might position the upper high zone back in reach for the first time since early September.
Key Support and Resistance Levels for $BTC
Bitcoin Update: $BTC Reclaims Its 50-Week Moving Average After Nearly a Year
BREAKING: Bitcoin achieved its highest weekly close in four months and reclaimed the 50-week MA for the first time since November 2025. pic.twitter.com/K4wkX902nB
— Bull Theory (@BullTheoryio) September 21, 2026
For the week ending September 20, Bitcoin closed above its 50-week moving average, a first in 45 weeks—a potential indication that the bearish cycle may have concluded, as noted by Alex Thorn from Galaxy Research, according to CoinDesk. $BTC experienced an increase of nearly 6% over the week and has bounced back by 29% in the last 35 days. This notable week closed well above the average, as opposed to merely grazing it intraweek, a detail that analysts regard as significant.
Related: Cardano Price Prediction for Q4 2026: Can ADA Surpass the $0.24 Resistance?
Galaxy Research examined historical Bitcoin drawdowns since 2011 and identified 13 instances where $BTC ended a week above its 50-week average. Out of these, 11 did not experience subsequent new lows. Four key instances that preceded substantial rallies include:
- January 2012: $BTC soared nearly 600 times from about $2 to around $1,200 by late 2013
- October 2015: $BTC surged roughly 100 times to reach nearly $20,000 by December 2017
- May 2019: $BTC jumped approximately 22 times from around $3,200 to over $69,000 by November 2021
- March 2023: $BTC increased nearly eightfold from about $15,500 to nearly $126,000 by October 2025
Two previous recoveries failed to sustain during the turbulent phase from late 2021 to early 2022, when $BTC temporarily surpassed the average before dipping back towards $16,000. Presently, $BTC trades near $81,450, with the 50-week average at $78,115, providing some support, albeit minimal.
Bitcoin Update: $BTC Rises Amid Heightened Geopolitical Tension
This is quite unusual.
Bitcoin has reclaimed $81,000, while $ETH has returned to $2,600, all while “WW3” trends globally.
Recent events include a significant escalation in the Russia-Ukraine conflict with a drone strike.
CNN is reporting that Trump is preparing for major military operations against Houthis in Yemen.
The US-Iran… https://t.co/s5wO9TZsYf pic.twitter.com/knlLFHt4dK
— Ash Crypto (@AshCrypto) September 20, 2026
The surge in Bitcoin’s price coincides with, rather than being influenced by, a less volatile geopolitical climate. Trader Ash Crypto noted that $BTC is trading above $81,000, and $ETH has climbed back to $2,600, even as discussions of “WW3” circulate globally amidst significant tensions involving Russia-Ukraine and ongoing conflicts in Yemen and Iran.
Ash Crypto suggested that this trend underscores Bitcoin’s potential as a safe-haven asset, highlighting that $BTC has risen 51.9% compared to gold since the onset of the US-Iran conflict. However, this assessment reflects personal interpretation rather than a proven shift in how institutions allocate assets to Bitcoin, though it aligns with ETF inflow patterns indicating steady investment amid a chaotic macroenvironment.
Bitcoin ETF Trends: Cumulative Inflows Exceed $55 Billion
On September 18, US spot Bitcoin ETFs recorded an influx of $433.03 million, marking a third consecutive inflow day after $159.45 million on September 17, following an outflow of $295.98 million on September 16. The total net inflows have reached $55.16 billion, with $4.67 billion traded that day and total net assets at $102.53 billion.
The weekly statistics further support the recovery narrative, with the week of September 18 reflecting a modest $6.21 million net gain, rebounding from a $462.73 million outflow in the previous week—a pullback from three profitable weeks that saw gains exceeding $3.8 billion from mid-August to early September.
Fidelity’s FBTC led the inflow with $310.72 million on Friday, followed by BlackRock’s IBIT at $108.44 million. The IBIT remains the largest fund by total assets, standing at $63.82 billion, while Grayscale’s GBTC, which has experienced a cumulative outflow of $27.84 billion since switching from a trust, currently holds $10.33 billion in net assets.
Bitcoin Derivatives: Short Positions Dominate a Quiet Liquidation Day
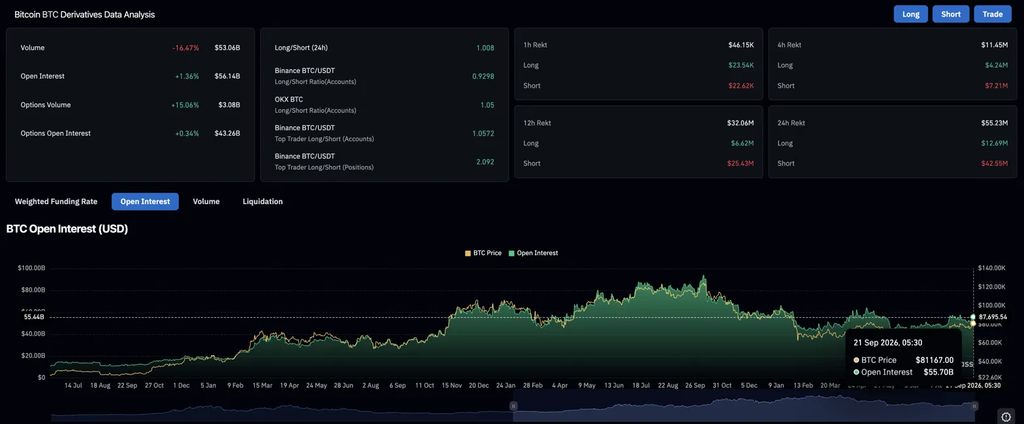
The volume of $BTC derivatives decreased by 16.47% to $53.06 billion over the last 24 hours, although open interest rose by 1.36% to $56.14 billion. Traders are holding their positions even with a slowdown in trading.
Short positions faced the brunt of the day’s losses, tallying $42.55 million in losses compared to just $12.69 million for long positions, a trend that persisted over the past 12 hours as well. Binance’s overall positioning remains nearly balanced, but larger accounts favor long positions at a ratio of 2.092.
Bitcoin Price Forecast: Possible Outcomes for September 22
Optimistic Scenario, Target: $84,000
If $BTC breaks above the resistance of the descending triangle and surpasses $82,087, establishing a solid base within the high zone, it could potentially lead to upward movement toward $84,000 or higher, especially with ongoing ETF inflows and sustained maintenance of the 50-week average.
Pessimistic Scenario, Support Level: $75,559 (Parabolic SAR)
Should $BTC fail to hold the triangle’s support around $80,837, a slide toward the Parabolic SAR at $75,559 may occur. A repeat of the unsuccessful reclaim of the 50-week average observed in late 2021 and early 2022, or a reversal in ETF trends could set this course, exposing lower support near $57,900.
Frequently Asked Questions
If $BTC manages to break through $82,087, it might advance toward $84,000. However, if support near $80,837 is lost, it could head towards the Parabolic SAR at $75,559.
Closing a week above this long-term indicator for the first time in 45 weeks may signal the end of a bearish trend, as indicated by Galaxy Research, which found that 11 of the 13 previous instances led to significant rallies, despite two earlier reclaims failing since 2021.
Traders have cited $BTC’s stability amid ongoing international conflicts as a sign that it is starting to behave like a safe-haven asset, evidenced by a 51.9% increase against gold since tensions escalated in the US-Iran conflict.
Absolutely. On September 18, US spot Bitcoin ETFs welcomed $433.03 million in inflows, marking a third consecutive positive session and boosting total net inflows to $55.16 billion.