
Main Insights
-
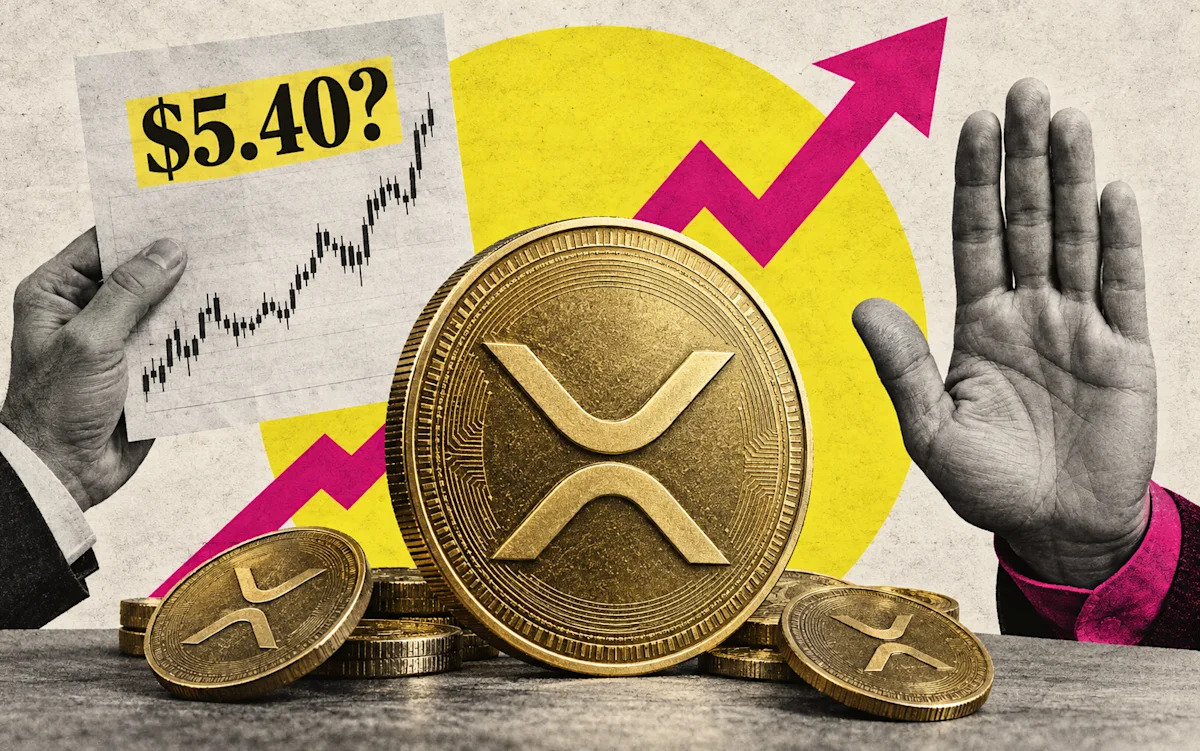
Peter Brandt’s long-term XRP analysis indicates a potential rise to $5.40, approximately 251% higher than the current price of $1.54, with no specific timeline provided.
-
Brandt cautioned that a public price forecast does not equal an actual trade or guarantee trading success.
-
XRP remains beneath its 18-month moving average, situated at approximately $1.88, while increased options-implied volatility suggests possible price movements in either direction.
Experienced trader Peter Brandt has predicted a long-term price target of $5.40 for XRP, indicating significant growth potential as the cryptocurrency seeks to rebound from a previous downturn.
However, this optimistic forecast is accompanied by a critical note: displaying a chart does not equate to having executed a successful trade.
Brandt’s remarks were made as XRP approached the $1.54 mark, with traders assessing the improving momentum against anticipated volatility. Achieving his target from this price would necessitate an increase of about 251%.
His analysis did not specify a timeline, drawing a clear line between a speculative price target and a viable trading strategy central to his message.
Brandt Distinguishes Between Forecasts and Actual Trades
“This is my long-term analysis for $XRP. It suggests an eventual reach of $5.40,” Brandt stated.
He promptly challenged the tendency to equate public forecasts with real trading success.
“A claim or a chart presentation does NOT equal a trade,” he remarked, calling unsupported trading assertions “nonsense” and emphasizing that a social media post is not reliable evidence.
His caution centers on the need for accountability rather than outright dismissal of XRP’s upside potential. A price forecast can accurately identify a direction without proving whether the author took any positions, dealt with losses, or made profits.
Brandt’s professional history states he began trading commodities in 1976 and established Factor Trading in 1980, focusing on proprietary trading and traditional chart analysis.
XRP’s Monthly Chart Indicates a Longer Path Ahead
Brandt’s analysis incorporates monthly XRP/USDT candles, suggesting a longer timeframe for potential gains compared to typical daily trading analyses.
A descending resistance line from the peak in 2018 converges with an ascending support trend originating from the lows in 2020, where XRP eventually broke above that structure during its significant upward trend.
Nevertheless, the cryptocurrency subsequently gave up considerable gains after climbing past $3.

The chart indicates XRP around $1.49, below its 18-month moving average of approximately $1.88, presenting a considerable technical obstacle to thorough recovery.