
According to Peter Brandt, the patterns observed in XRP charts provide sufficient grounds to consider making a trade, although he refrained from setting any specific price targets or directly predicting a breakout.
- In just two weeks, XRP saw a rise of over 14%, coinciding with the accumulation of more than 470 million tokens by large investors within five days.
- Last week, spot XRP ETFs experienced net inflows totaling $75.59 million, marking their 11th week of continuous growth.
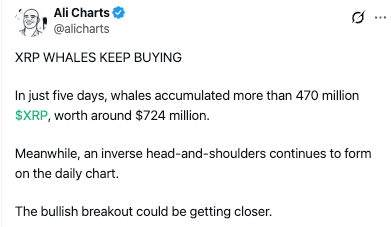
- Analyst Ali Charts indicated that an emerging inverse head-and-shoulders pattern could signal an impending bullish breakout.
Ripple’s XRP (XRP) dipped slightly on Sunday after spot XRP exchange-traded funds (ETFs) marked 11 weeks of sustained inflows. Veteran trader Peter Brandt lent his insights over the weekend, emphasizing the significance of XRP’s chart dynamics without categorizing the community as ‘cult-like’.
According to data from SoSoValue, spot XRP ETFs secured $75.59 million in net inflows last week. This achievement extends their positive streak to 11 weeks, accumulating total inflows of $1.79 billion—a substantial increase of approximately 691% compared to the previous week.
XRP’s value fell by 0.2% in the last 24 hours. On Stocktwits, investor sentiment regarding XRP remained predominantly ‘bullish,’ despite lower conversation levels during that time.
Analysis of XRP’s Chart
The surge in ETF inflows along with recent accumulation patterns has bolstered XRP’s bullish technical outlook, catching the attention of seasoned trader Peter Brandt.
Brandt shared a long-term chart for XRP on Saturday, commenting that interested investors don’t have to be staunch supporters of the cryptocurrency. “It’s not essential to be a die-hard follower to own crypto $XRP,” Brandt remarked.
“The charts themselves have always been sufficient reasons to consider a bet. Distinguishing between being open-minded and lacking critical thinking is vital,” he elaborated. However, he did not state a precise price target or forecast a breakout explicitly.
Emergence of a Bullish Chart Formation
XRP’s value surged by over 14% over the last two weeks, with large investors acquiring 470 million XRP—valued at roughly $724 million—within a five-day span, as noted by analyst Ali Martinez. On Friday, Martinez highlighted an inverse head-and-shoulders pattern emerging on XRP’s daily chart, suggesting that a bullish breakout “could be approaching.”
Over the course of this year, XRP has experienced a decline of over 16% and a significant drop of more than 45% in the past year.
For further reading: NEAR Surges to a One-Year High, Outperforming Bitcoin After Bitwise Files for Spot ETF
For news updates and corrections, contact newsroom[at]stocktwits[dot]com.