

The world of cryptocurrencies is currently facing a tougher landscape, experiencing a pullback from the gains achieved following last week’s breakout. Bitcoin is now hovering around $83,000, down from approximately $87,000 the previous week. Demand in spot markets has yet to match the level of ETF investments and increased activity in derivatives markets. Despite this, the stronger US dollar and rising bond yields seem to be exerting minimal pressure on Bitcoin’s price at this time.
Bitcoin Price Chart (D1 Interval)
Analyzing the Bitcoin chart reveals that the cryptocurrency has already experienced two significant bullish movements. While the momentum has slowed, there’s still a possibility of a rebound towards the $87,000–$90,000 range. Notably, the EMA200 and EMA50 indicators have formed a “golden cross” for the first time in 2023. Important resistance levels are identified at around $92,000 and $97,000, respectively.
Source: xStation5
Bitcoin Buying Pressure Resurfaces Amid Key Market Changes
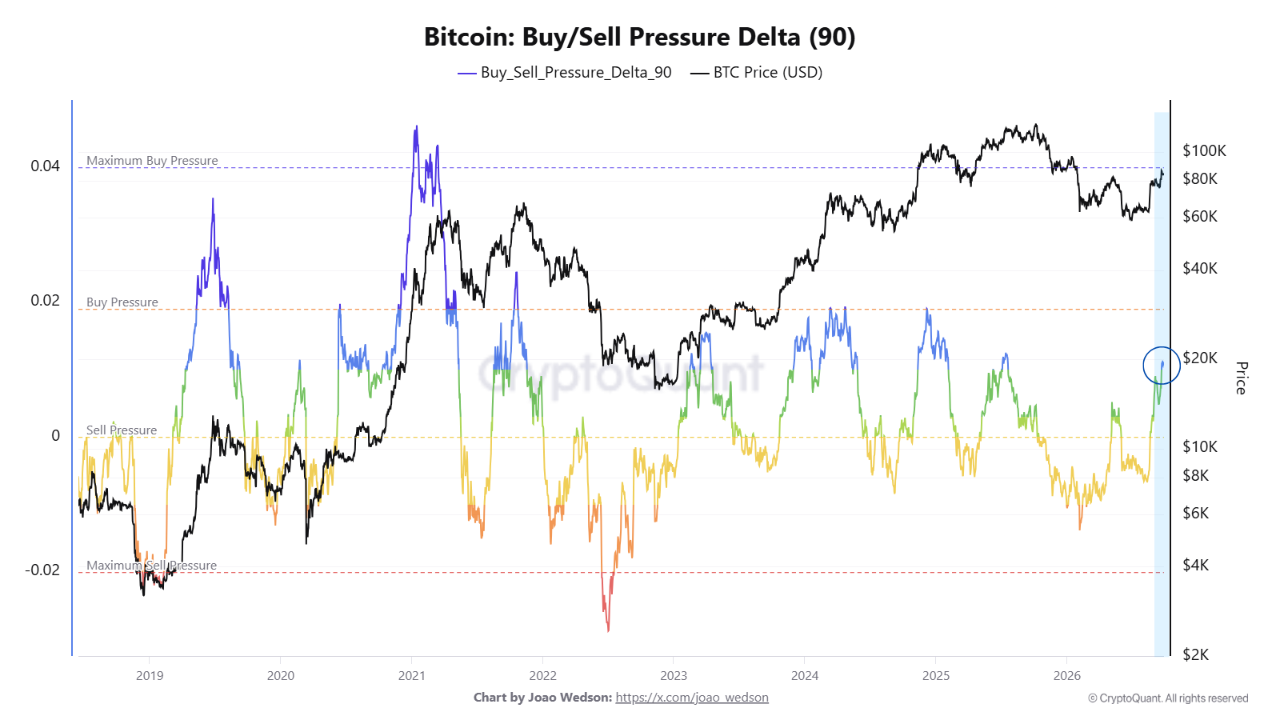
Recently, Bitcoin’s 90-day Buy/Sell Pressure Delta has bounced back from a negative state, implying that buyers are beginning to regain control. As Bitcoin’s price recovers, this trend appears positive. However, the indicator still lags behind levels typically associated with robust demand growth.
The sustainability of this uptick remains crucial. A similar transition to positive territory in early 2023 preceded a significant price rise, whereas a comparable shift in mid-2025 was less reliable and ultimately diminished. This illustrates that a positive reading alone does not guarantee a new trend; it merely reflects a shift in the balance of buying and selling activity over the past 90 days.
From an on-chain perspective, this market stage underscores the need for further validation. If the delta continues to rise and enters higher buy-pressure zones while Bitcoin maintains its price recovery, it would signal a solid improvement in demand. Conversely, stagnation around current levels or a decline while prices ascend could lead to a negative divergence, indicating waning support from underlying demand.
Thus, the key question isn’t just whether the delta stays positive but whether buying pressure continues to grow. The current figures suggest a resurgence in demand, but only time will tell if this rebound can transform into a more sustained trend.
Source: CryptoQuant
Examining Spot Demand Against Futures
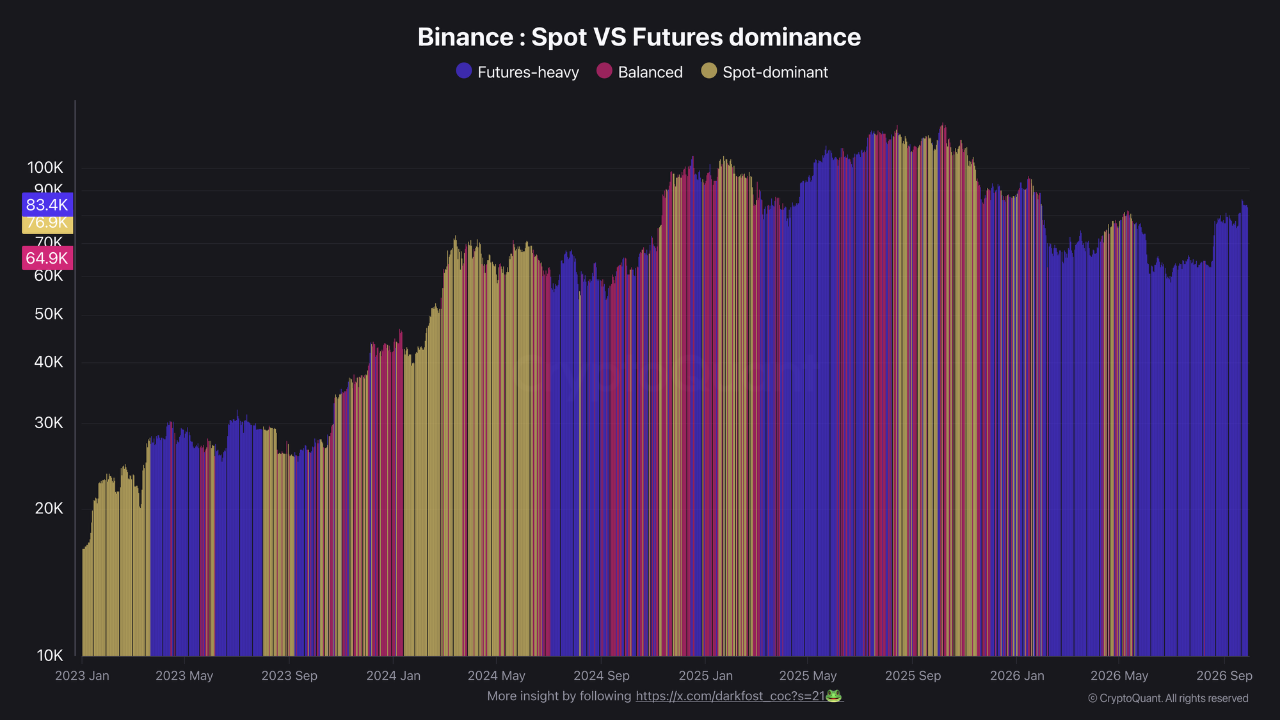
The market structure for Bitcoin is heavily skewed towards derivatives. On Binance, which sees a significant share of both spot and futures trading, the ratio of spot to futures volume is currently around 0.12. This indicates that roughly 90% of market activity is driven by futures, with about $9 in futures trading for every $1 in the spot market.
While futures dominance alone is not inherently bearish, there have been numerous past bullish phases where returning speculative capital to derivatives initiated stronger price movements. The challenge arises when this initial drive is not supported by sustained spot demand, increasing the market’s reliance on leverage and short-term positions.
At present, such confirmation is lacking. Open interest on Binance has decreased from approximately $10.6 billion to $9.2 billion in the past week, suggesting some easing of leveraged positions. However, spot trading volumes remain insufficient for a meaningful improvement in market structure. This indicates that while some excessive leverage has been curtailed, it hasn’t been replaced with significant capital inflow into the spot market.
This distinction is vital when evaluating the rebound’s quality. If price increases primarily depend on futures without an accompanying rise in spot volume, the market remains vulnerable to steep corrections, liquidations, and sentiment shifts. A healthier scenario would involve Bitcoin maintaining its price recovery while increasing spot activity and a gradual decline in futures dominance.
Source: CryptoQuant
MVRV Z-Score Holds Above Annual Average: Does the Structure Favor Bulls?
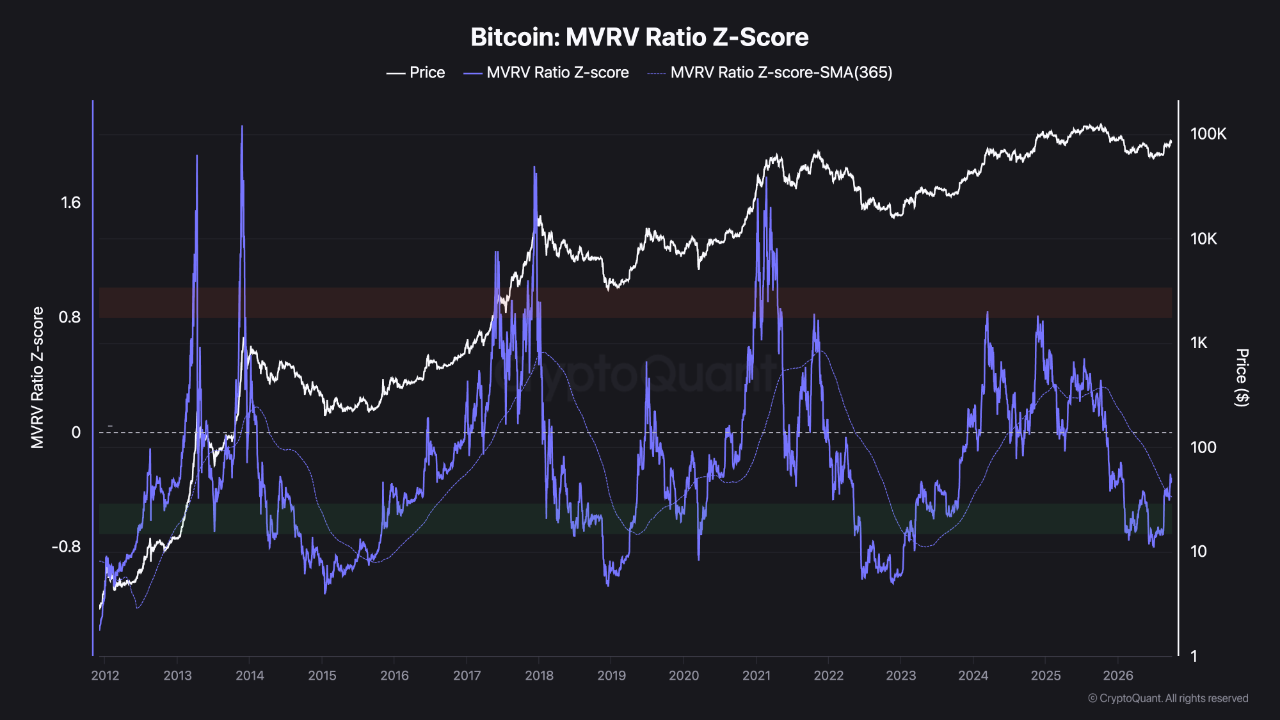
The MVRV Z-Score indicates how Bitcoin’s market valuation compares to the average on-chain acquisition price of BTC, as well as its historical range. Very high values typically signal overheated phases, while significantly negative readings have often marked long-term market bottoms. In the current market context, the relationship between the MVRV Z-Score and its 365-day moving average plays a crucial role.
Historically, once the indicator decisively surpasses this average, the 365-day line has frequently served as support during broader bull-market phases. This doesn’t imply that Bitcoin’s price will rise without any corrections; even in strong upswings, there have been substantial short-term pullbacks while the underlying on-chain structure holds firm.
Thus, the key indicator is not the price volatility itself but the MVRV Z-Score’s position relative to the 365-day average. As long as it remains above this threshold, long-term valuation momentum looks relatively supportive of additional increases. A more significant warning would arise if the Z-Score drops below the average and struggles to regain its position quickly.
Therefore, the current situation suggests that the long-term bullish trend remains intact, while still allowing for short-term corrections. The primary risk would be if a correction begins to compromise the longer-term valuation patterns evident in the on-chain data.
Source: CryptoQuant