
The technical assessment for Ethereum portrays a bullish yet cautious outlook, as ETH▲$2,518.27 faces significant resistance after rebounding from the $1,700 mark in July 2026. Currently, ETH trades at $1,920, with trading volumes ranging from $12 billion to $19 billion across various cryptocurrency exchanges.

Contents
Current Ethereum Price: Understanding Why ETH Is Approaching a Key Resistance Level
Overview of Current Price Action
Ethereum has shown a robust recovery from the significant $1,700 threshold and is currently challenging the upper boundary of its July trading range. Buying pressure has pushed the price above both the 20-day and 50-day exponential moving averages (EMAs). Nonetheless, several strong resistance points exist between $1,940 and $2,000:
- The prior breakdown point
- The psychological barrier at $2,000
- The 100-day EMA, situated around $1,950–$1,970
- The supply zone where short sellers are closing their positions
- Fibonacci retracement points from the earlier downtrend
Therefore, breaking above the key threshold of $2,000 is essential. A successful breakout would allow bulls to target levels between $2,100 and $2,150, subsequently aiming for $2,250 to $2,300.
Read more: BitMine’s Tom Lee on Why ETH Prices Are Dropping Yet Continues Ethereum Accumulation
Drivers of Ethereum’s Recent Price Movement
Ethereum has gained momentum in a risk-on environment, thanks to easing inflation fears, rising Bitcoin values, the closure of short positions, and inflows into spot exchange-traded funds (ETFs).
Furthermore, the bullish outlook for Ethereum is bolstered by reduced speculative activity, leading to increased demand and enabling price growth without excessively high funding rates.
Key Influencers Traders Are Monitoring
Key factors propelling Ethereum upward include:
- ETH closing above $2,000
- Strength in BTC▲$77,666.00
- Inflow into ETH spot ETFs
- Revisions downward in U.S. interest rate forecasts
- The Glamsterdam upgrade for Ethereum
- Growth in stablecoins and decentralized financial systems
- Increased spot liquidity without excessive leverage
Ethereum Technical Insight: Key Levels to Monitor

| Level | Technical Importance |
|---|---|
| $2,250–$2,300 | Medium-term resistance |
| $2,100–$2,150 | Resistance extension and supply |
| $1,940–$2,000 | Immediate resistance |
| $1,850–$1,880 | First support after retracement |
| $1,780–$1,820 | Short-term support |
| $1,680–$1,720 | Medium-term support |
| $1,550–$1,600 | Target for bearish breakdown |
Main Resistance Zones
Ethereum’s immediate resistance lies between $1,940 and $2,000. For a bullish breakout to occur, sellers must overcome this level with significant trading volume.
The next significant challenge is $2,250–$2,300, which includes both the previous supply zone and the downward trendline.
Strong Support Areas
The first support level is seen around $1,850–$1,880, marking the bottom edge of the short-term moving average cluster.
The critical level following this is $1,780–$1,820, where a bullish reversal candlestick would signify the formation of a higher low.
The subsequent support area is located between $1,680 and $1,720. A breach below this level could lead Ethereum’s price to target $1,550–$1,600.
Fibonacci Retracement Points
Using the decline from the $2,300 peak to the recent low of $1,550 reveals several key Fibonacci retracement levels:
| Fibonacci Level | Price Target for ETH |
|---|---|
| 23.6% | $1,725 |
| 38.2% | $1,835 |
| 50% | $1,925 |
| 61.8% | $2,015 |
| 78.6% | $2,140 |
Ethereum is presently hovering around the 50% retracement level, highlighting the importance of the $1,900–$2,000 range. The next significant level to observe is the 61.8% retracement at $2,015.
Trendline Insight
Ethereum has successfully breached its downward trendline, signaling an encouraging development for bulls. This move, along with increased volume, sets up favorable conditions for ETH to rise toward the $2,000 mark.
Read more: Arthur Hayes’s Purchase of $3.7 Million in Ethereum (ETH) Following June Loss
However, a trend reversal will only occur when Ethereum establishes a higher low above the $1,800 mark.
Key developments to monitor include:
- ETH closing daily above $2,000
- A successful retest of the breached trendline
- The emergence of a higher-low pattern above $1,800
- Increased volume at the time of breakout
Ethereum Chart Evaluation
Outlook on Daily Timeframe
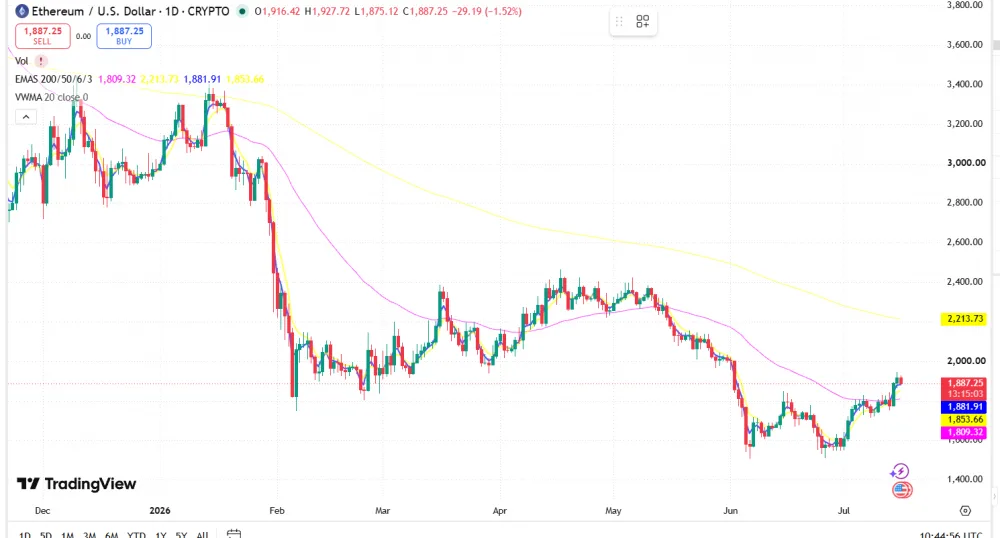
The daily chart illustrates positive movement as the price establishes higher lows and crosses above significant short-term moving averages.
Source: TradingView
Bulls have regained control of the 20-day and 50-day EMAs but are now facing resistance from the 100-day and 200-day EMAs. The next major milestone will be Ethereum’s daily close above the $1,950–$2,000 range.
In a bearish scenario, the price could consolidate between $1,800 and $2,000 rather than breaking above the $2,000 mark.
Structure on the 4-Hour Chart
The four-hour chart reveals higher highs and higher lows, indicating that bulls maintain control but may be losing momentum.
Traders should prepare for potential pullbacks or consolidations. If support at $1,850 is lost, it would suggest a bearish outlook, while a drop below $1,800 would create opportunities for shorts aiming for $1,750.
Weekly Trend Overview
On the weekly chart, the outlook is neutral to bearish despite the recent upward movement.
For bulls to confirm a medium-term uptrend, they must penetrate the long-term moving averages. Bears will continue to dominate until Ethereum manages a weekly close above $2,000 and later above $2,250.
Ethereum Technical Signals
RSI Insights
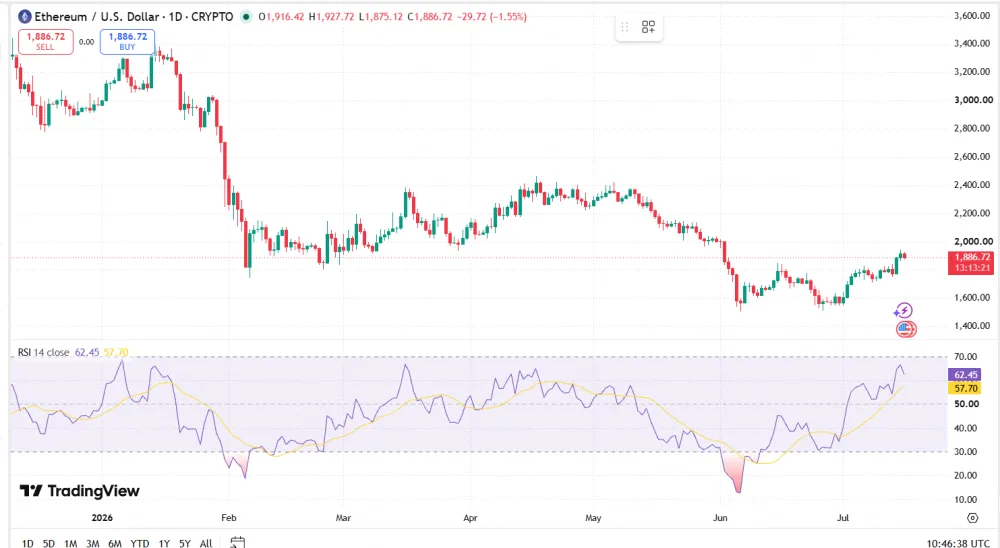
The daily relative strength index (RSI) for Ethereum sits at 62, indicating bullish momentum without entering overbought territory. The four-hour RSI is somewhat lower at 57.
Source: TradingView
A price breakout coupled with an RSI exceeding 70 would confirm that bulls have successfully navigated significant resistance. Conversely, a lower RSI peak could indicate bearish divergence, exerting downward pressure on the price.
MACD Momentum
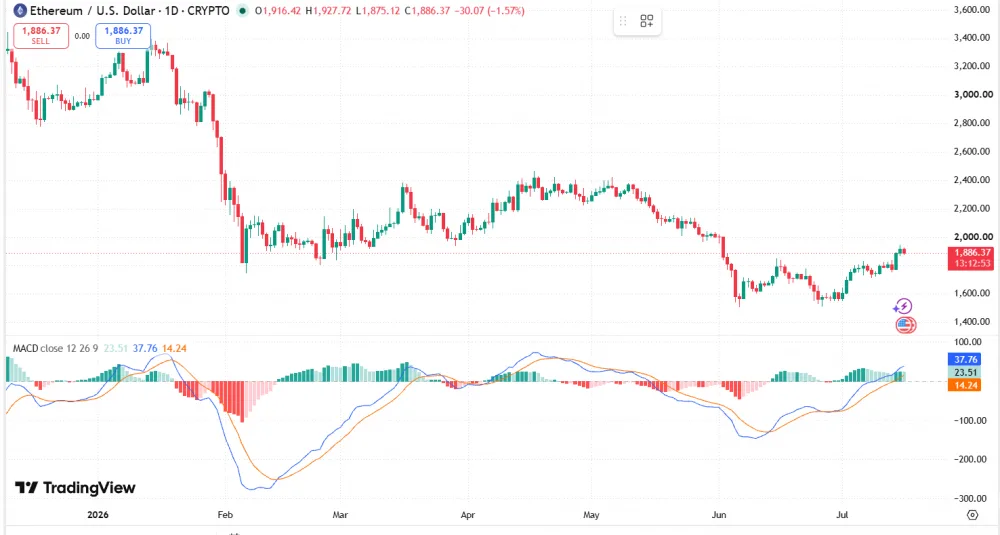
Ethereum’s moving average convergence divergence (MACD) indicator shows a positive trend and has crossed above the signal line, reflecting a bullish crossover.
Source: TradingView
Momentum is improving as the histogram expands. Traders should monitor whether the indicator maintains a positive status during resistance tests.
A bearish crossover occurring below $2,000 would serve as an initial indicator of potential consolidation.
Moving Averages (20, 50, 100 & 200 EMA)
| Moving Average | Approximate Level | Significance on Daily Charts |
|---|---|---|
| 20-day EMA | $1,720–$1,750 | Support in the short term |
| 50-day EMA | $1,800–$1,880 | Reclaimed support |
| 100-day EMA | $1,950–$2,030 | Immediate resistance |
| 200-day EMA | $2,220–$2,530 | Long-term resistance |
The technical outlook for Ethereum is optimistic but requires caution as long as the price remains under the 100-day and 200-day EMAs.
Bollinger Bands
Ethereum has moved closer to the upper Bollinger Band. Consolidating above this level with high volume would be positive. Frequent rejections could push the price back toward the middle band.
Volume Profile and OBV
The volume profile indicates that Ethereum’s primary price discovery area is between $1,750 and $1,900, suggesting a possible consolidation within this range.
On-Balance Volume is on the rise, but bulls require a higher OBV reading to breach $2,000. If this is not achieved, bears may target $1,800.
Related: Why Is Ethereum’s Price Still Declining? ETH Technical Analysis & Market Insights
Is Ethereum Ready for a Breakout?

Bullish Outlook
For a bullish reversal, it’s crucial for ETH to close above $2,000 and successfully retest this level.
This would pave the way for targeting:
- $2,100–$2,150
- $2,250–$2,300
- $2,400–$2,450
A close above $2,300 would further confirm that ETH is entering a medium-term upward trend.
Bearish Outlook
The bearish outlook would come into play if Ethereum fails to maintain levels above $1,940–$2,000.
This scenario would set bears on course to target $1,850 and subsequently $1,800–$1,700. A close below $1,680 would signal a shift of control back to bears.
Confirmation Levels for a Potential Breakout
Several criteria would affirm ETH’s bullish potential:
- A daily close exceeding $2,000
- Heightened trading volume on breakout day
- A successful retest of the $1,940–$2,000 resistance range
- RSI remaining above 50
- Positive signals from MACD
- BTC maintaining critical support levels
- Funding rates remaining stable
Disconfirming the Bullish Thesis
The bullish outlook would lose validity if ETH fails to sustain above $1,800 on the daily chart.
A close below $1,680 would be even more detrimental, particularly if there’s an increase in exchange inflows, a decline in OBV, or an uptick in long liquidations.
On-Chain Metrics Enhancing the Technical Perspective
Exchange Inflows and Outflows
Net withdrawals from exchanges favor bulls by restricting the supply available for immediate sale.
In contrast, significant inflows may point toward upcoming selling pressure. Steady withdrawals or stable flows during ETH’s resistance testing period are essential for bulls.
Whale Accumulation
An uptick in large-wallet holdings can create positive on-chain sentiment if these investors accumulate during consolidation phases.
Whale wallets encompass exchange, custodial, staking, and institutional portfolios. Ongoing increases across various wallets provide a more reliable bullish signal than sporadic large transactions.
Open Interest and Funding Rates
The open interest in Ethereum derivatives has steadily increased, reflecting traders’ optimism about bull opportunities overcoming resistance.
Perpetual funding rates remain around zero or slightly negative, supporting long positions without excessive leverage indications.
Significant growth in open interest during corrections or downturns might trigger profit-taking and liquidations.
Active Addresses and Network Dynamics
Most daily Ethereum transactions stem from transaction and settlement needs, with Layer 2 activities also on the rise.
An uptick in active addresses, stablecoin transactions, trading fees, and decentralized exchange activities would strengthen Ethereum’s technical outlook. Conversely, dwindling daily activities could challenge the bullish narrative.
Macroeconomic Factors Influencing Ethereum
Bitcoin’s Impact on ETH
Bitcoin continues to be a vital external element affecting Ethereum, as major Bitcoin support levels generally dictate ETH’s price trends.
If Bitcoin trends positively, ETH bulls could find opportunities to challenge the $2,000 mark. However, adverse movements could drive Ethereum down toward $1,700.
ETF Activity and Institutional Interest
Increased inflows into spot ETFs are significantly driving demand for Ethereum.
Institutional inflows are advantageous for bulls as they help absorb selling pressure during upward movements. Conversely, repeated ETF outflows could indicate weak institutional interest, benefiting bearish sentiments.
Federal Reserve Policies and Risky Assets
Federal Reserve policies can affect risk assets, including Ethereum.
Increased yields, rising inflation, and a hawkish Fed perspective would create headwinds for ETH. However, decreased yields, lower inflation, and a dovish stance would support risk assets.
Ethereum Ecosystem Developments
Ongoing developments within Ethereum’s network support a longer-term bullish case.
The Glamsterdam upgrade and subsequent initiatives aim to enhance Ethereum’s scalability and security. Enhancements in rollups, account abstraction, censorship resistance, and security features may foster adoption without having an immediate effect on price.
Related: Top 5 Bold Ethereum Price Predictions for 2026: From Realistic to Aspirational Scenarios
Ethereum Price Forecast from Technical Analysis
Short-Term Outlook (Next Week)
Based on Ethereum’s technical assessment, ETH is likely to move within the range of $1,800 to $2,050 over the coming week.
If a close above $2,000 is achieved, bulls may drive prices toward $2,050 to $2,100. If Ethereum does not establish a strong hold above resistance, bears will strategize to keep the price within the $1,800–$2,000 scope.
Medium-Term Outlook (Next 1–3 Months)
Ethereum could face a consolidation phase if unable to surpass $2,000.
A stable close above this resistance would empower bulls to set sights on $2,250–$2,450. A breach below $1,680 may tilt the medium-term market dynamics in favor of bears.
Key Price Targets If Resistance Is Broken
| Bullish Target | Details |
|---|---|
| $2,050–$2,100 | Breakout extension |
| $2,250–$2,300 | Medium-term resistance |
| $2,400–$2,450 | Prior supply and long-term objective |
| $2,600 | Extended bullish scenario |
Downside Targets If Support Fails
| Bearish Target | Details |
|---|---|
| $1,850 | Initial support after retracement |
| $1,780–$1,800 | Short-term structural support |
| $1,680–$1,720 | Medium-term support |
| $1,550–$1,600 | Target for breakdown scenarios |
ETH Trading strategy
Breakout Trading Approach
A prudent breakout strategy would involve purchasing ETH after a four-hour or daily close above $2,000 alongside a bullish retest.
Initial targets could be set at $2,100 before considering $2,250. Traders could safeguard against sudden downturns with stop-loss orders placed below the breakout threshold.
Pullback Entry Strategy
For those using pullback tactics, the $1,850 level could present a viable entry point after observing a bullish candlestick formation.
This strategy may target $1,940 while keeping a stop-loss below $1,800.
Alternatively, a more conservative approach would involve waiting until Ethereum retraces to the $1,780–$1,820 range for a long position after a bullish candlestick confirms. This allows traders to aim for $1,880 while setting a stop-loss underneath $1,750.
Risk Management and Stop-Loss Placement
Traders are advised to only risk a small portion of their capital on each trade.
Stop-loss orders should be determined based on the trading strategy and existing market conditions rather than solely on individual entry points.
For breakout traders, stop-loss orders can be set below reclaimed resistance levels. For those employing pullback strategies, these should be placed below relevant support areas.
Frequently Asked Questions
Is Ethereum bullish at this moment?
In the short term, Ethereum appears bullish but is neutral to bearish on higher timeframes. A reclaim of $2,000 is needed for a bullish medium-term structure, with $2,250 being pivotal for the long-term forecast.
What are Ethereum’s primary support and resistance levels?
Ethereum faces immediate resistance at $1,940–$2,000, followed by $2,100. Major support levels are at $1,850, $1,800, and $1,700.
Is ETH on the brink of a breakout?
Ethereum is at a crucial breakout level, requiring a close above $2,000 to transition to a bullish near-term structure, enabling targets at $2,100–$2,250.
What does the RSI indicate for Ethereum?
The daily RSI is currently in the low-to-mid 60s, suggesting bullish momentum without reaching overbought conditions.
What is Ethereum’s next resistance level?
The upcoming key resistance lies between $1,940 and $2,000. A closure above this range would lead bulls to target $2,100–$2,150.
Is now a good time to invest in Ethereum based on technical analysis?
The chart leans bullish overall, but given Ethereum’s testing of vital resistance, waiting for a confirmed breakout or a favorable pullback could provide clearer risk management opportunities.
Which indicators are most effective for analyzing ETH?
The most reliable indicators include support and resistance levels, volume, moving averages, RSI, MACD, derivative positions, and Bitcoin’s price trends.