

The price of Bitcoin has dipped towards $84,000 after hitting a high of $87,220. Analysts from Bitfinex are highlighting that sustained demand above $86,500 is crucial for potential price increases.
Summary
- Bitfinex reports that 1.39 million BTC is currently located within the $84,000–$86,500 purchasing range.
- U.S. Bitcoin ETFs experienced net inflows of $170.2 million on October 1, following previous outflows.
- Currently, Bitcoin is positioned near the Fibonacci level of $84,012 after its recent decline.
- According to Bitfinex, trading below $81,300, along with persistent ETF withdrawals, could weaken market stability.
According to the analyst team at Bitfinex, the recent influx of funds into U.S. spot Bitcoin ETFs has significantly heightened demand, nearing levels indicative of sustained price growth. They stress the importance of continued buying, particularly in the high-volume bracket between $84,000 and $86,500.
As of late October 2, Bitcoin was recorded at $84,038, following a session peak of $87,220. This reflects a decrease of 0.99%, placing it back within the analysts’ identified purchase range.
Importance of Consistent Buying Above $86,500
Data from the analysts indicates that approximately 1.39 million BTC had a purchasing cost within the $84,000 to $86,500 range as of September 30. Bitfinex categorized this amount as overhead supply, noting that the acquisition prices of these holders play a critical role in evaluating future demand.
The analysts believe that maintaining a trading price above $86,500 would transition this supply into profit territory, clearing a path toward Bitcoin’s yearly opener at $87,722. They emphasize that Bitcoin must continually trade above this range, rather than just touching its peak.
“The current question is whether the demand from spot markets can sustain this upward momentum,” the analysts noted.
In their latest analysis, Bitfinex identified a potential risk: if Bitcoin trades persistently below $81,300, coupled with ongoing ETF outflows, the prevailing market structure may weaken. This warning associates the price point with diminishing demand from funds, rather than the price decline alone being sufficient to indicate a shift.
In a report dated September 30, the analysts noted that holdings purchased between $82,500 and $84,000 had risen to 306,000 BTC, an increase from around 110,000 BTC noted on September 27. They argued that acquisitions in this lower range have lessened the number of coins held by investors waiting to sell at break-even prices.
U.S. ETF Inflows Boost Demand Cushion
In the U.S. ETF market, Bitfinex recorded net inflows of $170.2 million on October 1, following about $149 million in outflows on September 30. These renewed acquisitions have restored the Bitfinex Absorption-to-Emission Ratio (BAER) to about five times the daily issuance of Bitcoin.
This metric reflects the volume of ETF purchases against newly mined Bitcoin. The analysts argue that inflows around five times the daily issuance would support sustained price growth, provided such levels are maintained in subsequent periods.
“We now aim for a consistent inflow around this level,” the analysts stated.
Prior to the uptick, Bitfinex’s BAER dropped from 25.6 times the daily issuance on September 21 to just 1.8 times on September 29. Subsequent ETF withdrawals led to a negative reading for that day, according to the analysts.
In addition to the slowdown in investment buying, they noted a significant decline in futures open interest as of September 29, which has reduced market leverage. They highlighted that removing leveraged positions might diminish liquidation risks but fail to provide the new buying pressure needed for price increases.
Earlier analyses indicated a surge of nearly $999 million into U.S. Bitcoin ETFs on September 21 and $714.7 million on September 22. Wojciech Kaszycki, a strategy advisor to BTCS S.A., mentioned that cash investments were key to initiating the current rally before leveraged positions accumulated.
According to him, it’s essential to track ETF inflows over extended periods and examine the relationship between futures positioning and price movements. He cautioned that risks could escalate if traders added leverage more quickly than cash purchases entered the market.
Daily Chart Indicates Price at $84,012 Level
On the TradingView daily chart, Bitcoin’s price of $84,038 is almost precisely at the 0.618 Fibonacci level of $84,012.25, based on a high of $126,294.44 and a low of $57,876.66 in the retracement.
Above this price level, the chart indicates the 50% retracement at $92,085.55 and the 38.2% level at $100,158.85. Below, the 78.6% level sits at $72,518.06. These levels reflect plotted retracements rather than price targets set by Bitfinex.
The daily relative strength index (RSI) is at 60.69, with a moving average at 64.92. Although the RSI remains above the neutral midpoint at 50, it has yet to surpass its average, suggesting a lower reading than the recent momentum’s smoothed measure.
In the daily Aroon panel, the orange line is at 21.43%, while the blue one is at 0%. The chart indicates that the orange reading has decreased from its recent peak as Bitcoin trades below the highs established during the rally in September.
On the four-hour chart, Bitcoin is trading at $84,168.74, slightly below the middle line of the Bollinger Bands at $84,226.87. The upper band is at $86,091.67 and the lower band at $82,362.08.
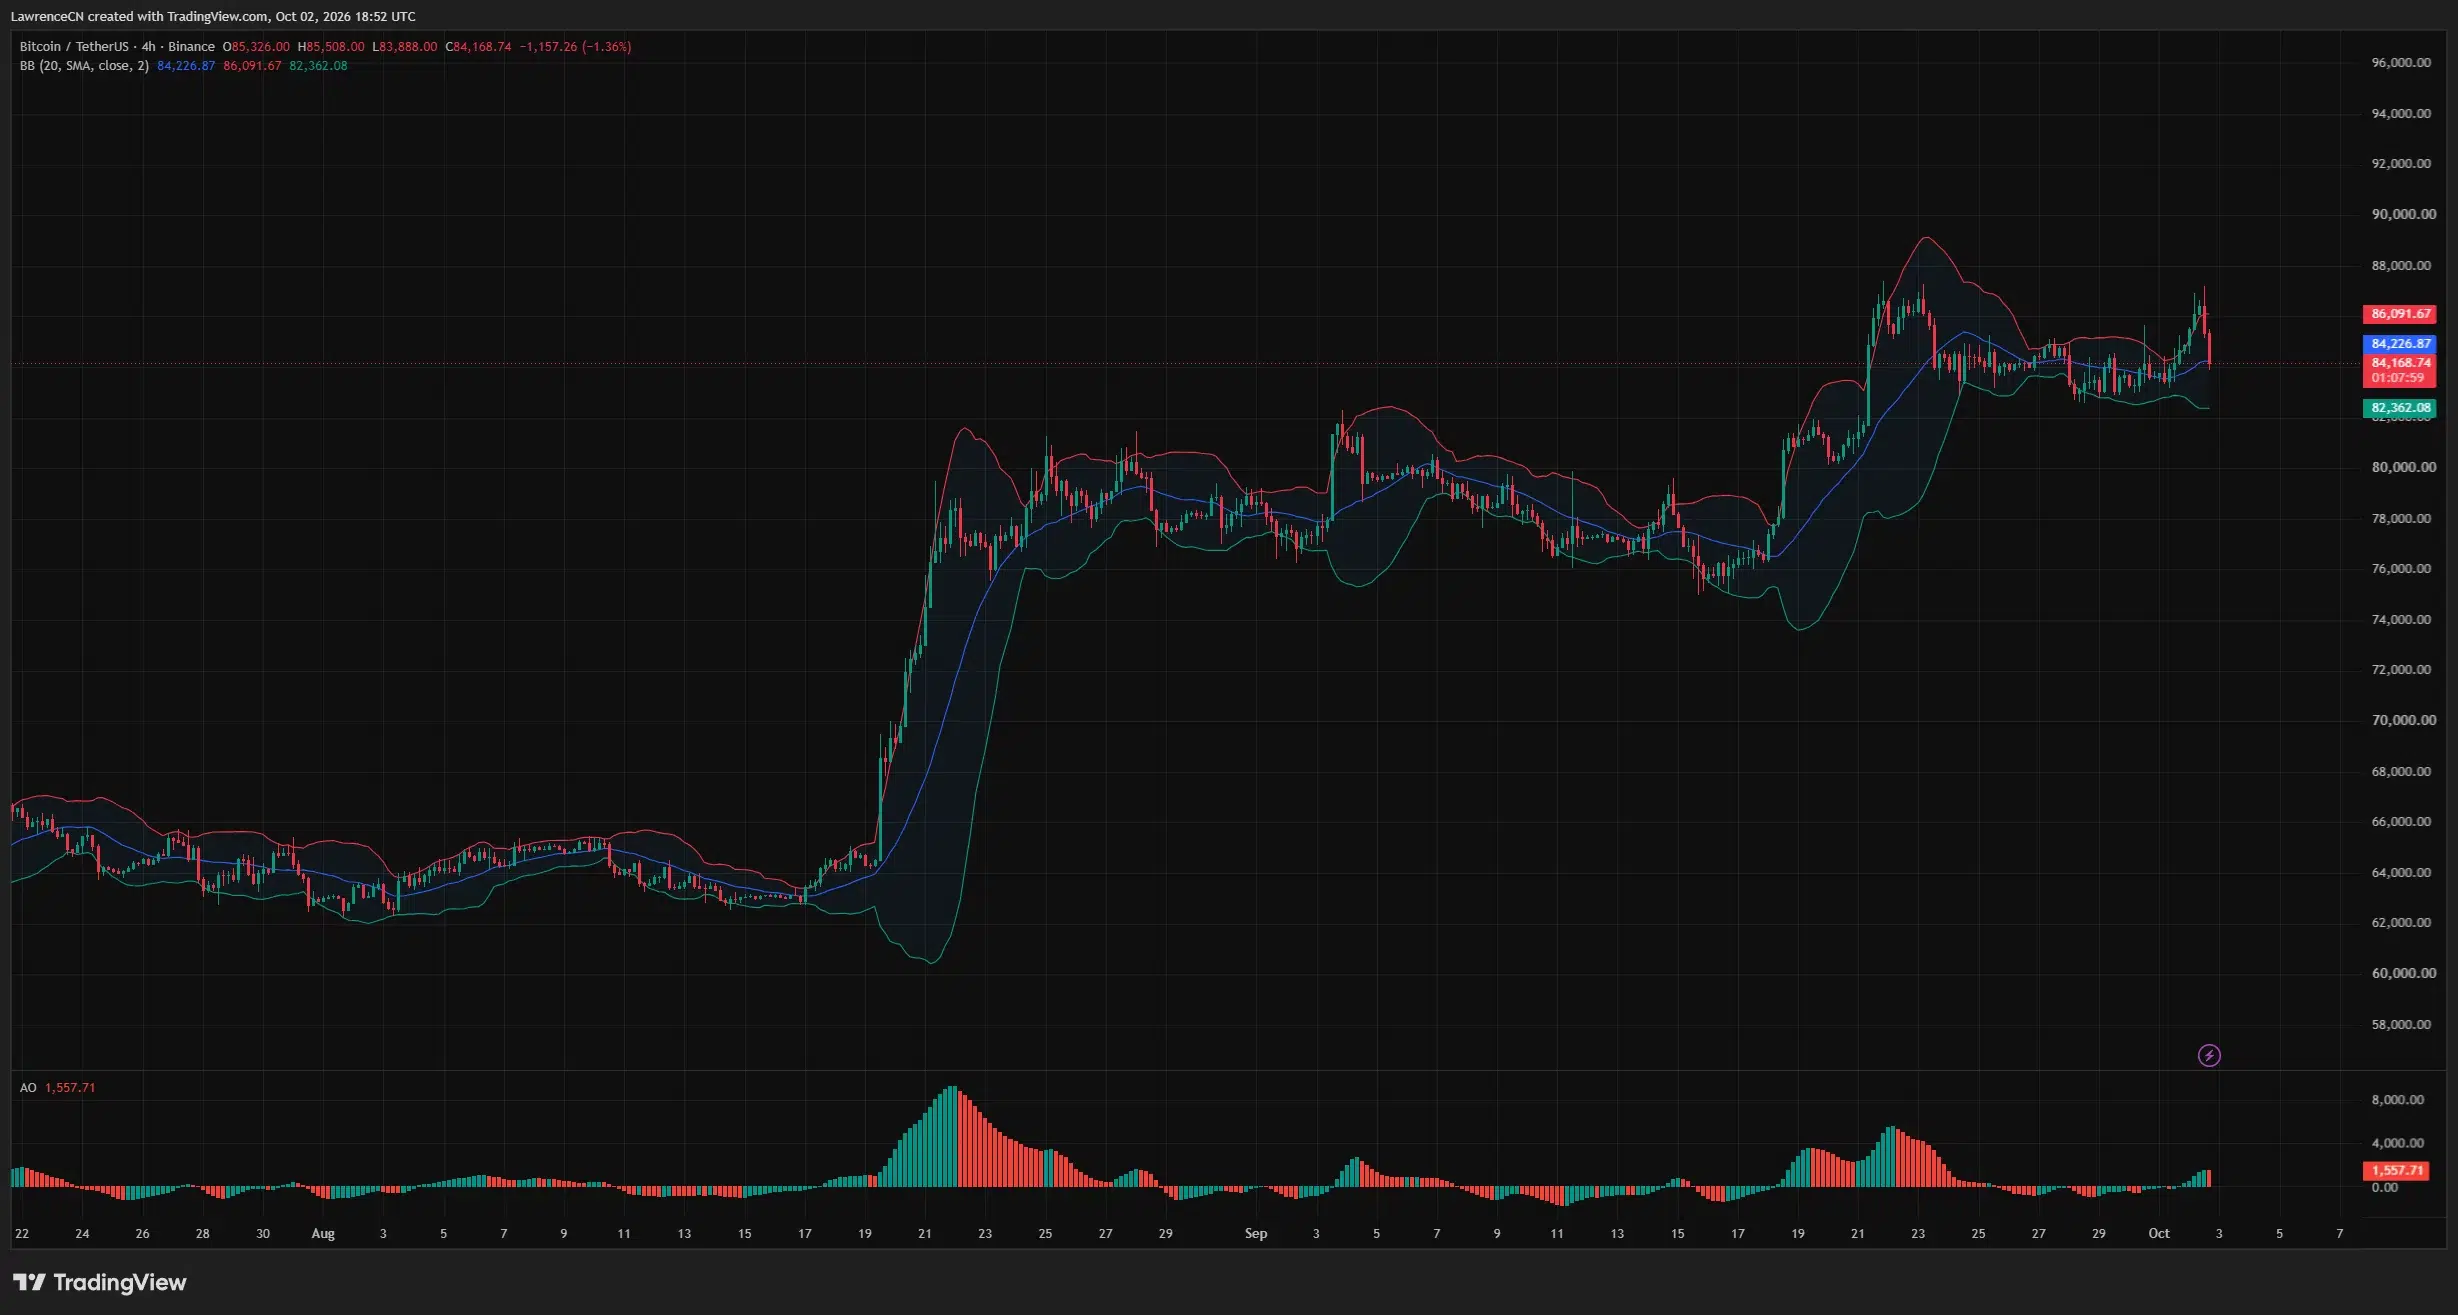
The latest decline has shifted the price from above the upper band toward the midline on this chart. Below the price panel, the Awesome Oscillator remains positive at 1,557.71, although its latest histogram bar is red, indicating a lower reading than the previous bar.
U.S. Economic Data Influences Treasury Yields
In a report from October 2 regarding the Bitcoin rally driven by job growth, it was noted that September’s U.S. payroll figures totaled just 29,000, falling short of the 90,000 anticipated by economists. The unemployment rate edged up to 4.2% from 4.1%, and the previous month’s payroll increase was adjusted from 162,000 to 133,000.
The report mentioned that there were over $120 million in Bitcoin short liquidations within a 24-hour period as prices neared $87,000. It suggested a link between the price surge and the weaker employment data, leading to forced closures of bearish positions.
In their comments, analysts from Bitfinex noted that the softer PCE inflation figures were positive for the Federal Reserve’s policy outlook but not sufficient to improve overall macroeconomic conditions.
Referencing their September 23 Intelligence Update, the team stated that Bitcoin’s rally heavily relied on investment flows while Treasury yields remained relatively stable. They cautioned that any renewed rise in yields could once again transform interest rates into a significant market driver.
Higher Treasury yields generally enhance returns on dollar-denominated assets, which can dampen risk appetite due to a stronger U.S. dollar. The analysts concluded that Bitcoin’s recent surge hints at persistent underlying demand, despite the recent fluctuations in ETF flows.
Disclosure: This article serves as educational content and does not constitute investment advice.